Mixed-Use Retail and Office
For Sale
$1,600,000
Pending
118-122 Hillside Avenue, Williston Park, NY 11596
Versatile storefront and office layout with multiple private rooms and unfinished basement for storage or expansion.
Property Size5,580 SF
Days on Market145
Property Features for 118-122 Hillside Avenue
General Information
Standard status
Pending
Size
5,580 SF
Net Operating Income
$75,000
Taxes and HOA fees
Annual Taxes
$45,000
Amenities
Accessible Common Area, Accessible Entrance
Central Air, Wall/Window Unit(s)
Baseboard, Forced Air, Natural Gas, Oil
Finished, Unfinished, Walk-Out Access
On Street, Open
Building Details
Building Size
5,580 SF
Year Built
1950
Buildings
1
Stories
1
Listing Agency:
Laffey International Realt Estate
Listed By:
Catherine Lattuca
(516) 996-7581
Source:
Evrealestate
Added: May 28
Changed: Oct 12
Last Checked: Oct 19 at 4:49AM
Displayed information is deemed reliable but is not guaranteed and should be independently verified. All listing content including descriptions, pricing, images are the copyrighted material of Laffey International Realt Estate

Ask AI about this property
Review the available facts, identify missing information and prepare questions for the agent.
Investment Insights
Based on property information with market context.
118-122 Hillside Avenue is a mixed-use commercial building designed to support both retail storefront activity and professional office use. The property includes approximately 5,580 square feet with three oversized storefront windows and high ceilings, along with multiple private offices, a reception area, conference area, and bathrooms. A large unfinished basement provides additional storage and can support future build-out needs.
The building is positioned for strong visibility on a heavily traveled main road, with meaningful pedestrian traffic in the surrounding business district. The remarks also note nearby restaurants, boutique shopping, banks, and neighborhood services, with the LIRR described as just moments away.
The interior configuration lends itself to a range of tenant types, including medical, professional, retail, and mixed-use operations. The layout includes offices, reception/conference space, and restroom facilities, along with basement space referenced for storage and flexibility. The building’s described service-tenant setups, including spaces identified for karate, dance, and tailoring, reflect an adaptable format for businesses that need both customer-facing storefront presence and back-office or work areas.
The building is positioned for strong visibility on a heavily traveled main road, with meaningful pedestrian traffic in the surrounding business district. The remarks also note nearby restaurants, boutique shopping, banks, and neighborhood services, with the LIRR described as just moments away.
The interior configuration lends itself to a range of tenant types, including medical, professional, retail, and mixed-use operations. The layout includes offices, reception/conference space, and restroom facilities, along with basement space referenced for storage and flexibility. The building’s described service-tenant setups, including spaces identified for karate, dance, and tailoring, reflect an adaptable format for businesses that need both customer-facing storefront presence and back-office or work areas.
Key Highlights
- Mixed‑use commercial building built in 1950 at 118‑122 Hillside Avenue with approx. 5,580 SF retail/office space
- 3 oversized storefront windows and high ceilings with a versatile retail/office layout
- Multiple private offices plus reception and conference areas
Financial Insights
Estimated NOI and Cap Rate
NOI / Yr
$110,501
Cap Rate
6.91%
Suggested Prices Based on Cap Rates
Cap Rate 5%
$2,210,020
$2.2M
Cap Rate 7%
$1,578,586
$1.6M
Cap Rate 9%
$1,227,789
$1.2M
Market Conditions
NOI Build-Up for 5,580 SF
Gross rent
$167.4K $30.00/SF
− Vacancy
−$9.5K −$1.71/SF
EGI
$157.9K $28.29/SF
− OpEx
−$47.4K −$8.49/SF
NOI
$110.5K $19.80/SF
Area
Nassau County, NY
Vacancy
5.70%
Lease Rate
$30.00 /SF/Yr
Expense Ratio
30.00%
Simulate Cap Rate and NOI
Suggested Prices Based on Cap Rates
Cap Rate 5%
$2,210,020
Cap Rate 7%
$1,578,586
Cap Rate 9%
$1,227,789
Alternative Uses
Best Use
Retail
$1.58M
$1.38M – $1.84M
NOI $110,501 @ 7.0% cap · market cap 6.91%
Second Best
Office B
$1.37M
$1.20M – $1.60M
NOI $95,950 @ 7.0% cap · market cap 6.00%
Theoretical Best
Specialty Retail
$3.69M
$3.23M – $4.30M
NOI $258,256 @ 7.0% cap · market cap 16.14%
Zoning and permitted uses should be independently verified with authorities.
How Realmo checks its estimates
Property Analytics
Unlock full access to Insights
Subscribe to Realmo Intelligence
Open Analytics
Current Use
Location Intelligence
Trade Area within ½ mile
1,918
Businesses Nearby
Under-served
Demand for This Use
Explore this area
Business Placement
Demographics for 11596, NY
10,849
Population
3,450
Households
3.1
Avg Household Size
44
Median Age
56%
College-Educated
95%
High-School Grad
1.3 sq mi
ZIP Area
8,345
Density / Sq Mi
$162,026
Median Household Income
$78,858
Median Earnings
$2,102
Median Rent
$801,500
Median Home Value
Check the figures for this property
Cap Rate, Value Estimation, Potential NOI and more
View Realmo Analytics
Market
Vacancy Rate% for Office in Northeast region

Similar Off Market Nearby
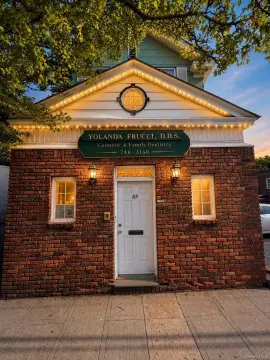
- James Anthony Floral — 265 Horton Hwy, Mineola, NY 11501
- Unique Blossoms Florist — 178 Hillside Ave., Williston Park, NY 11596
Frequently Asked Questions
What type of property is this?
Storefront property - Versatile storefront and office layout with multiple private rooms and unfinished basement for storage or expansion.
Where is this storefront property located?
The property is located at 118-122 Hillside Avenue Williston Park, NY.
What is the asking price?
The asking price for this property is $1,600,000.
What are key features of this property?
This property features: Mixed‑use commercial building built in 1950 at 118‑122 Hillside Avenue with approx. 5,580 SF retail/office space; 3 oversized storefront windows and high ceilings with a versatile retail/office layout; Multiple private offices plus reception and conference areas


