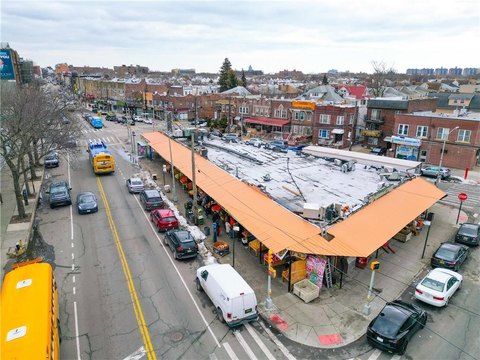
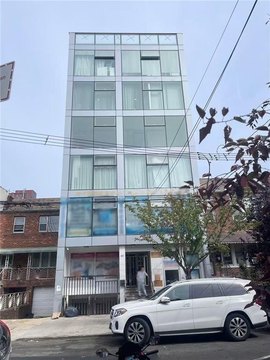
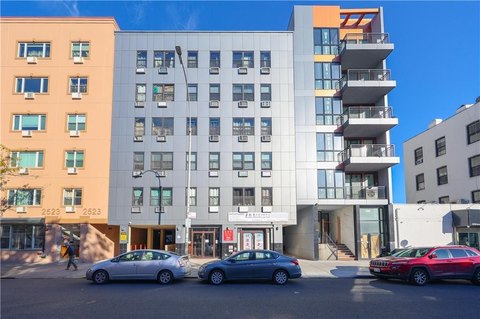
571 Ocean Parkway Brooklyn, NY 11218

New 100% Occupied 30 Unit Mixed-Use Building For Sale
Property size:
24,510 SFLot size:
0.56 AcresPrice / SF:
$611/SF- Added:
- May 8, 2025
- Days on Market:
- 360
- Last Refresh:
- Mar 16 at 9:06 am
Property Features for 571 Ocean Parkway
General Information
- Standard status
- Active
- Property type
- Multifamily properties, Other mixed-use properties, Residential income properties, Mixed-use properties
- Size
- 24,510 SF
- Total Parking Spaces
- 18
- Elevators
- N/A
- Lot size
- 0.56 Acres
Building Details
- Buildings
- 1
- Stories
- 8
Listing agent Richard License #10301216230 (516) 783-5600
Listing office All Island Estates Realty Corp (516) 783-5600
Listing date May 8, 2025
Overview
New Kensington Mixed-Use Building
This new, fully occupied 30-unit mixed-use building is located in the heart of Kensington, between Church Avenue and Foster Avenue, just minutes from Prospect Park Lake. Built in 2023, the property features excellent signage and exposure. The building includes one medical office and eighteen parking spaces. Interior features include high 10' ceilings, an elevator, motion sensor lights, sprinklers, all new LED lighting, 3-phase power, and central air conditioning. The property benefits from strong R7A zoning. The location is near UPS, Kia, The Home Depot, Target, Costco, NYU Langone, ShopRite, T.J. Maxx, Walgreens, CVS, Extra Space Storage, Staples, Planet Fitness, Blink Fitness, Taco Bell, McDonald's, Meineke Car Care, and Aldi. The property offers upside potential and could be a valuable addition to an investment portfolio or a new home for a business. The property generates a gross income of $1,017,419.04 annually, with a net operating income of $967,697.04 annually. Expenses include $21,823 annually for utilities, $5,113 annually for maintenance and repairs, $3,200 annually for management, $12,053 annually for insurance, and $7,533 annually for taxes. The property size is 24,510 square feet.
Property Profile
Insight Report
Location Intelligence
Current Use by Public Records
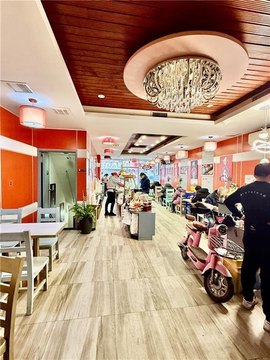
NY BEAUTY SKIN
Spa & Massage Center
Location Insight
- Map
- Local Demand
- City
- Brooklyn
- County
- Kings
- State
- New York
- Longitude
- -73.9664852
- Latitude
- 40.6016915
Nearby Similar for Sale
FAQs
What type of property is this?
Multifamily property - New 100% Occupied 30 Unit Mixed-Use Building For Sale
Where is this multifamily property located?
The property is located at 571 Ocean Parkway Brooklyn, NY.
What is the asking price?
The asking price for this property is $14,999,000.


