Short-Term Rental Near Lake
For Sale
$550,000
116 Fogarty Street, Michigan City, IN 46360
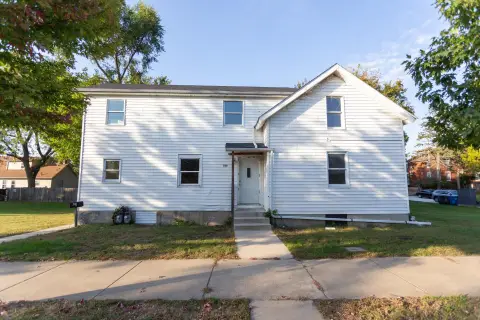
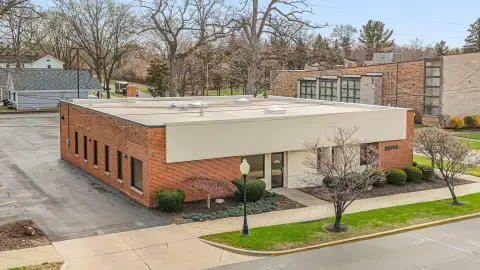
Rebuilt residential property with dedicated work areas, a chef’s kitchen, and furnished living spaces suited to flexible use.
Property Size2,244 SF
Price / SF$245.10
Days on Market197
Property Features for 116 Fogarty Street
General Information
Standard status
Active
Size
2,244 SF
Total Parking Spaces
2
Property subtype
Residential Income / Duplex
Zoning
Residential
Taxes and HOA fees
Annual Taxes
$5,126
Amenities
dedicated work spaces
chefs kitchen
quartz counters
breakfast bar
wine fridge
side by side refrigerator with ice and water dispenser
dishwasher
bluetooth light fixtures
master bath with jacuzzi tub and separate shower
Asphalt, Shingle
Central Air, Ceiling Fan(s)
Yes
4
Laminate, Tile, Other
Central, Natural Gas, Forced Air
Dryer, Washer, Refrigerator, Range, Microwave, Gas Water Heater, Gas Range, ENERGY STAR Qualified Appliances, Dishwasher
No
3
Other, Unfinished, Storage Space
Gas Dryer Hookup, Washer Hookup, Main Level, Laundry Room
Smoke Detector(s), Security System, Security Lights
10
Ceiling Fan(s), Walk-In Closet(s), Vaulted Ceiling(s), Soaking Tub, Recessed Lighting, Pantry, Other, Open Floorplan, Kitchen Island, His and Hers Closets, High Ceilings, Granite Counters, Eat-in Kitchen, Entrance Foyer
Two
Aluminum Frames, Insulated Windows, Blinds
Balcony, Storage, Rain Gutters, Private Yard, Lighting, Fire Pit
Front Porch, Patio
Building Details
Year Built
1909
Listing Agency:
Weichert Realtors, Merrion Gro
Listed By:
Marge Skwiat-Gloy
(219) 877-4206
Source:
Compass
Added: Apr 5
Changed: Oct 13
Last Checked: Oct 16 at 10:28AM
Displayed information is deemed reliable but is not guaranteed and should be independently verified. All listing content including descriptions, pricing, images are the copyrighted material of Weichert Realtors, Merrion Gro

Ask AI about this property
Review the available facts, identify missing information and prepare questions for the agent.
Investment Insights
Based on property information with market context.
Originally constructed in 1909 and rebuilt from a shell in 2020, this 2244 SF residential property combines updated finishes with flexible interior functionality. The home includes multiple dedicated work areas, an open kitchen with quartz counters, breakfast bar, wine refrigerator, side-by-side refrigerator, dishwasher, and gas range. Additional features include Bluetooth-enabled light fixtures, a primary bath with a soaking tub and separate shower, central air, laundry connections, security equipment, and outdoor areas including a balcony, front porch, patio, private yard, and fire pit.
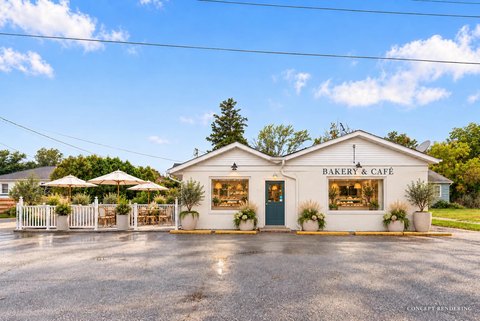
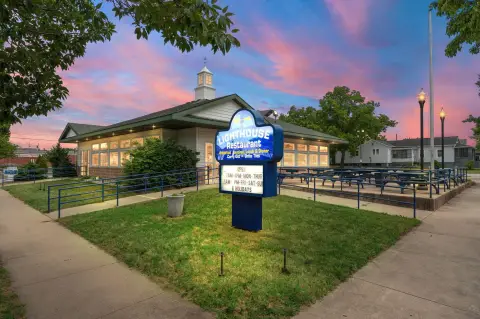
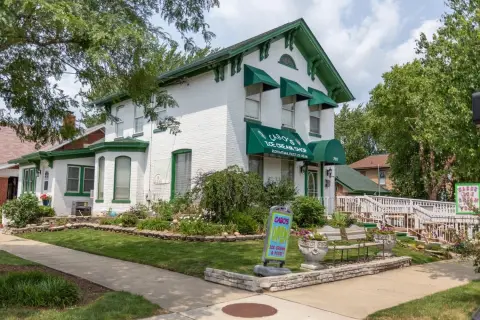
The property is located at 116 Fogarty Street in Michigan City, with a 3-block walk to Lake Michigan’s beach. Mt. Baldy, the Lubeznick Center, Blue Chip Casino, downtown businesses, and local restaurants are identified as nearby destinations. The property is currently operated as an established Airbnb, with business information available to qualified buyers.
The property is located at 116 Fogarty Street in Michigan City, with a 3-block walk to Lake Michigan’s beach. Mt. Baldy, the Lubeznick Center, Blue Chip Casino, downtown businesses, and local restaurants are identified as nearby destinations. The property is currently operated as an established Airbnb, with business information available to qualified buyers.
Key Highlights
- 2244 SF residential property at 116 Fogarty Street, Michigan City, IN 46360
- Rebuilt from a shell in 2020; original construction dates to 1909
- 3‑block walk to the beach at Lake Michigan
Financial Insights
Estimated NOI and Cap Rate
NOI / Yr
$20,701
Cap Rate
3.76%
Suggested Prices Based on Cap Rates
Cap Rate 5%
$414,020
$414.0K
Cap Rate 7%
$295,729
$295.7K
Cap Rate 9%
$230,011
$230.0K
Market Conditions
NOI Build-Up for 2,244 SF
Gross rent
$30.3K $13.50/SF
− Vacancy
−$721 −$0.32/SF
EGI
$29.6K $13.18/SF
− OpEx
−$8.9K −$3.95/SF
NOI
$20.7K $9.23/SF
Area
LaPorte County, IN
Vacancy
2.38%
Lease Rate
$13.50 /SF/Yr
Expense Ratio
30.00%
Simulate Cap Rate and NOI
Suggested Prices Based on Cap Rates
Cap Rate 5%
$414,020
Cap Rate 7%
$295,729
Cap Rate 9%
$230,011
Alternative Uses
Best Use
Multifamily LT 5
$295.7K
$258.8K – $345.0K
NOI $20,701 @ 7.0% cap · market cap 3.76%
Second Best
Apartment 5plus
$257.9K
$225.6K – $300.8K
NOI $18,050 @ 7.0% cap · market cap 3.28%
Theoretical Best
Specialty Retail
$623.8K
$545.9K – $727.8K
NOI $43,669 @ 7.0% cap · market cap 7.94%
Zoning and permitted uses should be independently verified with authorities.
How Realmo checks its estimates
Property Analytics
Unlock full access to Insights
Subscribe to Realmo Intelligence
Open Analytics
Current Use
Location Intelligence
Trade Area within ½ mile
395
Businesses Nearby
Explore this area
Business Placement
Demographics for 46360, IN
44,209
Population
21,652
Households
2
Avg Household Size
42
Median Age
23%
College-Educated
90%
High-School Grad
76.6 sq mi
ZIP Area
577
Density / Sq Mi
$59,641
Median Household Income
$36,738
Median Earnings
$924
Median Rent
$155,900
Median Home Value
Check the figures for this property
Cap Rate, Value Estimation, Potential NOI and more
View Realmo Analytics
Market
Vacancy Rate% for Multifamily in Midwest region





Frequently Asked Questions
What type of property is this?
Short term rental property - Rebuilt residential property with dedicated work areas, a chef’s kitchen, and furnished living spaces suited to flexible use.
Where is this short term rental property located?
The property is located at 116 Fogarty Street Michigan City, IN.
What is the asking price?
The asking price for this property is $550,000.
What are key features of this property?
This property features: 2244 SF residential property at 116 Fogarty Street, Michigan City, IN 46360; Rebuilt from a shell in 2020; original construction dates to 1909; 3‑block walk to the beach at Lake Michigan