Top-Floor Residential Income
For Sale
$859,000
11430 STRAND Unit 415, North Bethesda, MD 20852
Three-bedroom condominium with updated flooring, in-unit laundry, and two indoor garage spaces.
Property Size1,822 SF
Price / SF$471.46
Days on Market65
Property Features for 11430 STRAND Unit 415
General Information
Standard status
Active
Size
1,822 SF
Property subtype
Unit/Flat/Apartment
Taxes and HOA fees
Annual Taxes
$9,748
Building Details
Building Size
1,822 SF
Year Built
1980
Listing Agency:
Weichert, REALTORS
Listed By:
Jody Goren · License #501113
(301) 674-7737
Source:
Kerishull
Added: Aug 18
Changed: Oct 21
Last Checked: Oct 21 at 6:48AM
Displayed information is deemed reliable but is not guaranteed and should be independently verified. All listing content including descriptions, pricing, images are the copyrighted material of Weichert, REALTORS

Ask AI about this property
Review the available facts, identify missing information and prepare questions for the agent.
Investment Insights
Based on property information with market context.
This 1980-built condominium is a top-floor end unit with three bedrooms, 2.5 baths, and a layout that includes formal living and dining rooms. The kitchen offers table space and a butler’s pantry. Recent interior updates include fresh paint and wood-look flooring, while in-unit laundry and two indoor garage spaces add practical convenience.
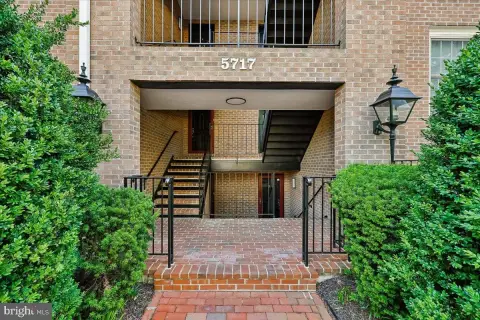
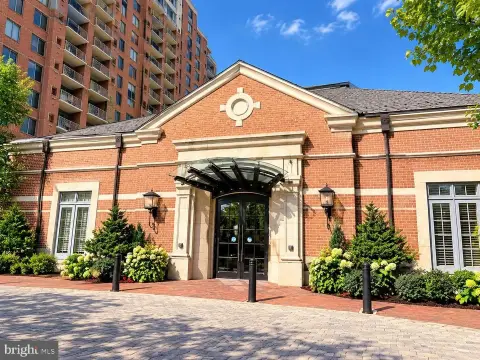
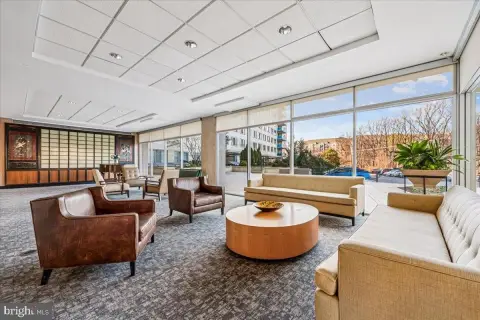
Old Georgetown Village Condominiums provides a range of shared amenities, including a pool, tennis and pickleball courts, fitness center, and community room. The community is situated in a wooded setting near Whole Foods, North Bethesda Metro, and Pike and Rose, with professional management on site.
Old Georgetown Village Condominiums provides a range of shared amenities, including a pool, tennis and pickleball courts, fitness center, and community room. The community is situated in a wooded setting near Whole Foods, North Bethesda Metro, and Pike and Rose, with professional management on site.
Key Highlights
- Top‑floor end‑unit condominium with three bedrooms and 2.5 baths
- Freshly painted interior with newly installed wood‑look flooring
- Table‑space kitchen with butler’s pantry
Financial Insights
Estimated NOI and Cap Rate
NOI / Yr
$30,083
Cap Rate
3.50%
Suggested Prices Based on Cap Rates
Cap Rate 5%
$601,660
$601.7K
Cap Rate 7%
$429,757
$429.8K
Cap Rate 9%
$334,256
$334.3K
Market Conditions
NOI Build-Up for 1,822 SF
Gross rent
$58.8K $32.28/SF
− Vacancy
−$4.1K −$2.26/SF
EGI
$54.7K $30.02/SF
− OpEx
−$24.6K −$13.51/SF
NOI
$30.1K $16.51/SF
Area
Montgomery County, MD
Vacancy
7.00%
Lease Rate
$32.28 /SF/Yr
Expense Ratio
45.00%
Simulate Cap Rate and NOI
Suggested Prices Based on Cap Rates
Cap Rate 5%
$601,660
Cap Rate 7%
$429,757
Cap Rate 9%
$334,256
Alternative Uses
Best Use
Apartment 5plus
$429.8K
$376.0K – $501.4K
NOI $30,083 @ 7.0% cap · market cap 3.50%
Second Best
—
—
no second resolved use
Theoretical Best
Specialty Retail
$640.9K
$560.8K – $747.8K
NOI $44,866 @ 7.0% cap · market cap 5.22%
Zoning and permitted uses should be independently verified with authorities.
How Realmo checks its estimates
Location Intelligence
Trade Area within ½ mile
3,625
Businesses Nearby
Explore this area
Business Placement
Demographics for 20852, MD
48,347
Population
23,023
Households
2.1
Avg Household Size
38
Median Age
74%
College-Educated
94%
High-School Grad
8.1 sq mi
ZIP Area
5,969
Density / Sq Mi
$121,496
Median Household Income
$74,519
Median Earnings
$2,212
Median Rent
$646,100
Median Home Value


Frequently Asked Questions
What type of property is this?
Residential income property - Three-bedroom condominium with updated flooring, in-unit laundry, and two indoor garage spaces.
Where is this residential income property located?
The property is located at 11430 STRAND Unit 415 North Bethesda, MD.
What is the asking price?
The asking price for this property is $859,000.
What are key features of this property?
This property features: Top‑floor end‑unit condominium with three bedrooms and 2.5 baths; Freshly painted interior with newly installed wood‑look flooring; Table‑space kitchen with butler’s pantry


