Four-Unit Townhome
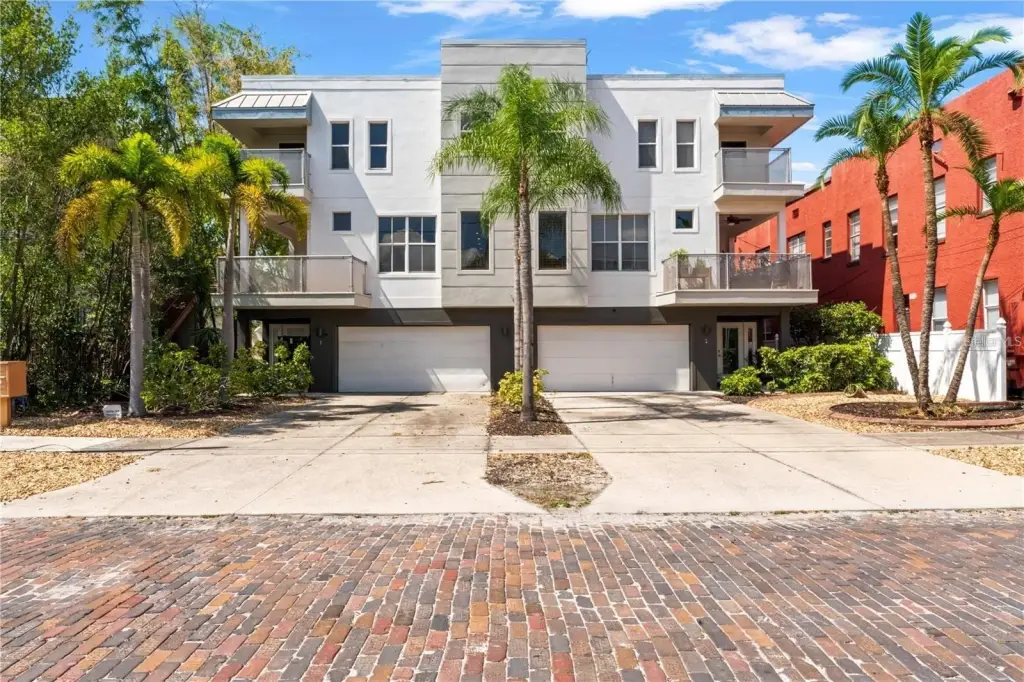
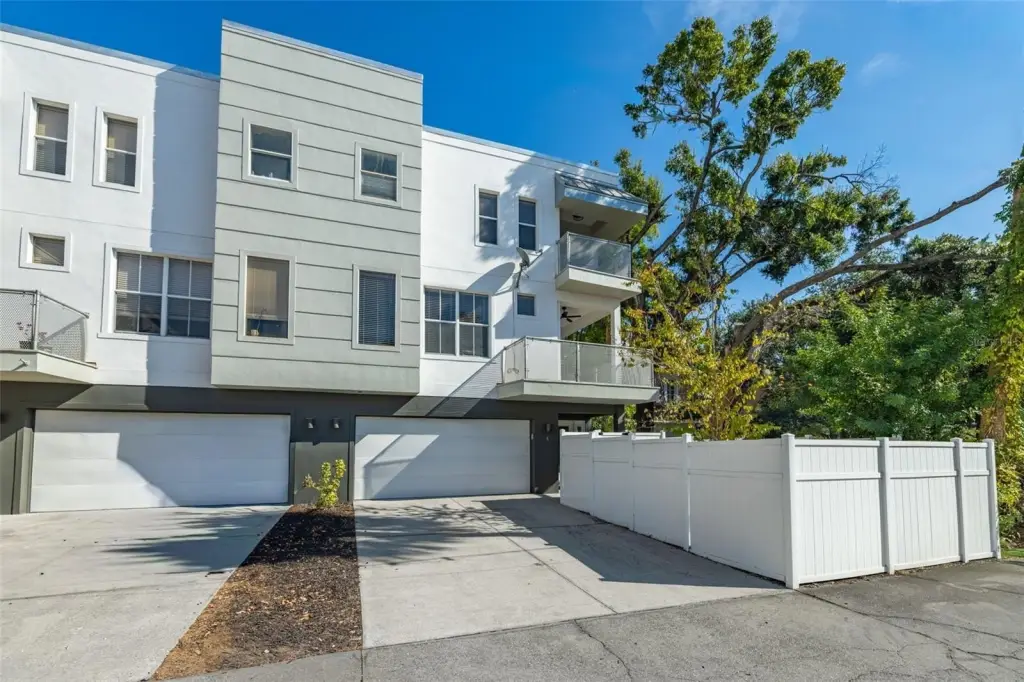
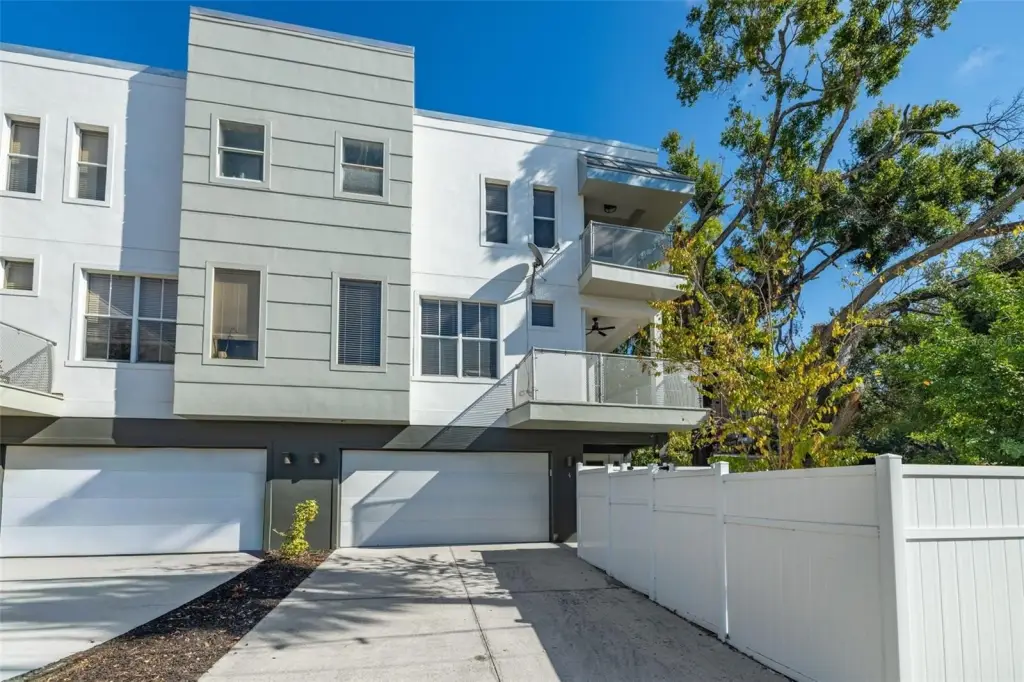
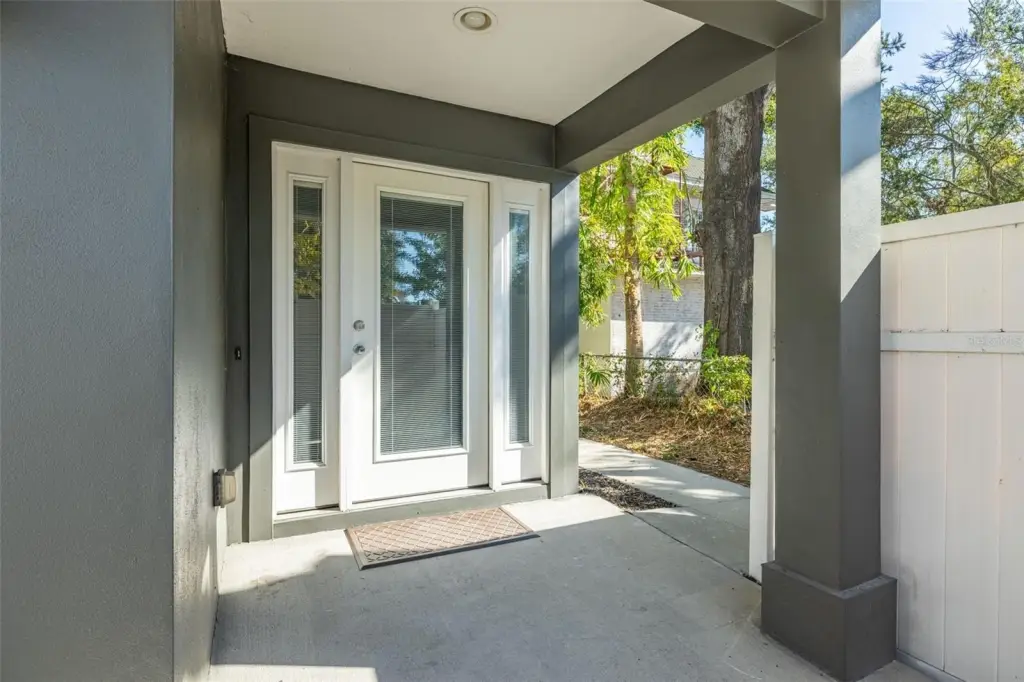
For Sale
Under Contract
$2,399,900
113 S NEWPORT Avenue, Tampa, FL 33606
Residential Income, TAMPA, FL
Property Size7,260 SF
Lot Size0.21 Acres
Price / SF$330.56
Days on Market342
Property Features for 113 S NEWPORT Avenue
General Information
Property type
Residential Multi Family
Property subtype
Quadruplex
Zoning
RM-24
Bedrooms
12
Bathrooms
16
Full bathrooms
16
Rooms
Bathroom 4, Bedroom 6, Bathroom 1, Bedroom 7, Bathroom 2, Bathroom 12, Bedroom 10, Bathroom 15, Bathroom 3, Bathroom 11, Bedroom 11, Bathroom 7, Bathroom 16, Bedroom 5, Bathroom 5, Bathroom 14, Bedroom 9, Bedroom 3, Family Room, Bedroom 4, Bathroom 9, Bathroom 6, Bedroom 2, Bedroom 1, Bathroom 8, Bathroom 10, Bathroom 13, Bedroom 8, Bedroom 12
Parking features
Driveway
Patio and Porch features
Deck, Porch
Interior features
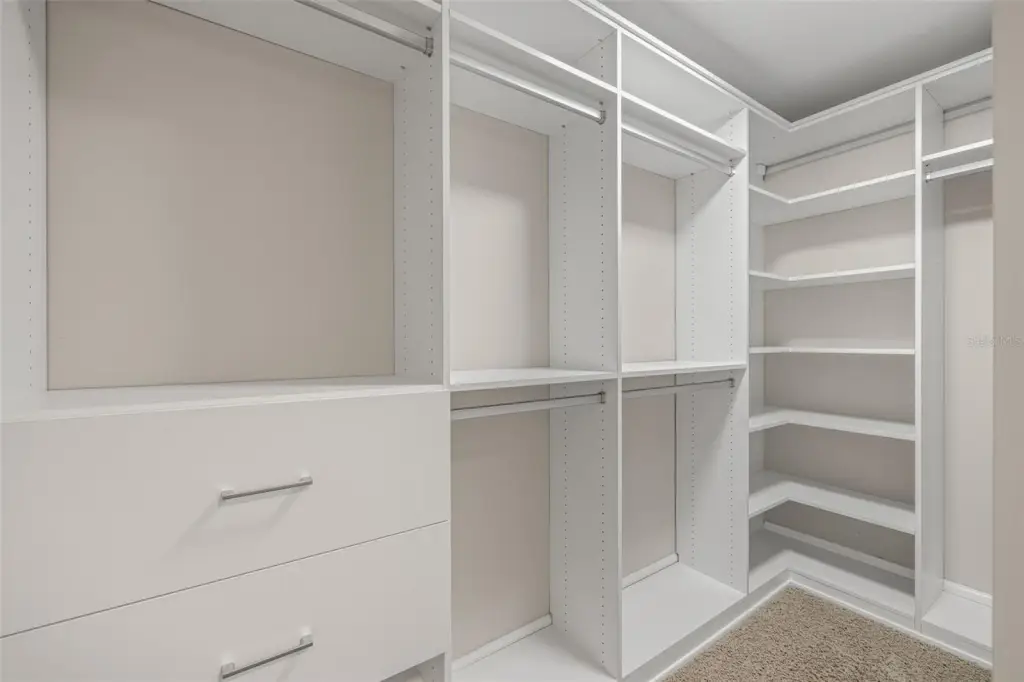
Ceiling Fans(s), Eat-in Kitchen, Kitchen/Family Room Combo, Walk-In Closet(s)
Exterior features
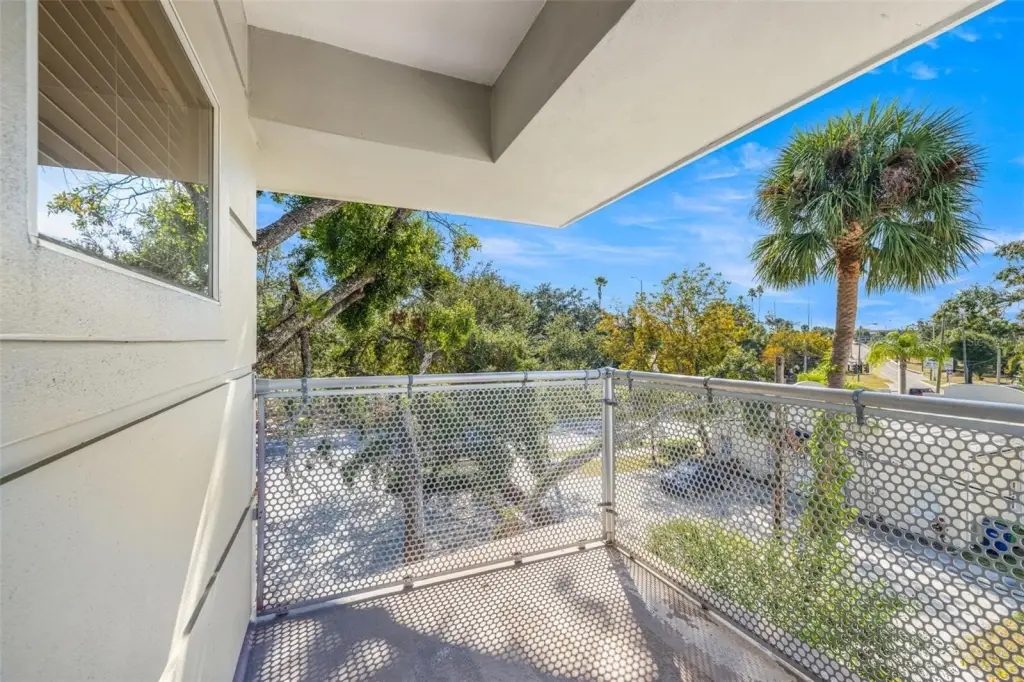
Balcony, Sidewalk
Subdivision
NEWPORT PALMS TWNHMS
Directions
Head north on S Bayshore Blvd, toward the Hyde Park area. Continue west until you reach S Howard Ave. Turn left (south) onto S Howard Ave. Continue a short distance, then turn right onto W Swann Ave. Follow W Swann Ave to S Newport Ave and turn left onto S Newport Ave. Destination will be on your right at 113 S Newport Ave
Standard status
Active Under Contract
APN
A-23-29-18-9FN-000000-00001.0
Size
7,260 SF
Lot size
0.21 Acres
Taxes and HOA fees
Tax Year
2025
Tax Description
NEWPORT PALMS TOWNHOMES LOT 1, 2, 3, 4
Tax Annual Amount
38800
Legal Description
NEWPORT PALMS TOWNHOMES LOT 1, 2, 3, 4
Utilities
Utilities
Cable Available
Sewer type
Public Sewer
Heating system
Central
Cooling system
Central Air
Water source
Public
Amenities
balcony
in-unit laundry
Building Details
Year built
2008
Number of units
4
Building materials
Block, Frame
Roof type
Membrane
Listing Agency:
KELLER WILLIAMS TAMPA CENTRAL · Keller Williams Realty
(813) 865-0700
Listed By:
Kamilla Altunyan
(813) 365-8765
Added: Nov 13, 2025
Changed: Oct 16
Last Checked: Oct 21 at 3:06AM
MLS# TB8447675
Copyright © 2026 Stellar MLS. All rights reserved. All information provided by the listing agent/broker is deemed reliable but is not guaranteed and should be independently verified.

Ask AI about this property
Review the available facts, identify missing information and prepare questions for the agent.
Investment Insights
Based on property information with market context.
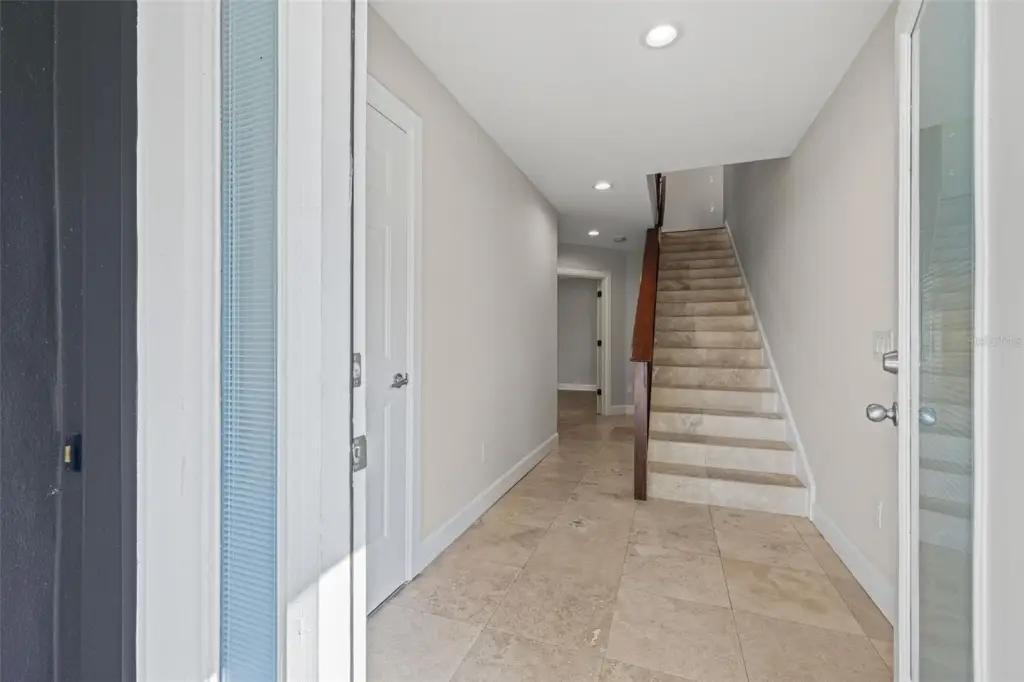
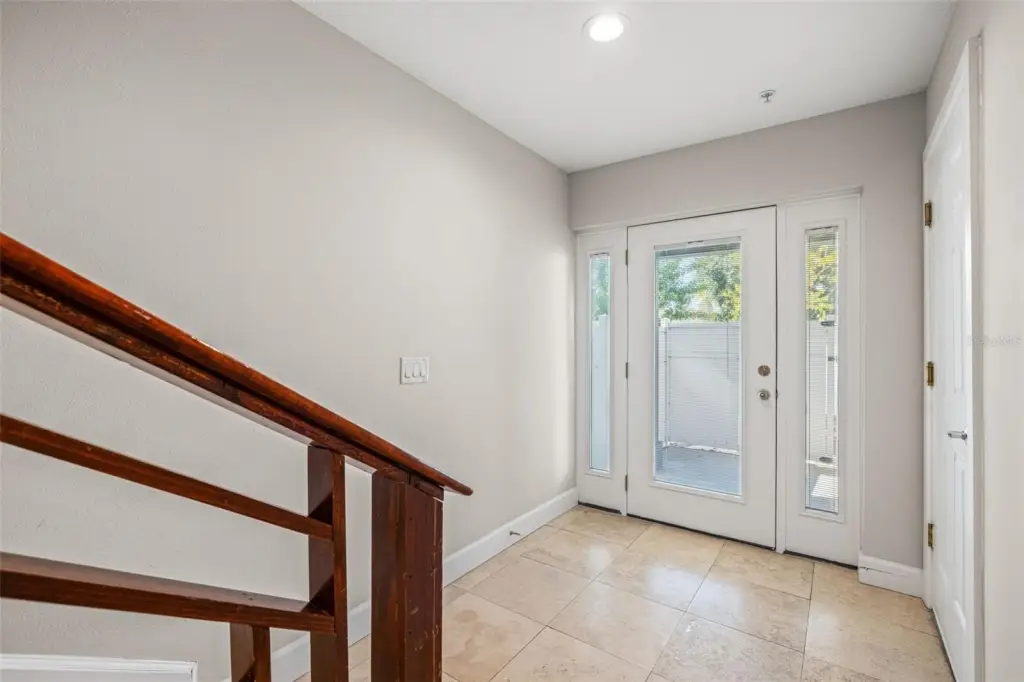
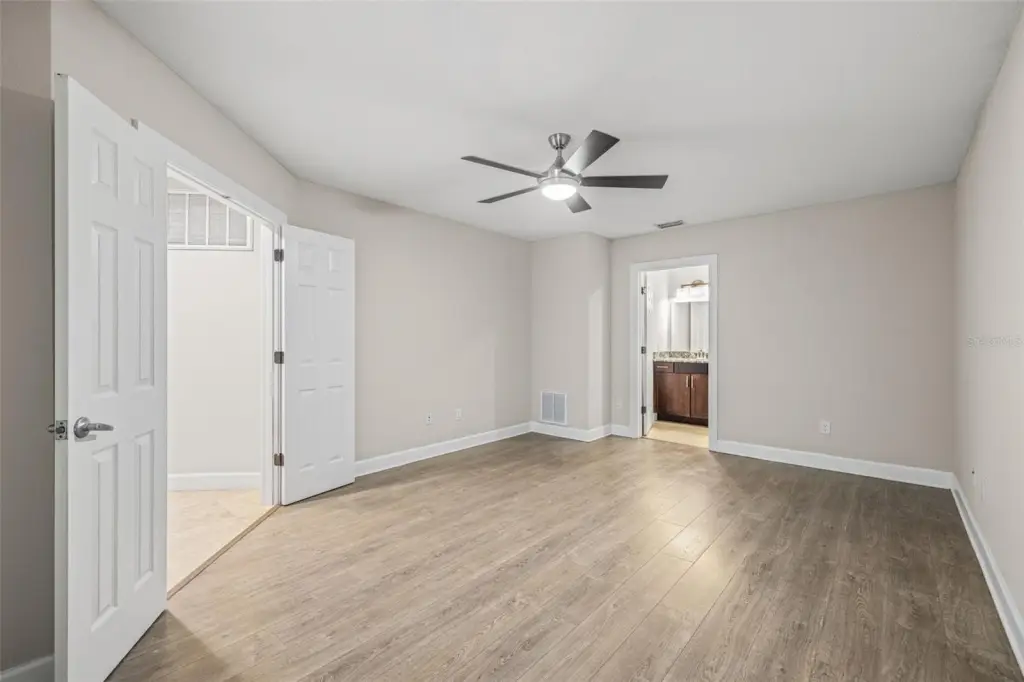
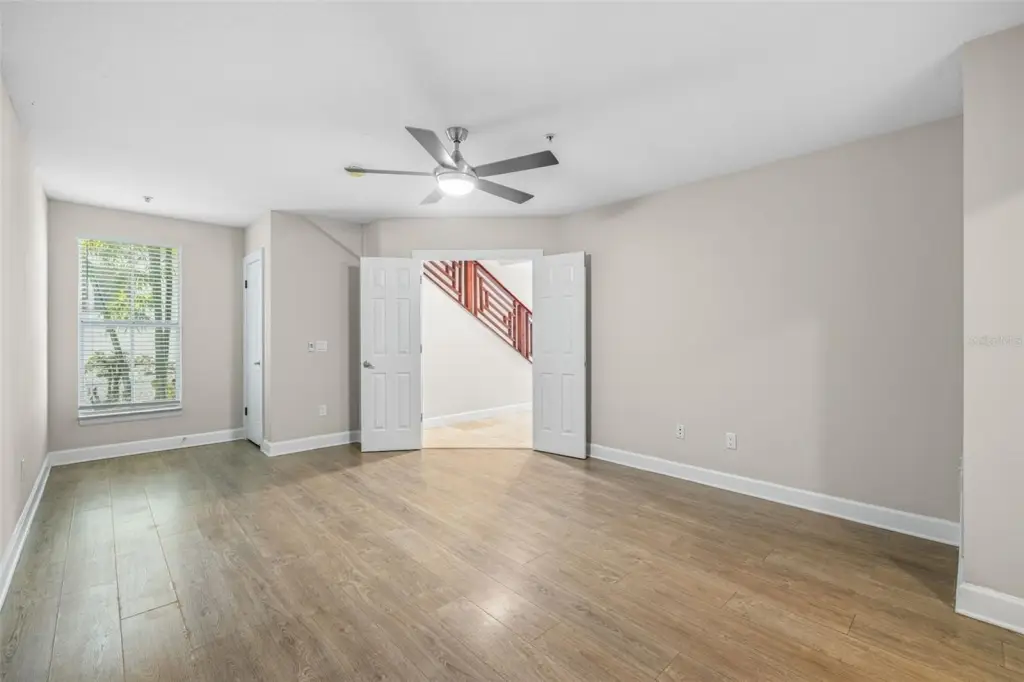
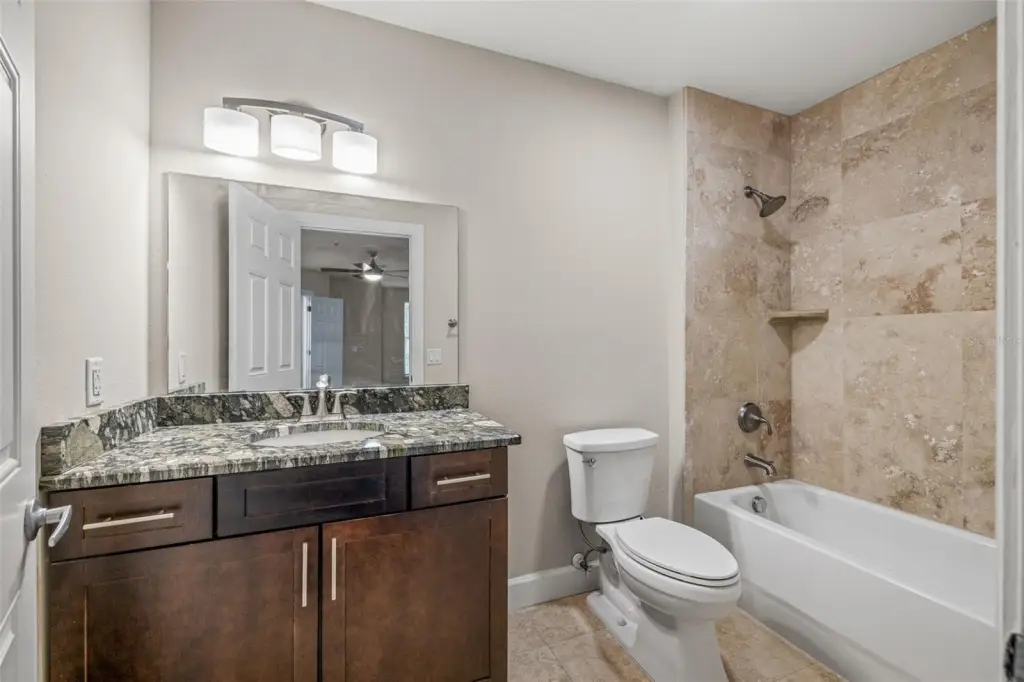
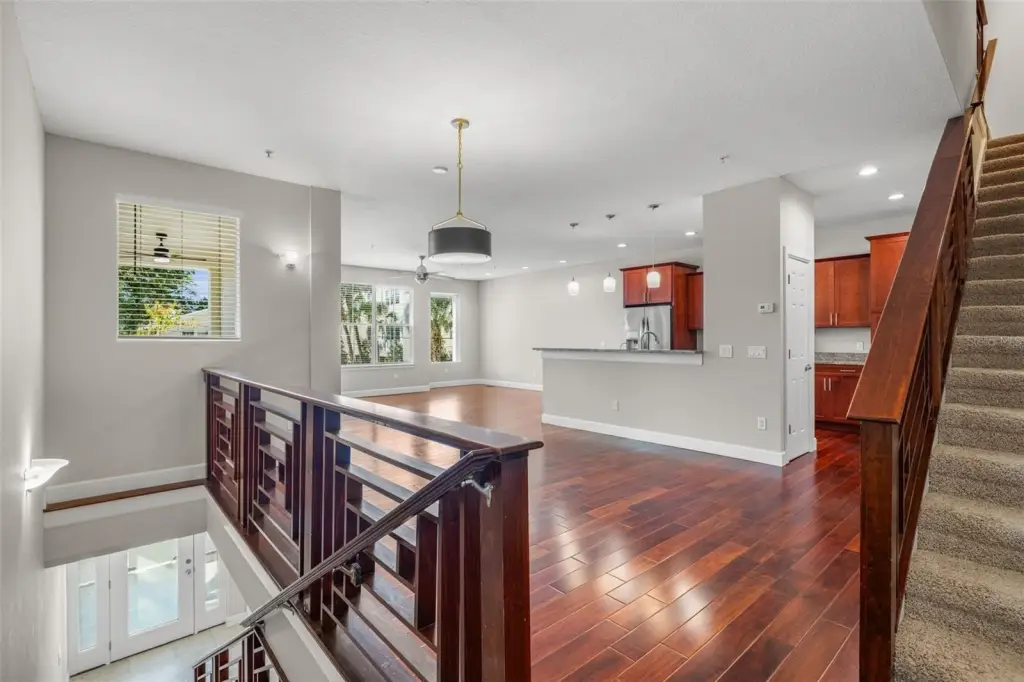
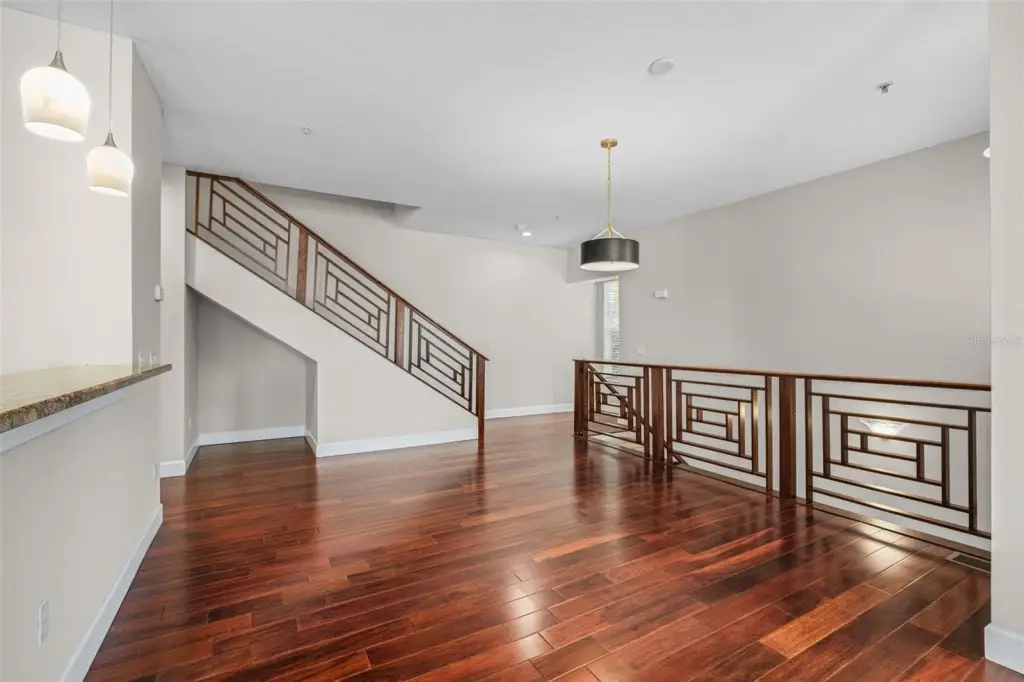
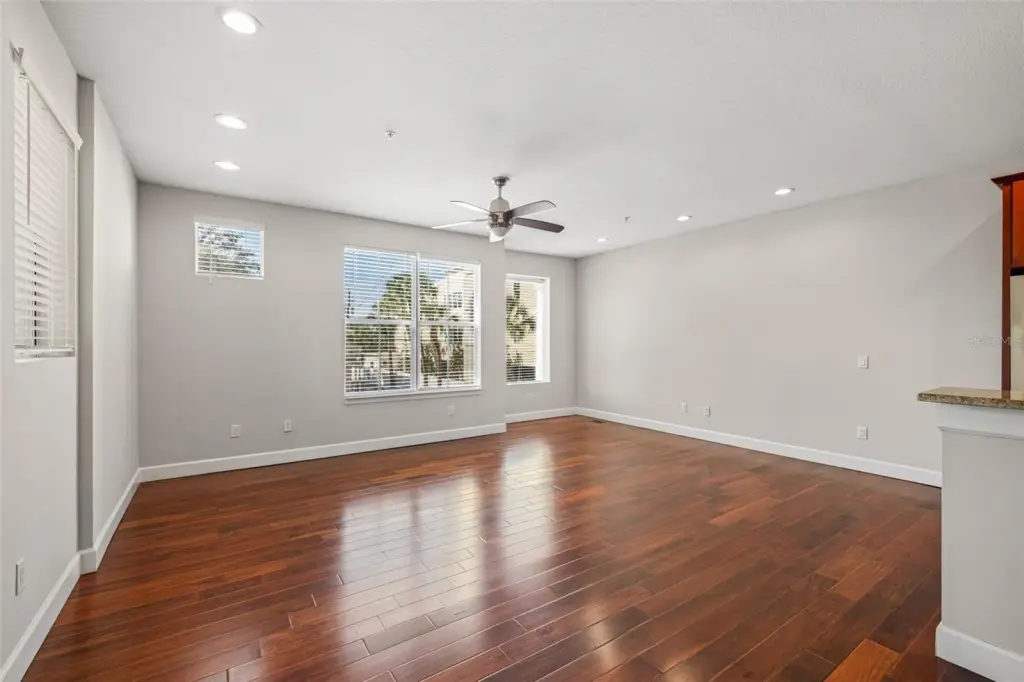
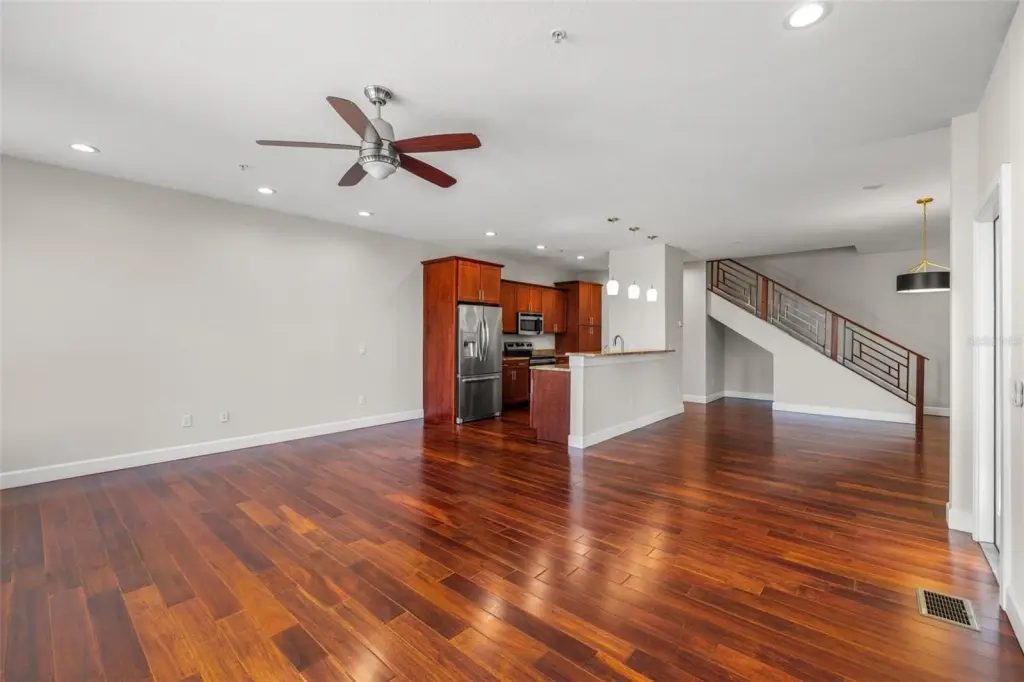
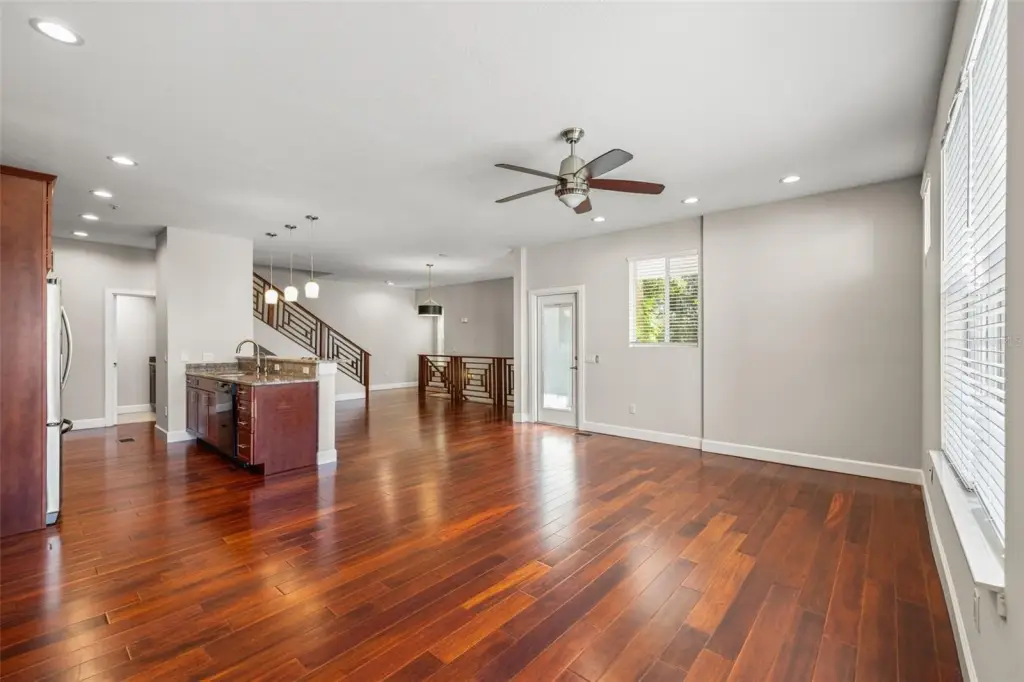
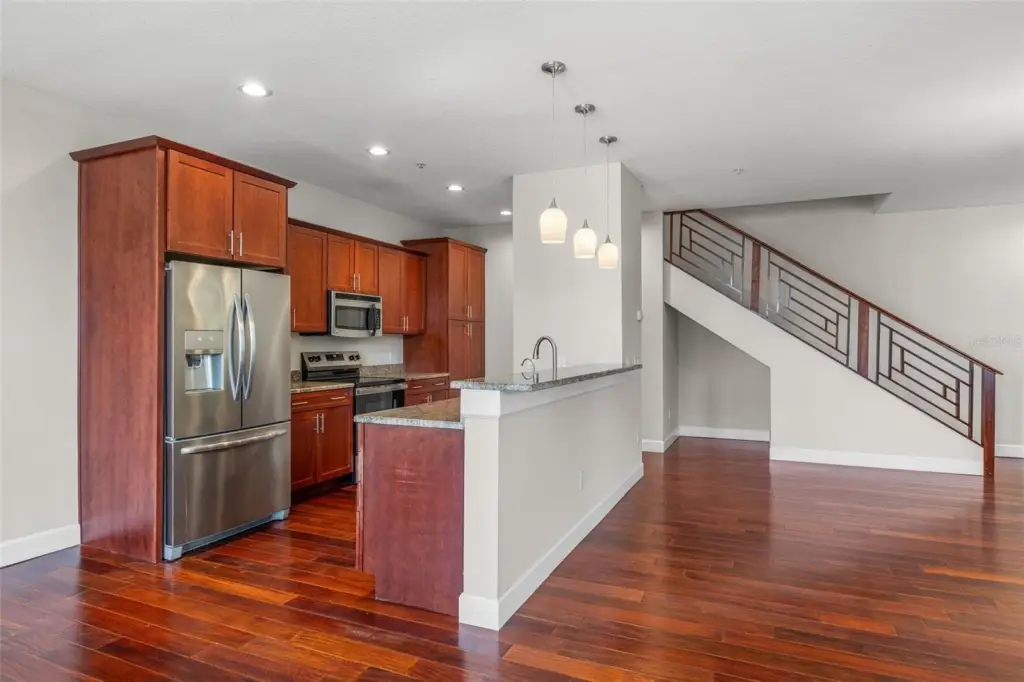
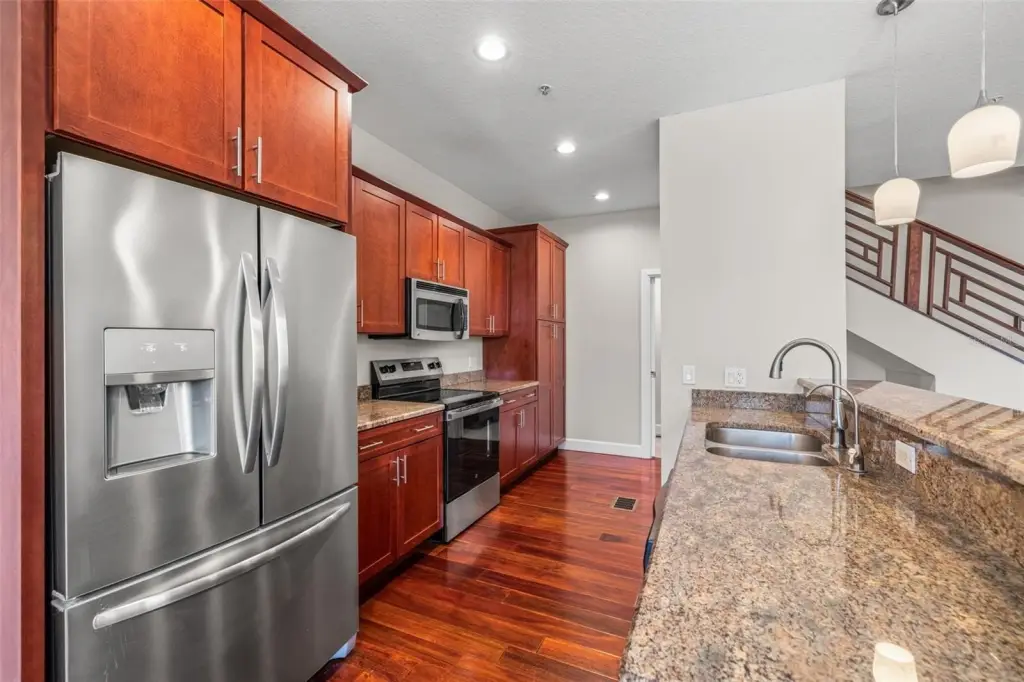
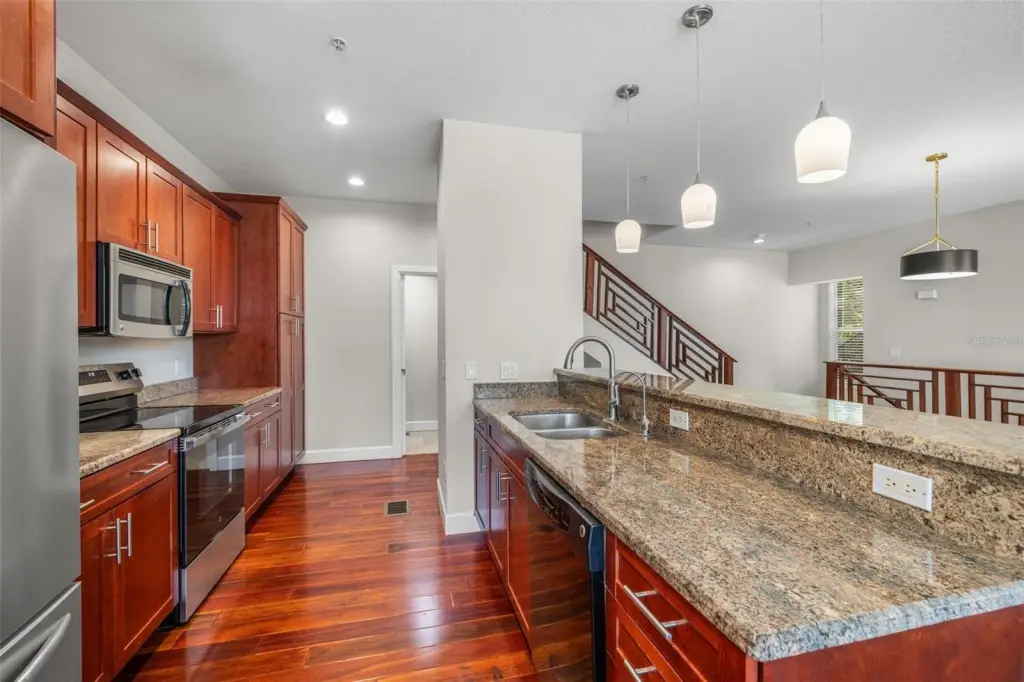
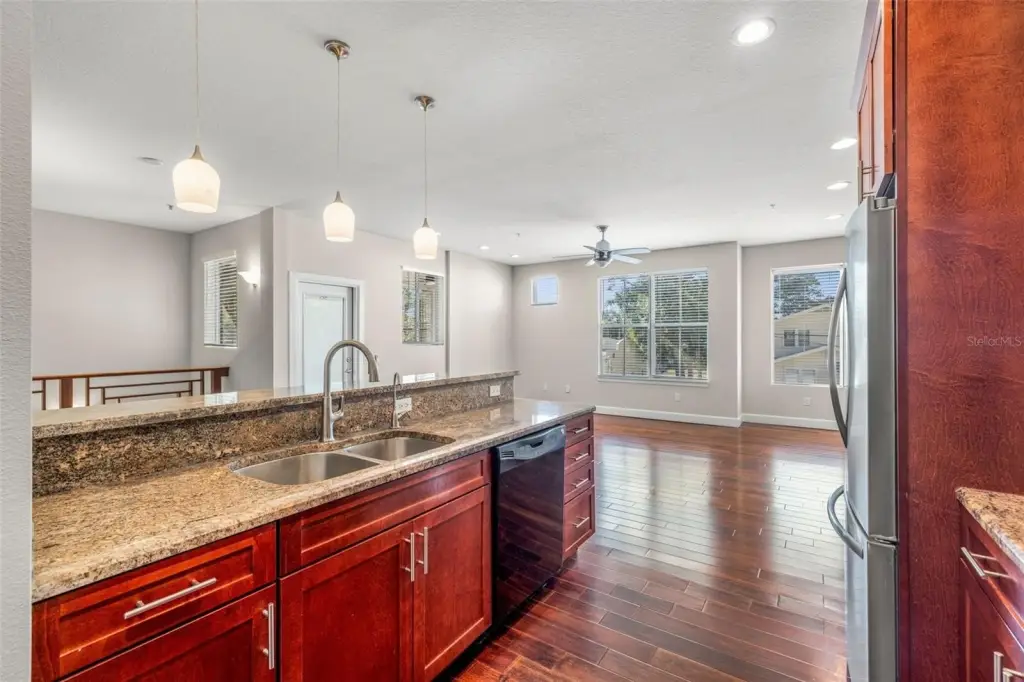
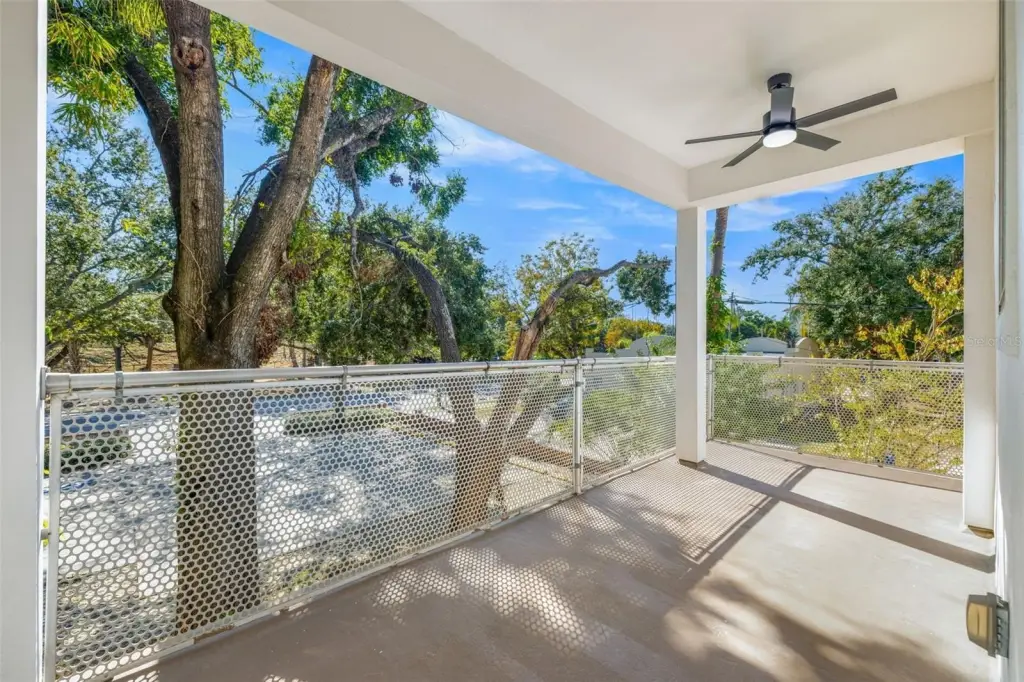
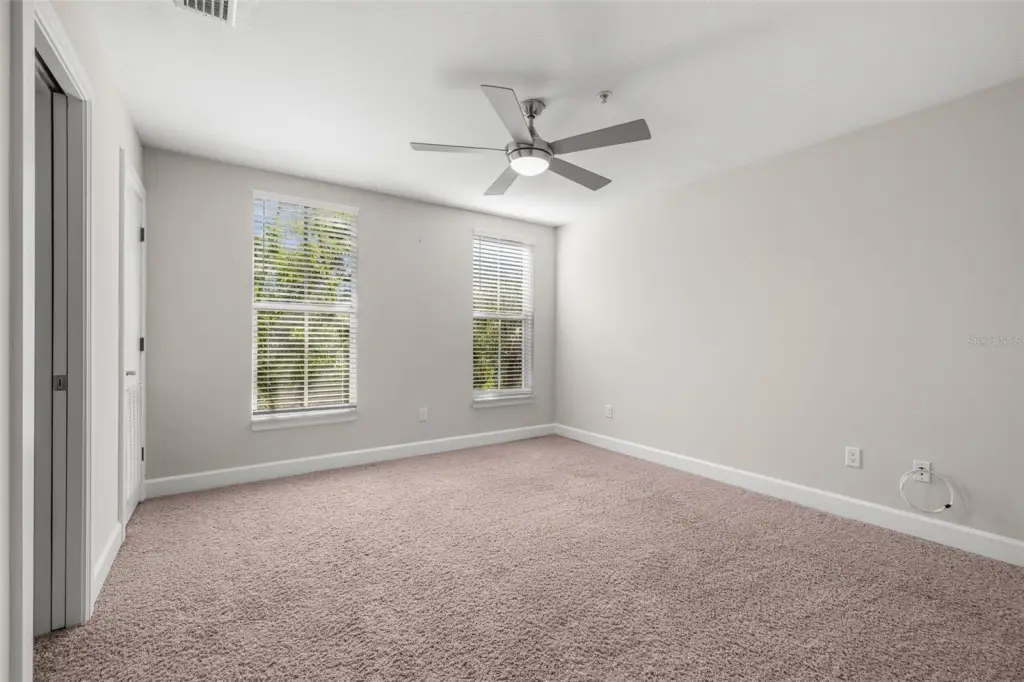
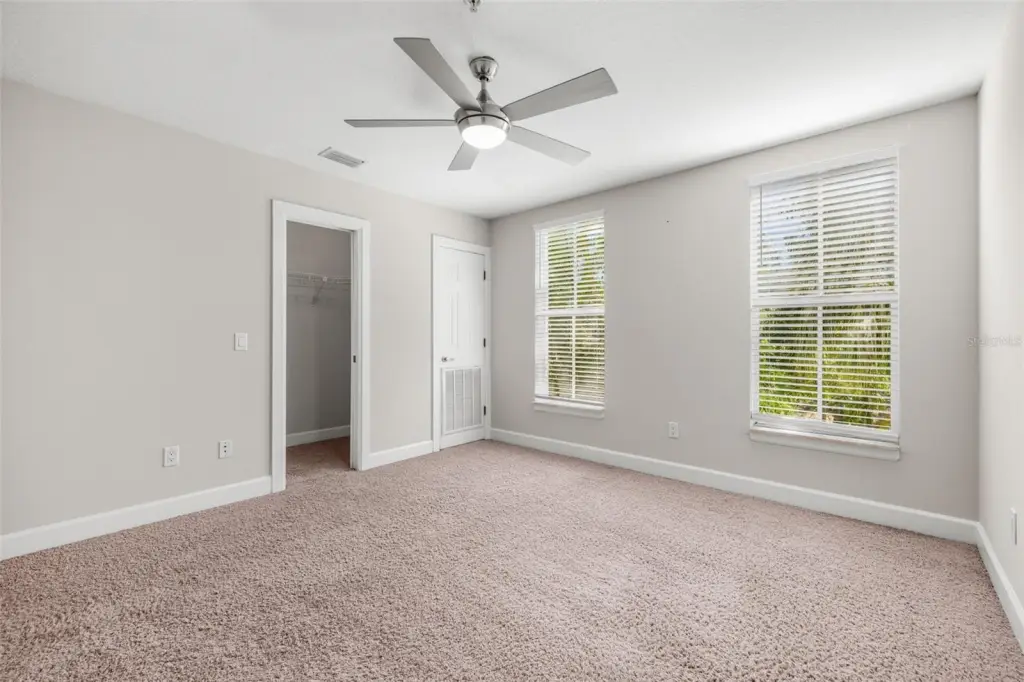
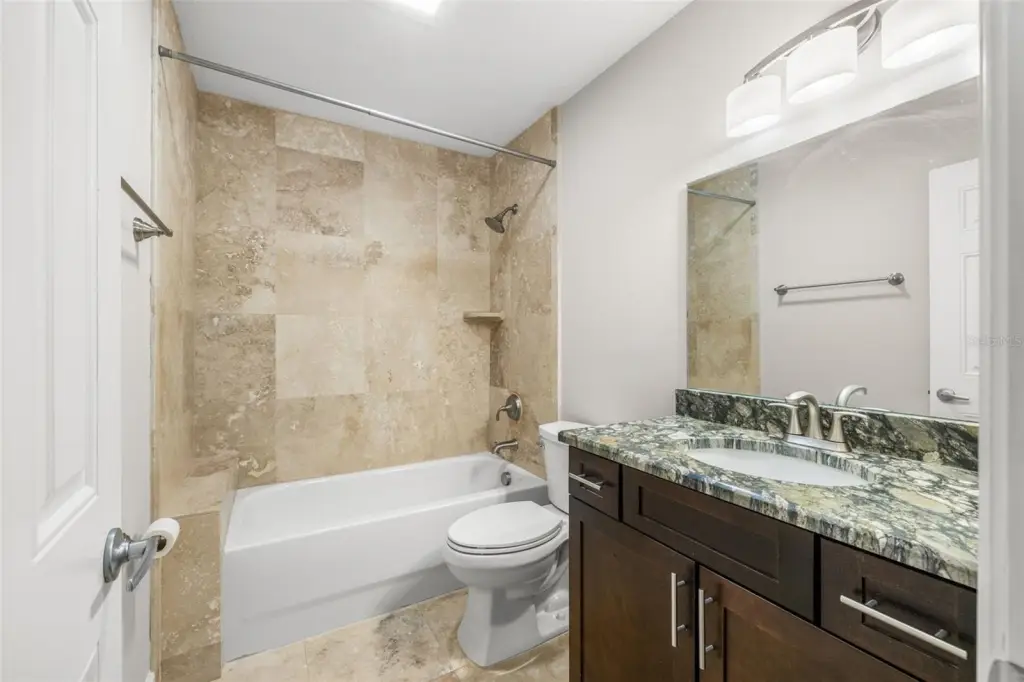
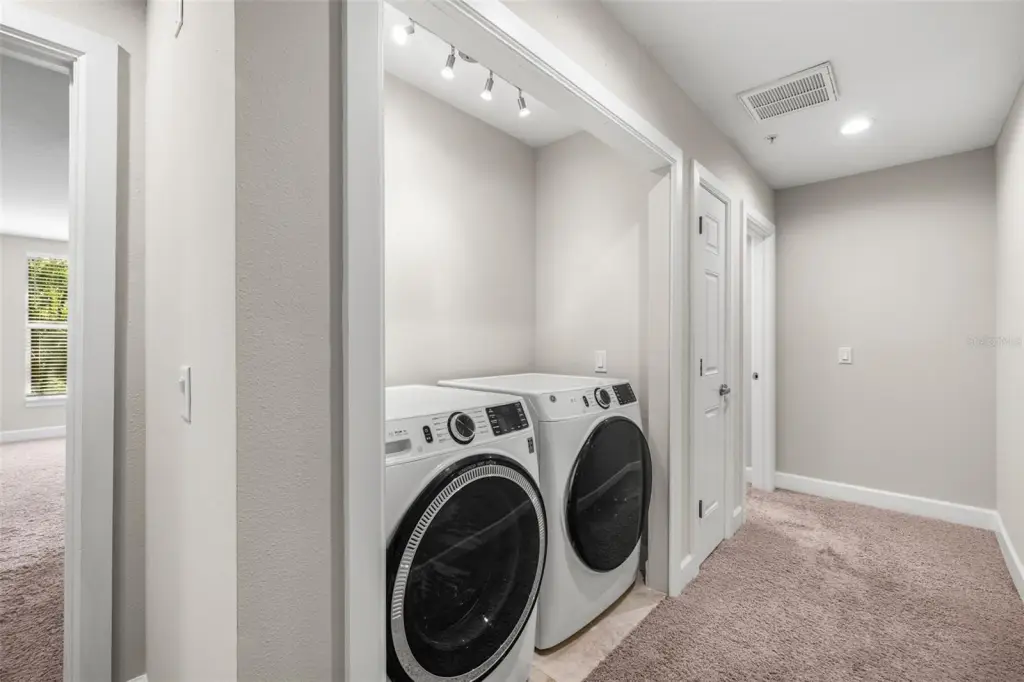
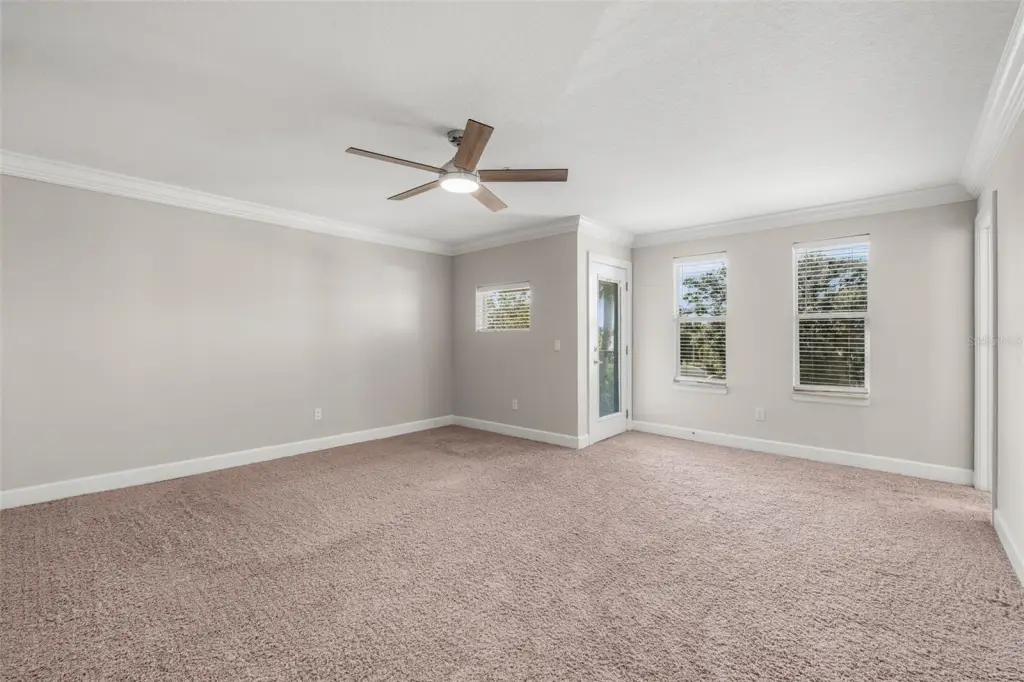
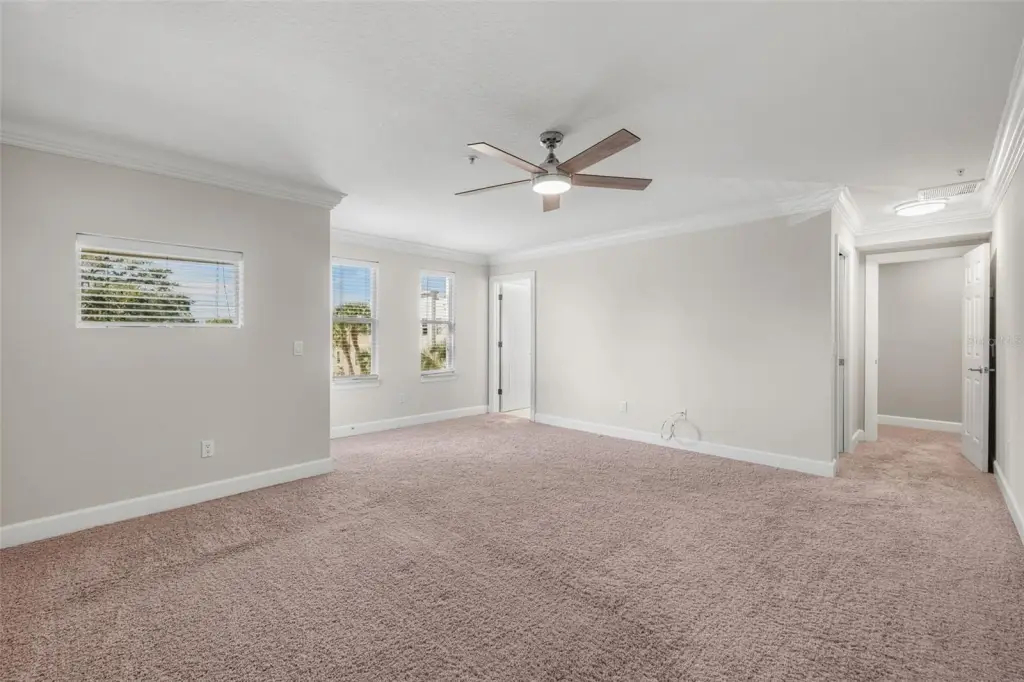
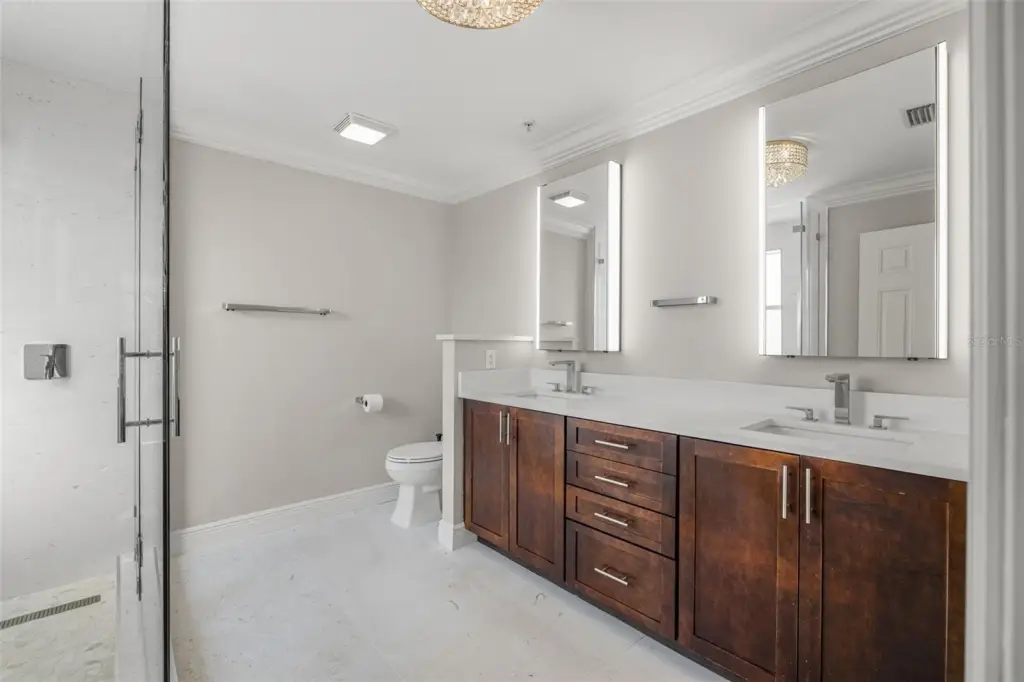
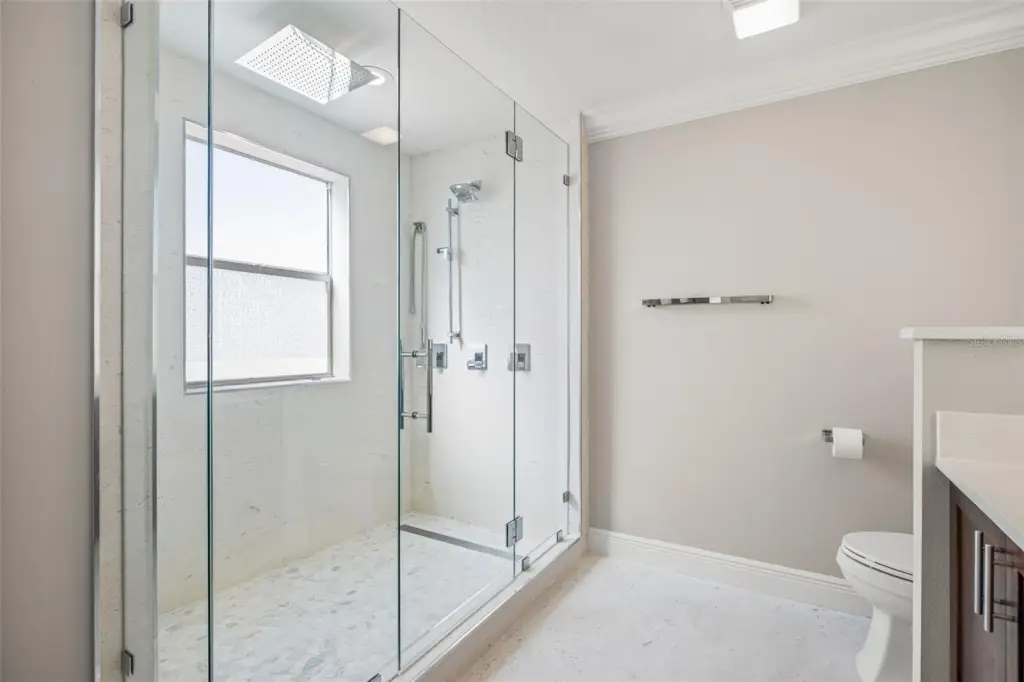
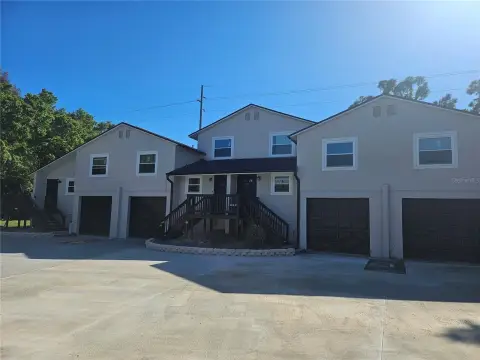
This quadplex comprises four separately parceled townhomes conveyed together. Each residence includes 3 bedrooms, 3.5 baths, 1,815 square feet of living space, and 2,550 square feet of total area across three levels. Interior features include a first-floor bedroom with an en-suite bath, open kitchen and family-room areas, stainless steel appliances, granite countertops, cherry cabinetry, breakfast-bar seating, upper-level laundry, and balconies on the second and third floors. Each unit also has an attached two-car garage. The property was built in 2008 and has a 2026 roof backed by a 5-year workmanship warranty.
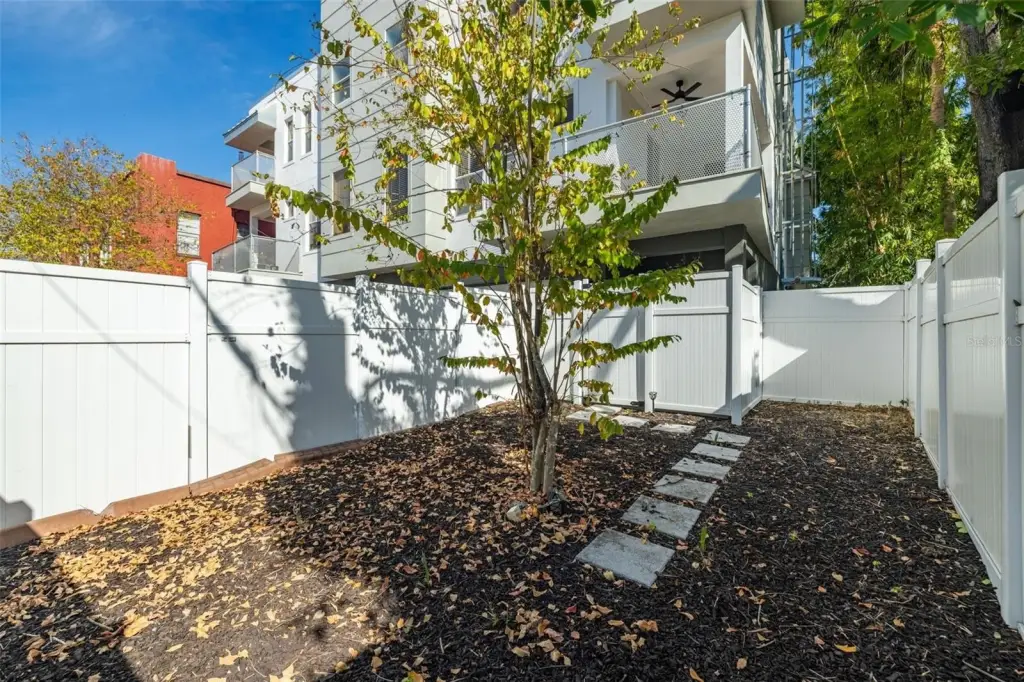
Located on S Newport Avenue in Tampa's Hyde Park, the property is within walking distance of the University of Tampa and minutes from downtown Tampa, Armature Works, Tampa Riverwalk, and Amalie Arena. The assemblage totals 7,260 square feet on 0.21 acres and is zoned RM-24.
Located on S Newport Avenue in Tampa's Hyde Park, the property is within walking distance of the University of Tampa and minutes from downtown Tampa, Armature Works, Tampa Riverwalk, and Amalie Arena. The assemblage totals 7,260 square feet on 0.21 acres and is zoned RM-24.
Key Highlights
- Four separate townhome units, each with its own parcel ID, sold together as one four‑unit property
- Each unit offers 3 beds, 3.5 baths, 1,815 sqft of living space, and 2,550 sqft total area
- 2026 roof installation with a 5‑year workmanship warranty
Financial Insights
Estimated NOI and Cap Rate
NOI / Yr
$84,742
Cap Rate
3.53%
Suggested Prices Based on Cap Rates
Cap Rate 5%
$1,694,840
$1.7M
Cap Rate 7%
$1,210,600
$1.2M
Cap Rate 9%
$941,578
$941.6K
Market Conditions
NOI Build-Up for 7,260 SF
Gross rent
$129.8K $17.88/SF
− Vacancy
−$8.7K −$1.21/SF
EGI
$121.1K $16.67/SF
− OpEx
−$36.3K −$5.00/SF
NOI
$84.7K $11.67/SF
Area
Tampa, FL
Vacancy
6.74%
Lease Rate
$17.88 /SF/Yr
Expense Ratio
30.00%
Simulate Cap Rate and NOI
Suggested Prices Based on Cap Rates
Cap Rate 5%
$1,694,840
Cap Rate 7%
$1,210,600
Cap Rate 9%
$941,578
Alternative Uses
Best Use
Multifamily LT 5
$1.21M
$1.06M – $1.41M
NOI $84,742 @ 7.0% cap · market cap 3.53%
Second Best
Apartment 5plus
$1.13M
$984.9K – $1.31M
NOI $78,790 @ 7.0% cap · market cap 3.28%
Theoretical Best
Office A
$1.69M
$1.48M – $1.97M
NOI $118,396 @ 7.0% cap · market cap 4.93%
Zoning and permitted uses should be independently verified with authorities.
How Realmo checks its estimates
Property Analytics
Unlock full access to Insights
Subscribe to Realmo Intelligence
Open Analytics
Lease Details
4
Residential units
Location Intelligence
Trade Area within ½ mile
3,887
Businesses Nearby
Explore this area
Business Placement
Demographics for 33606, FL
22,271
Population
10,918
Households
2
Avg Household Size
30
Median Age
77%
College-Educated
98%
High-School Grad
3.3 sq mi
ZIP Area
6,749
Density / Sq Mi
$113,634
Median Household Income
$46,311
Median Earnings
$1,931
Median Rent
$796,000
Median Home Value
Check the figures for this property
Cap Rate, Value Estimation, Potential NOI and more
View Realmo Analytics
Market
Vacancy Rate% for Multifamily in South region




Frequently Asked Questions
What type of property is this?
Quadplex - Four separately parceled townhomes feature private garages, balconies, multilevel layouts, and RM-24 zoning in Hyde Park.
Where is this quadplex located?
The property is located at 113 S NEWPORT Avenue Tampa, FL.
What is the asking price?
The asking price for this property is $2,399,900.
What are key features of this property?
This property features: Four separate townhome units, each with its own parcel ID, sold together as one four‑unit property; Each unit offers 3 beds, 3.5 baths, 1,815 sqft of living space, and 2,550 sqft total area; 2026 roof installation with a 5‑year workmanship warranty


