Craftsman Two-Family
113 Beckwith Street Cranston, RI 02910
113 Beckwith Street, Cranston, RI, 02910
$669,000
For Sale
$669,000
MULTI_FAMILY - Cranston, RI
Property Size3,054 SF
Lot Size0.18 Acres
Price / SF$219.06
Days on Market9
Property Features for 113 Beckwith Street
General Information
- Property type
- Residential Multi Family
- Property subtype
- Other
- Zoning
- 1040
- Bedrooms
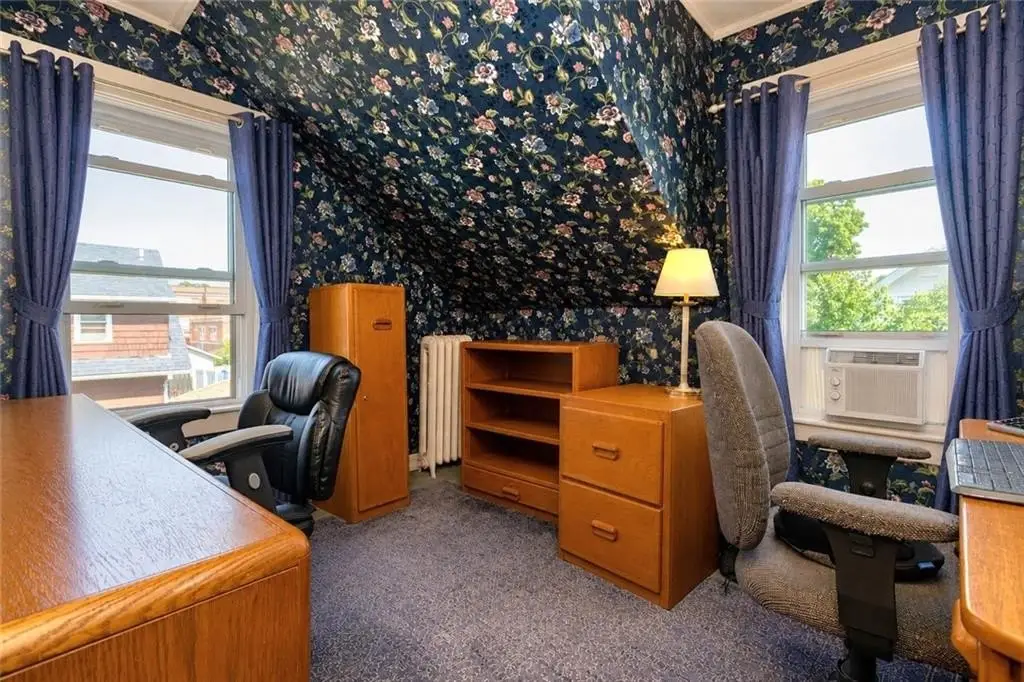
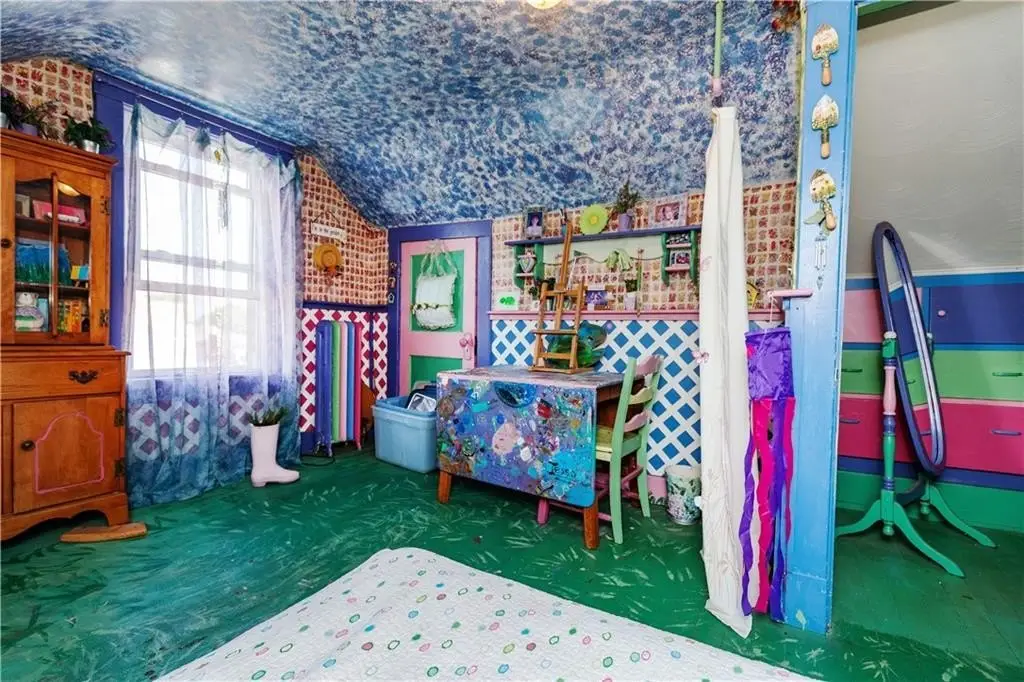
- 8
- Bathrooms
- 3
- Rooms
- Bedroom 2, Bathroom 1, Basement, Bedroom 3, Bedroom 6, Bedroom 4, Bedroom 5, Bedroom 7, Bedroom 8, Bathroom 2, Bathroom 3, Bedroom 1
- Parking
- 10
- Window features
- Storm Window(s), Skylight(s)
- Patio and Porch features
- Deck, Patio
- Interior features
- Wall (Dry Wall), Wall (Plaster), Attic, Attic Stairs, Attic Storage, Stairs, Plumbing (Mixed), Insulation (Cap), Insulation (Ceiling), Insulation (Floors), Insulation (Walls)
- Exterior features
- Deck, Screened Pch/Patio/Dck/Brzwy
- Fireplace
- 1
- Basement
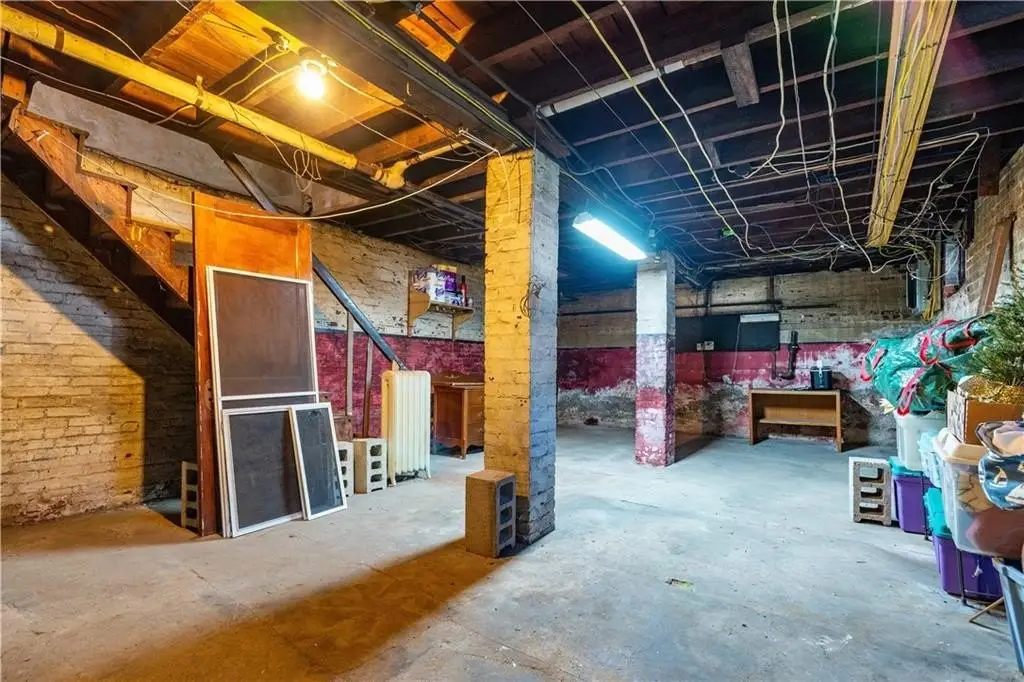
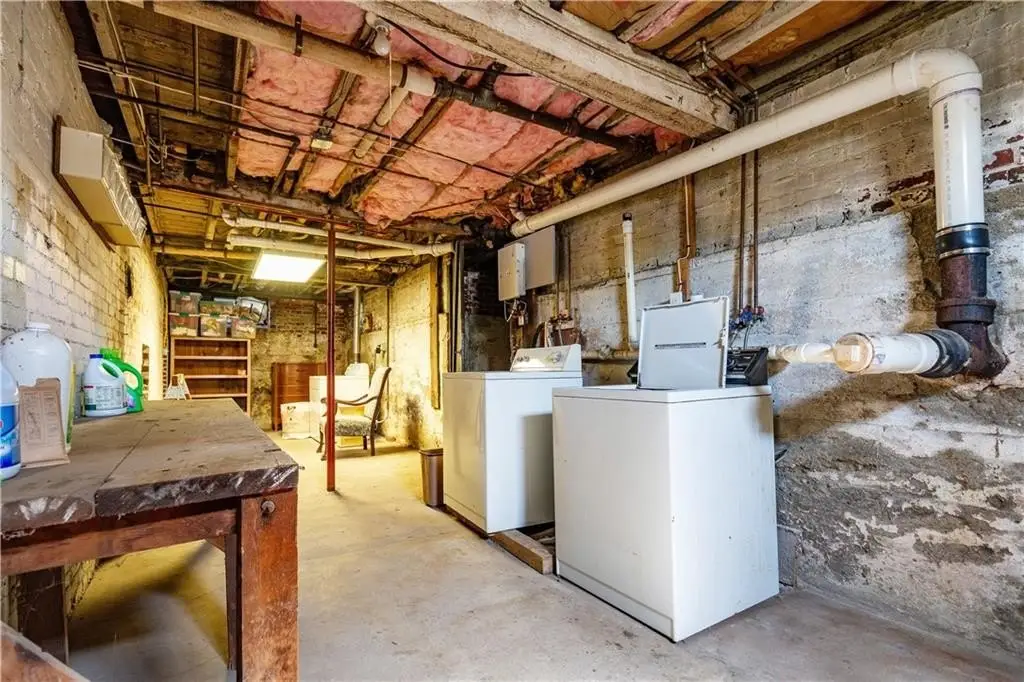
- Full, Unfinished, Storage Space
- Appliances
- Gas Water Heater, Dishwasher, Dryer, Exhaust Fan, Disposal, Range Hood, Microwave, Oven/Range, Refrigerator, Washer
- Standard status
- Active
- Size
- 3,054 SF
- Lot size
- 0.18 Acres
Taxes and HOA fees
- Tax Year
- 2026
- Tax Annual Amount
- 6412
Utilities
- Heating system
- Natural Gas, Radiant
- Cooling system
- Window Unit(s), Whole House Fan
- Water source
- Public
Building Details
- Year built
- 1920
- Floors in Building
- 3
- Number of units
- 2
- Flooring type
- Tile - Ceramic, Carpet, Hardwood, Laminate
- Building materials
- Dry Wall, Plaster, Brick, Vinyl Siding
- Additional Structures
- Storage
Listing agency
Bhhs Commonwealth Real Estate
(401) 849-1800
Listed by
Michele Sisson
(508) 810-0700
Added: Jul 15 Updated: Jul 23 at 1:28AM Checked: Jul 23 at 5:06AM
MLS# 1417960
Copyright © 2026 State Wide MLS of Rhode Island, Inc. All rights reserved. All information provided by the listing agent/broker is deemed reliable but is not guaranteed and should be independently verified.
Investment Insights
Based on property information with market context.
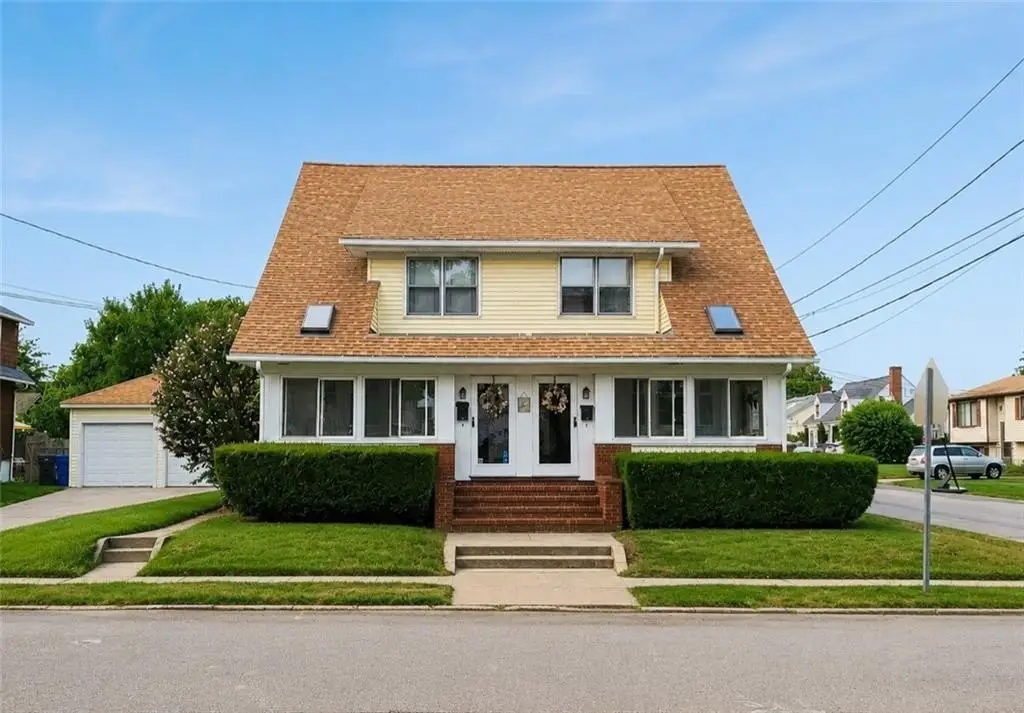
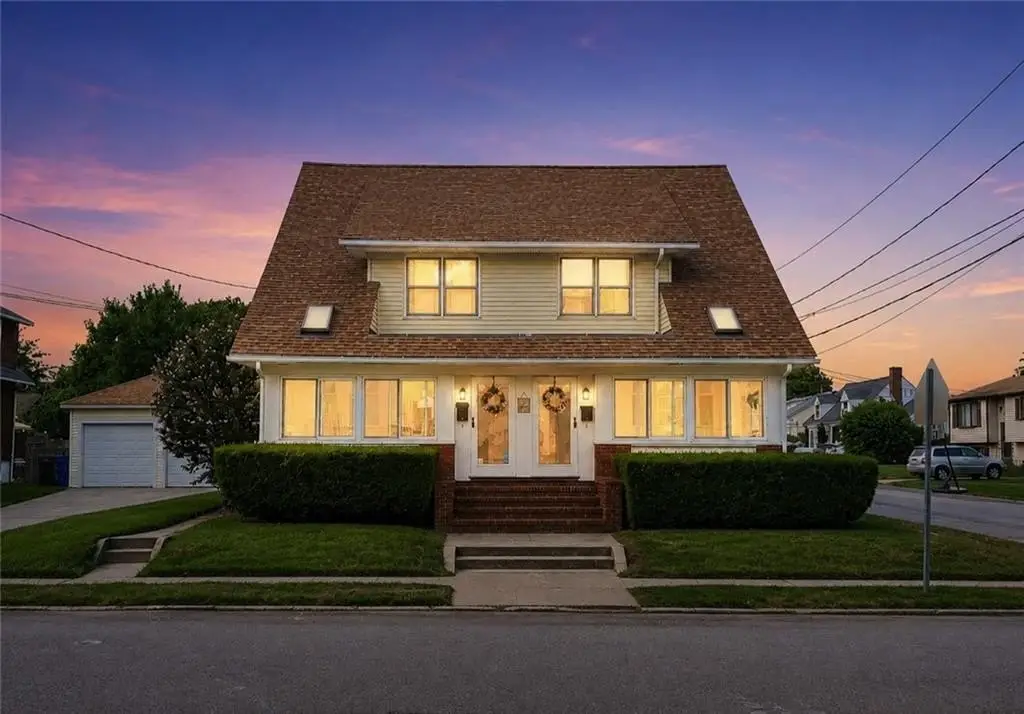
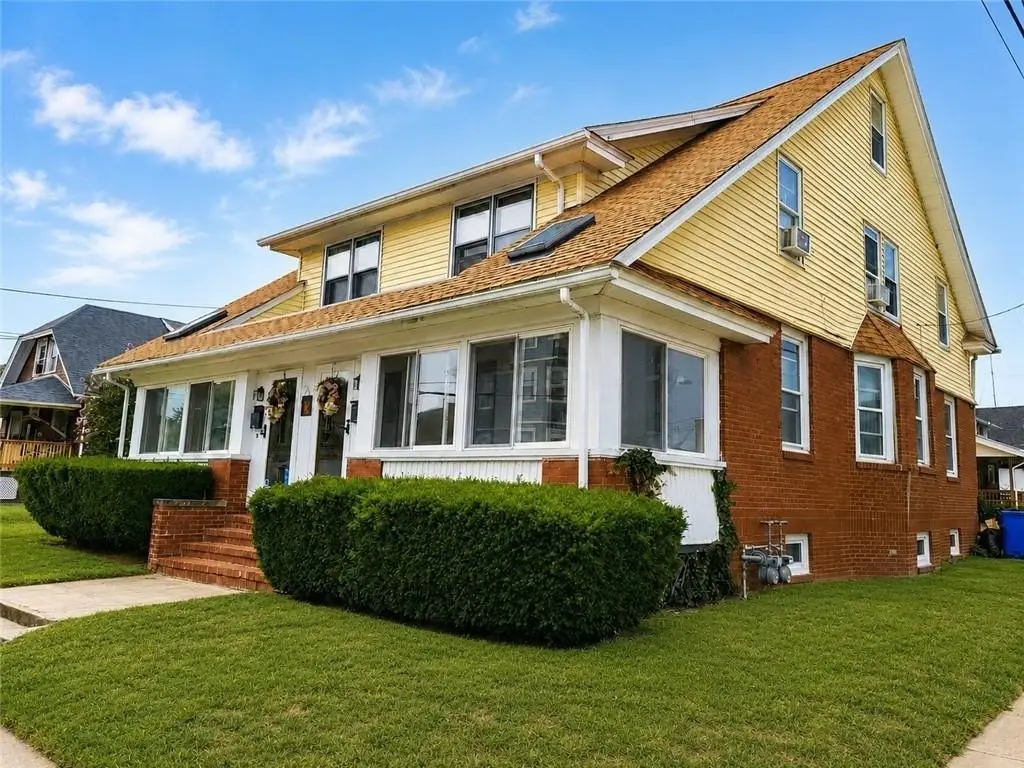
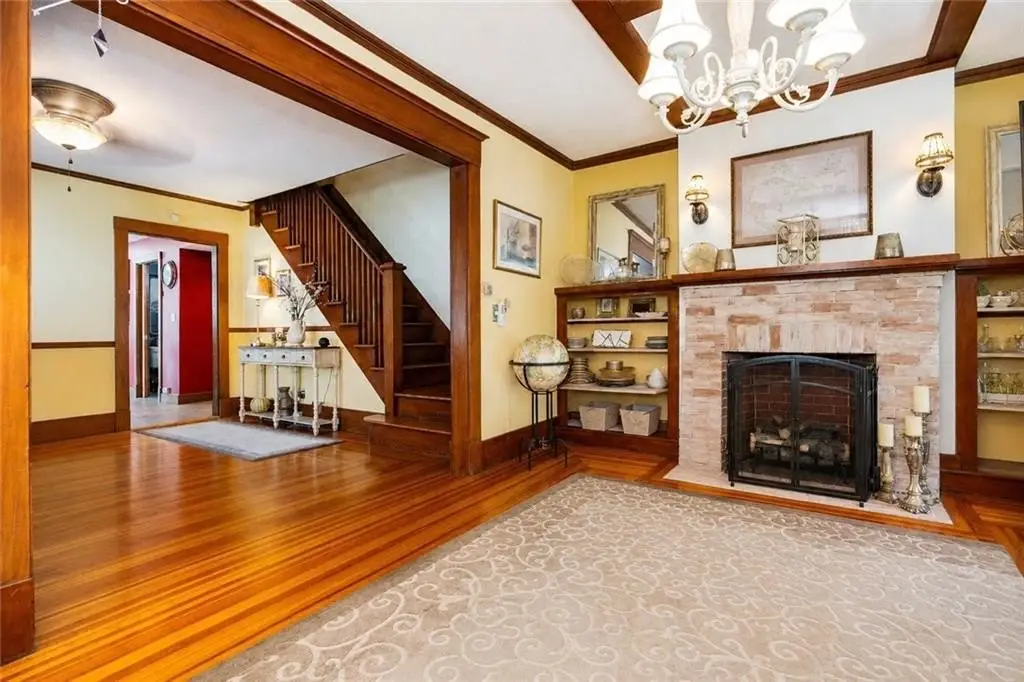
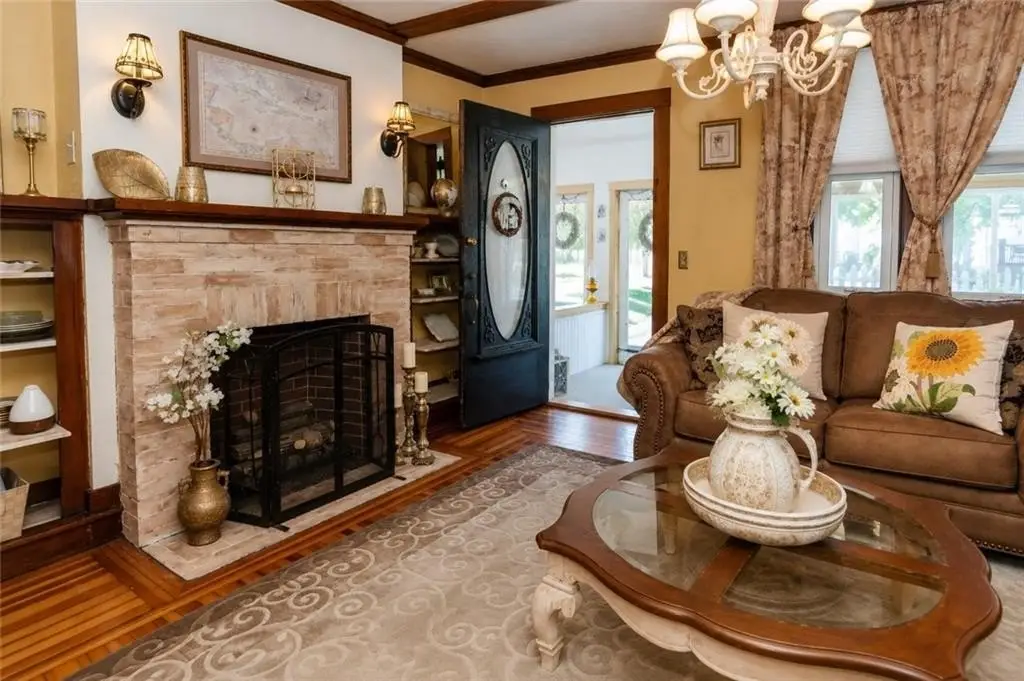
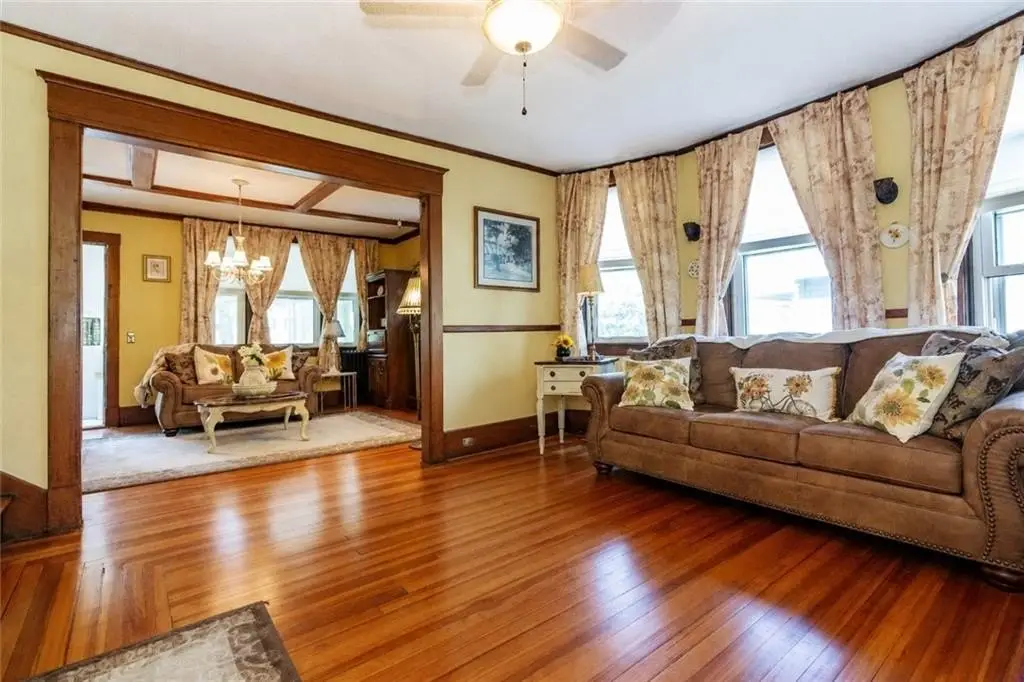
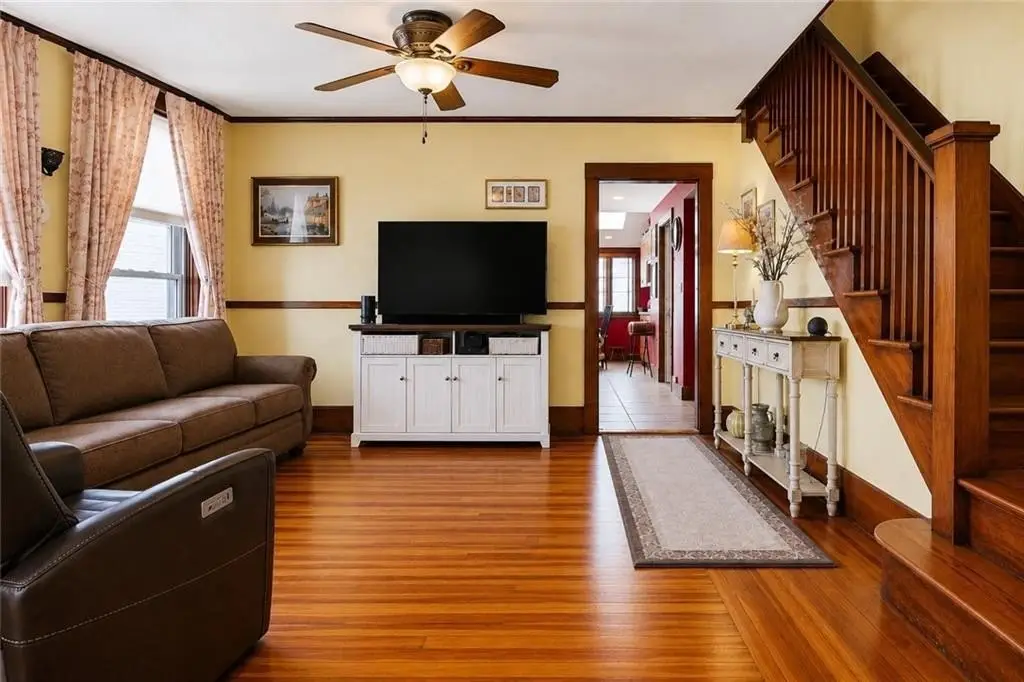
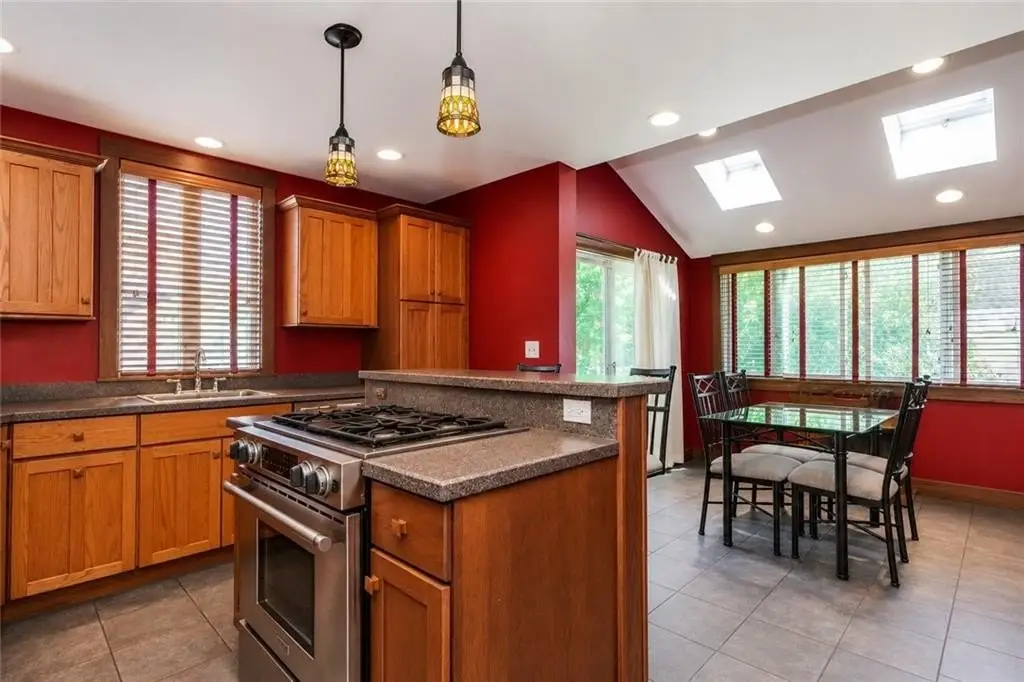
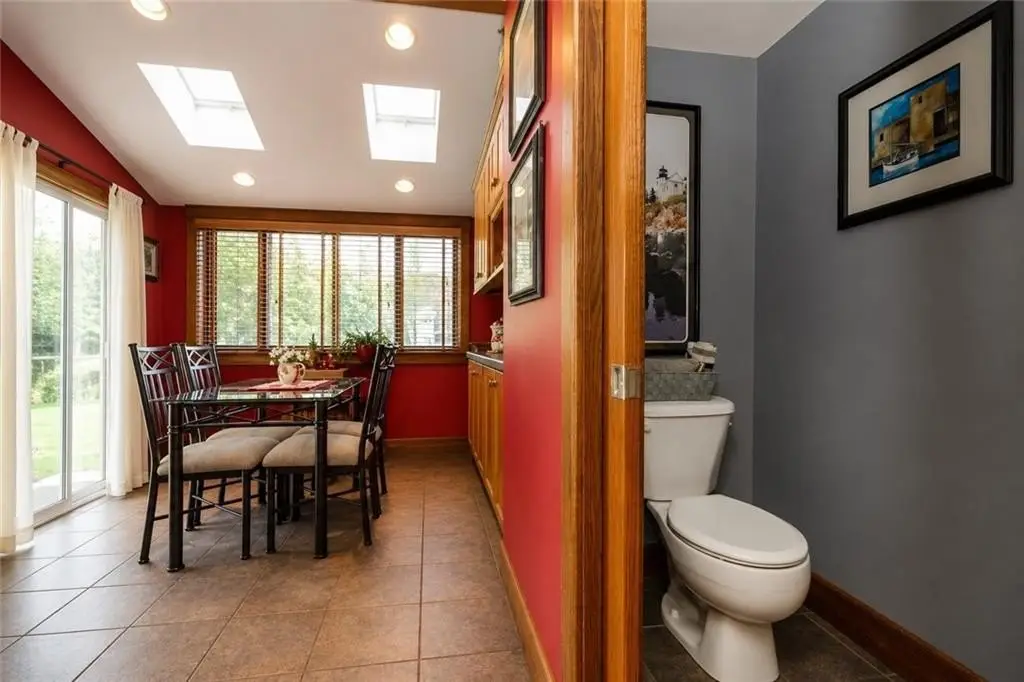
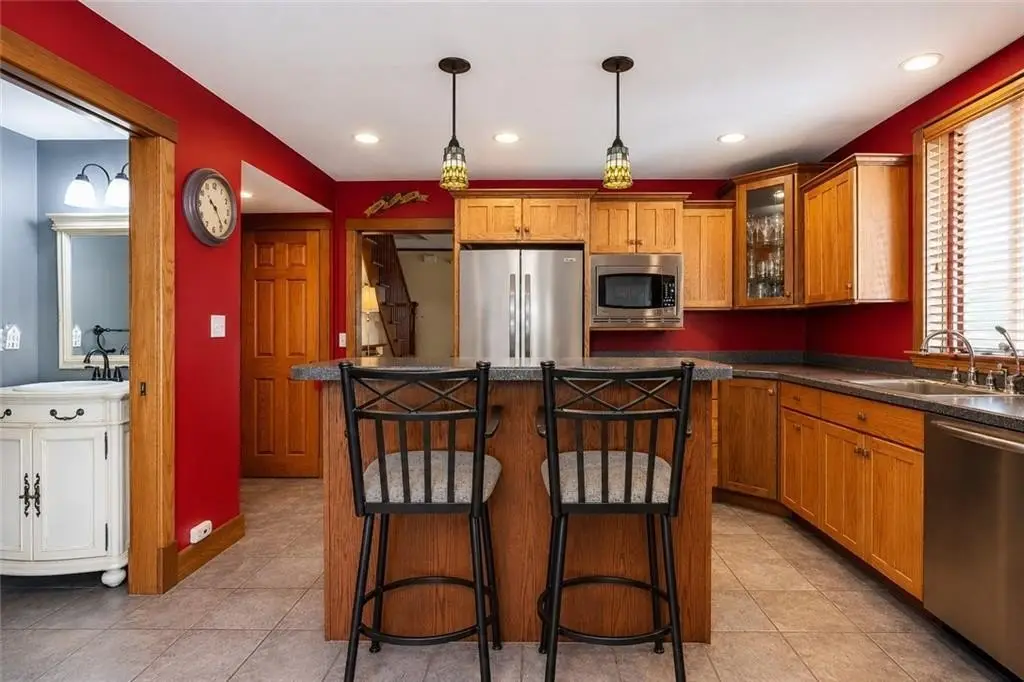
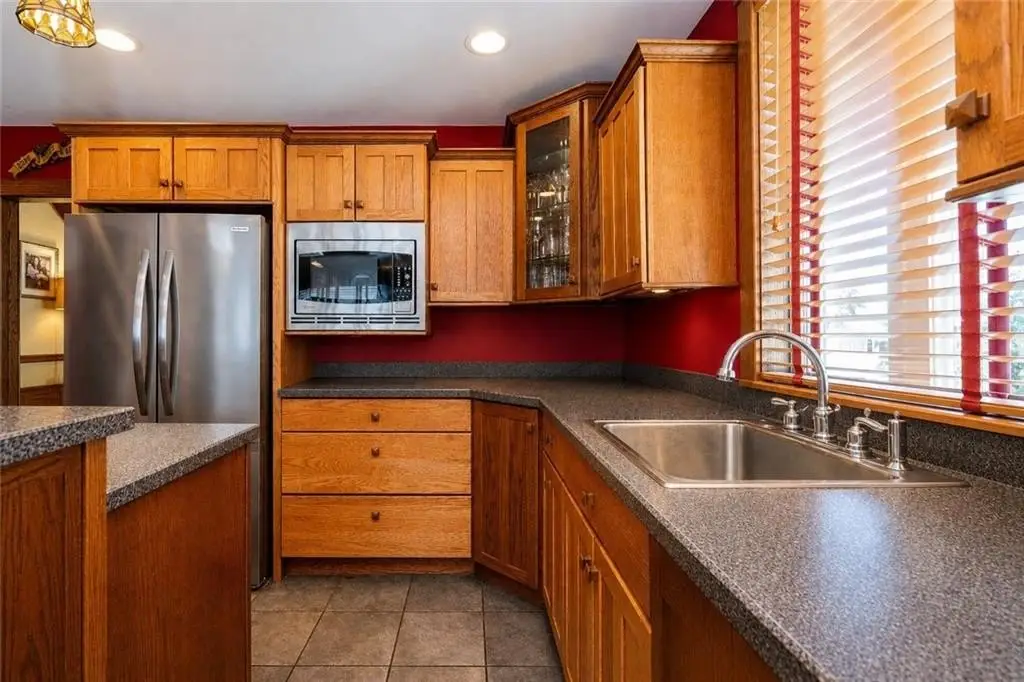
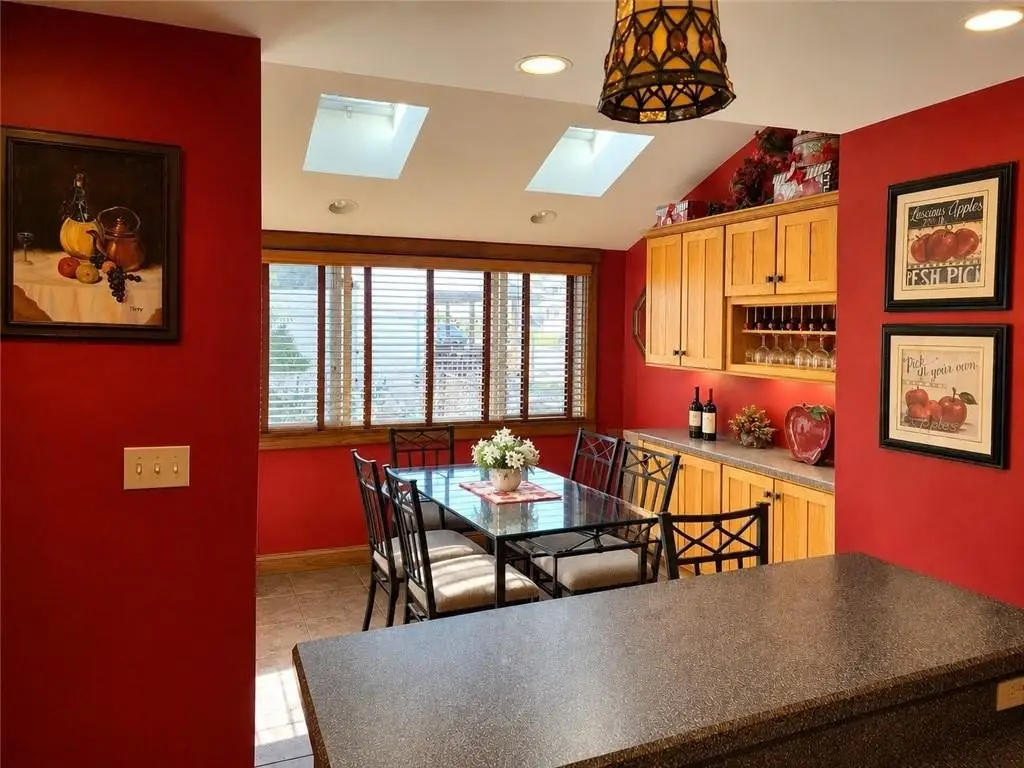
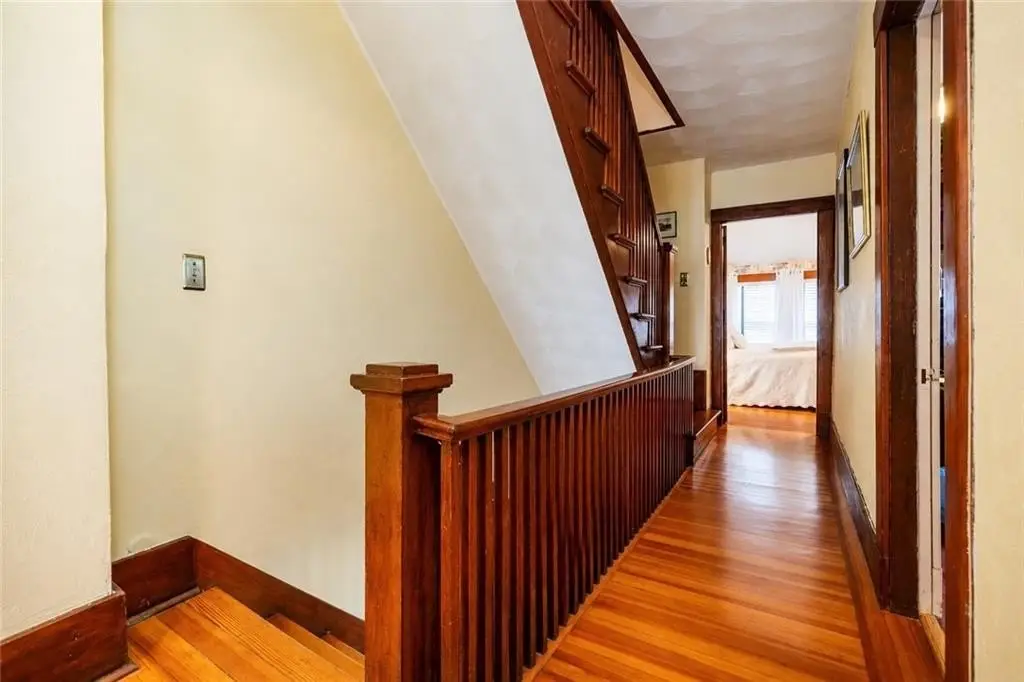
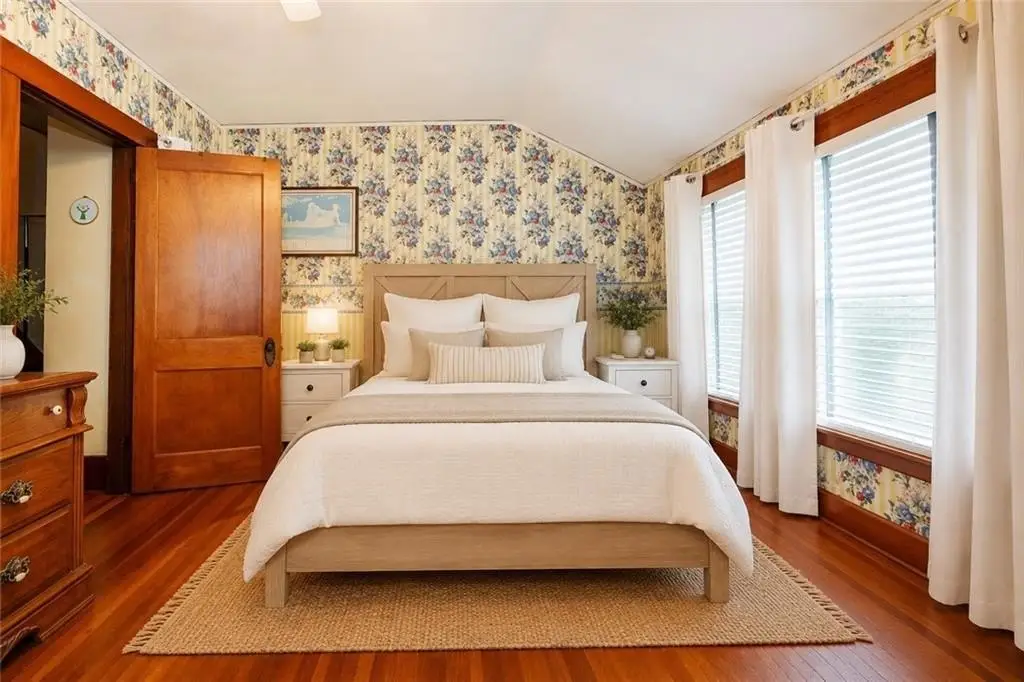
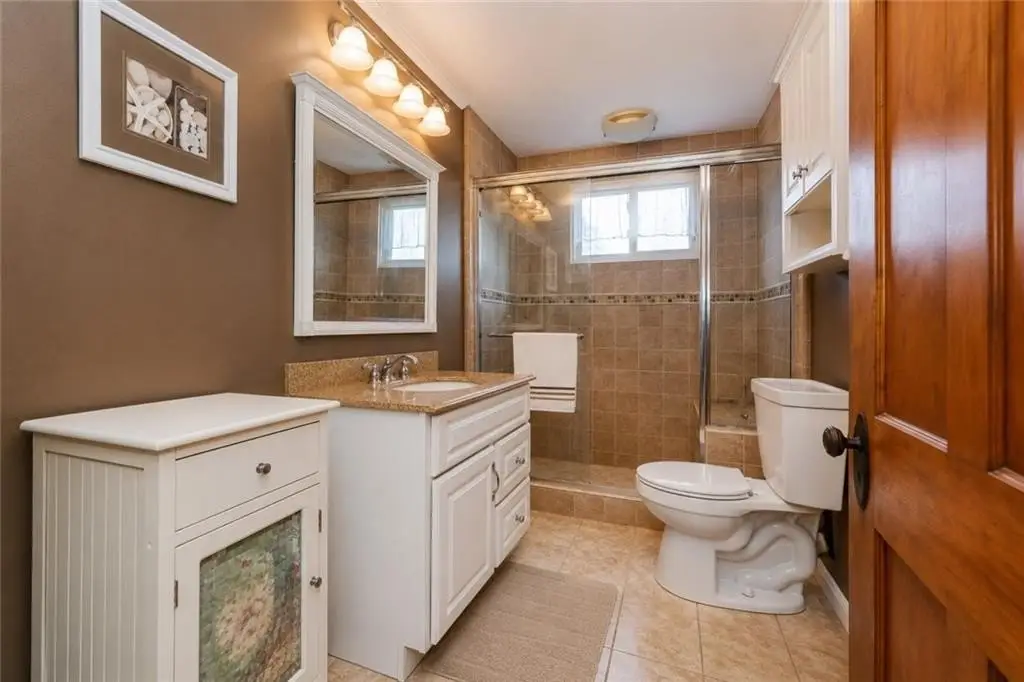
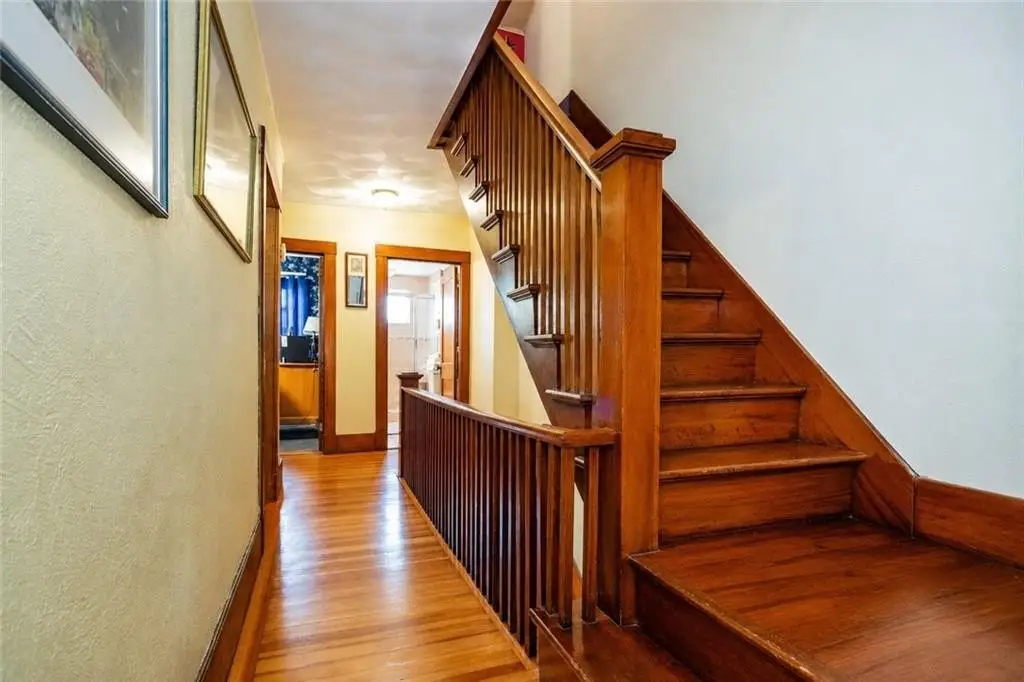
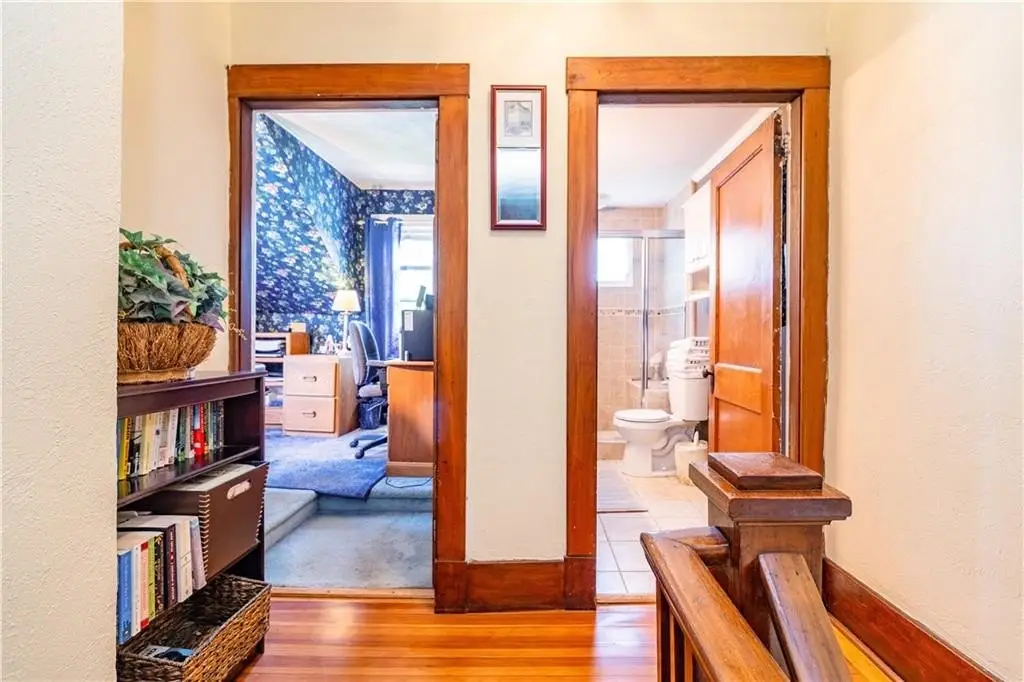
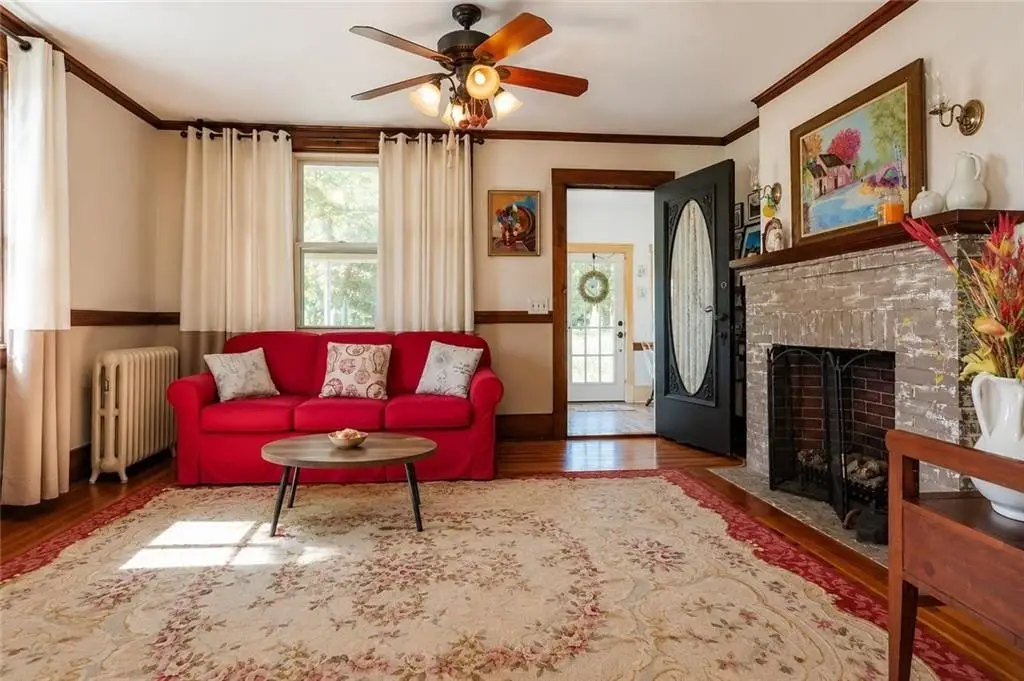
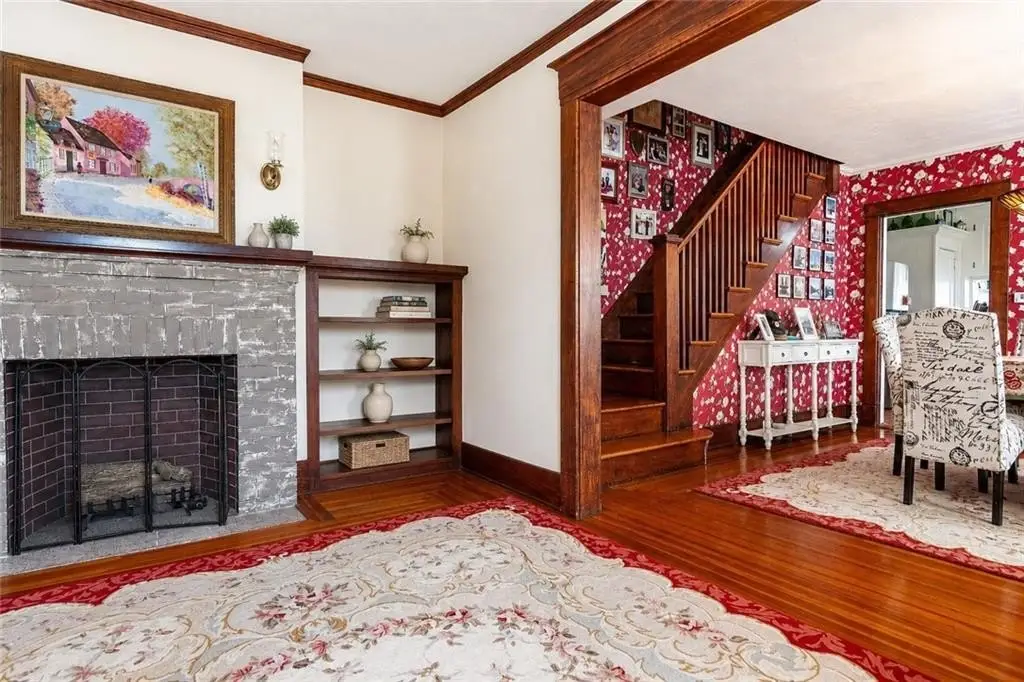
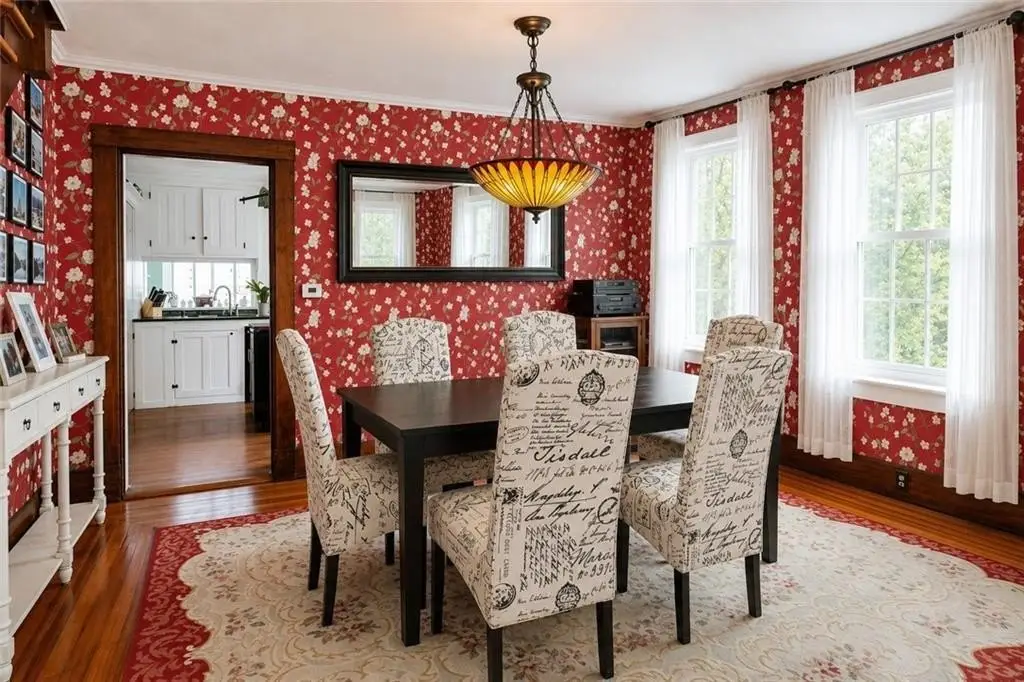
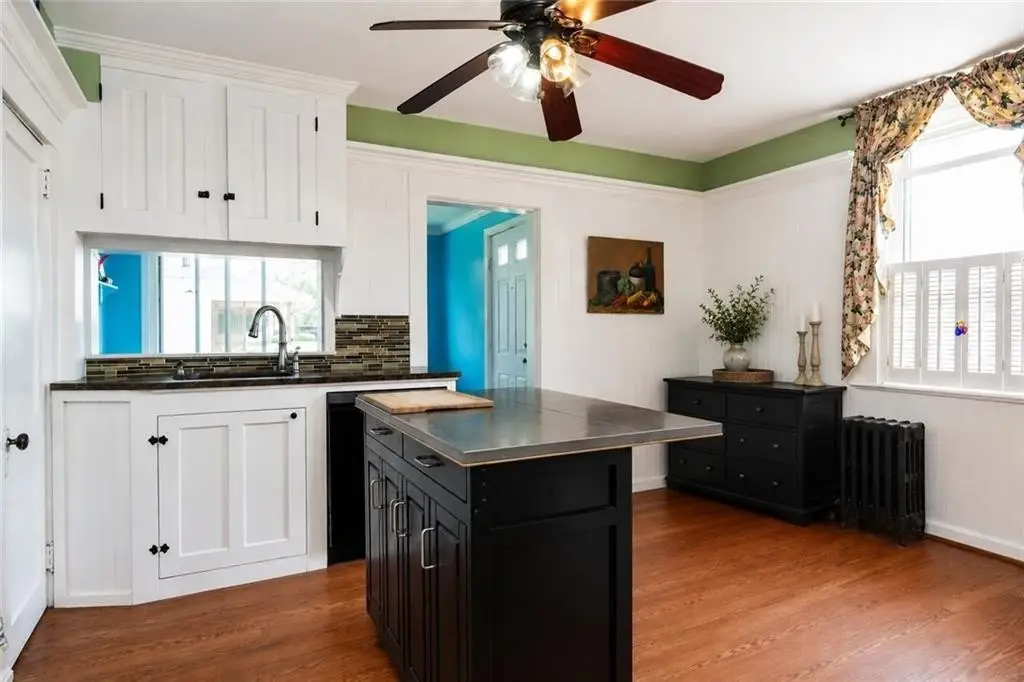
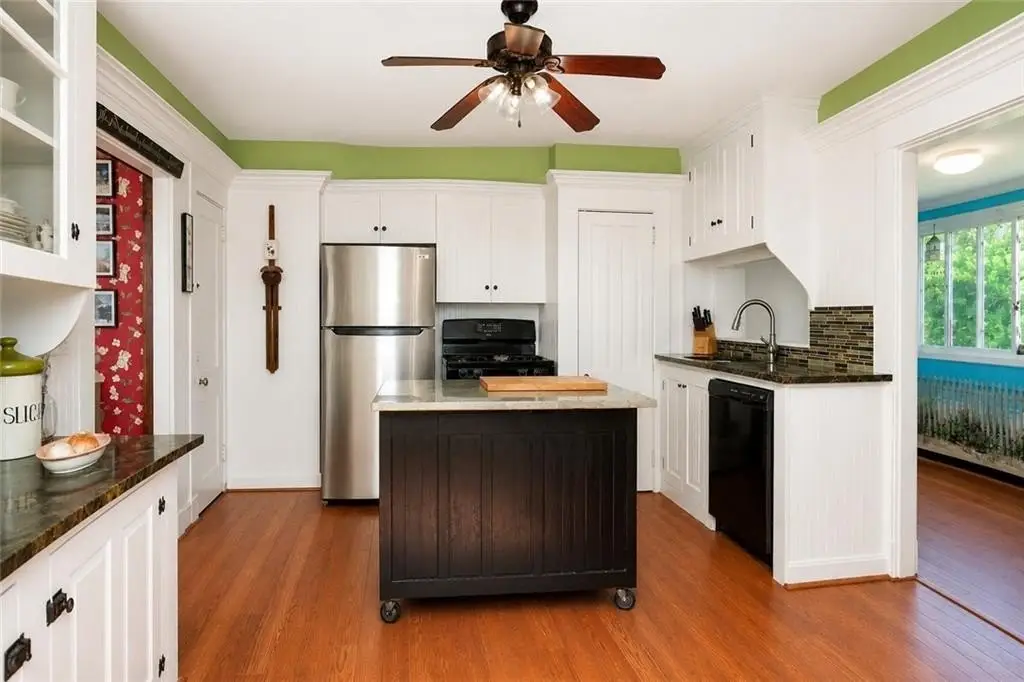
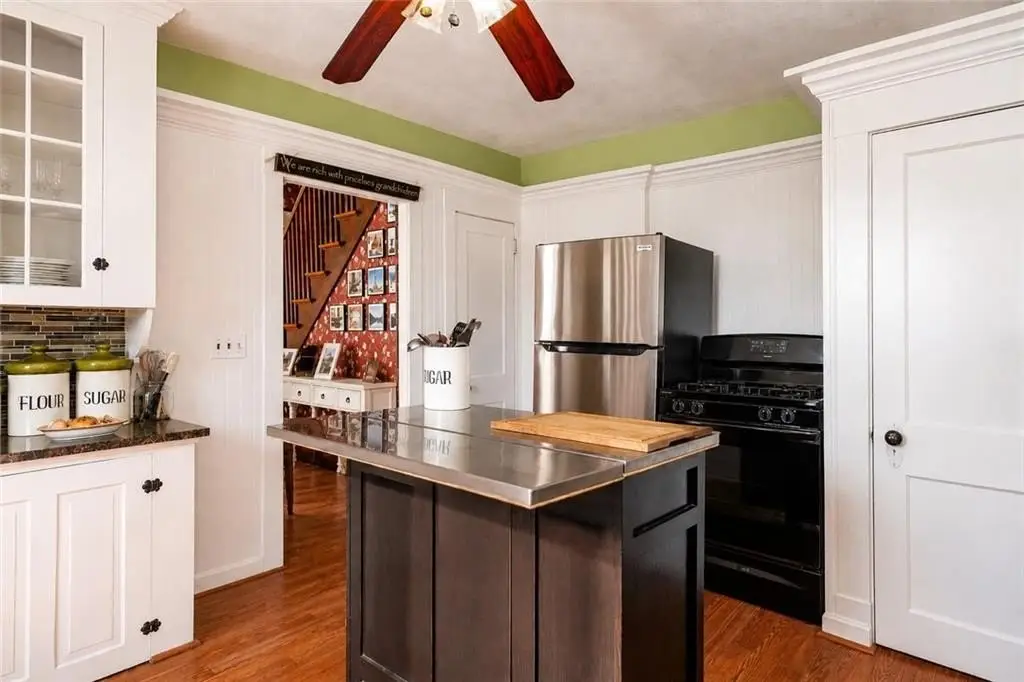
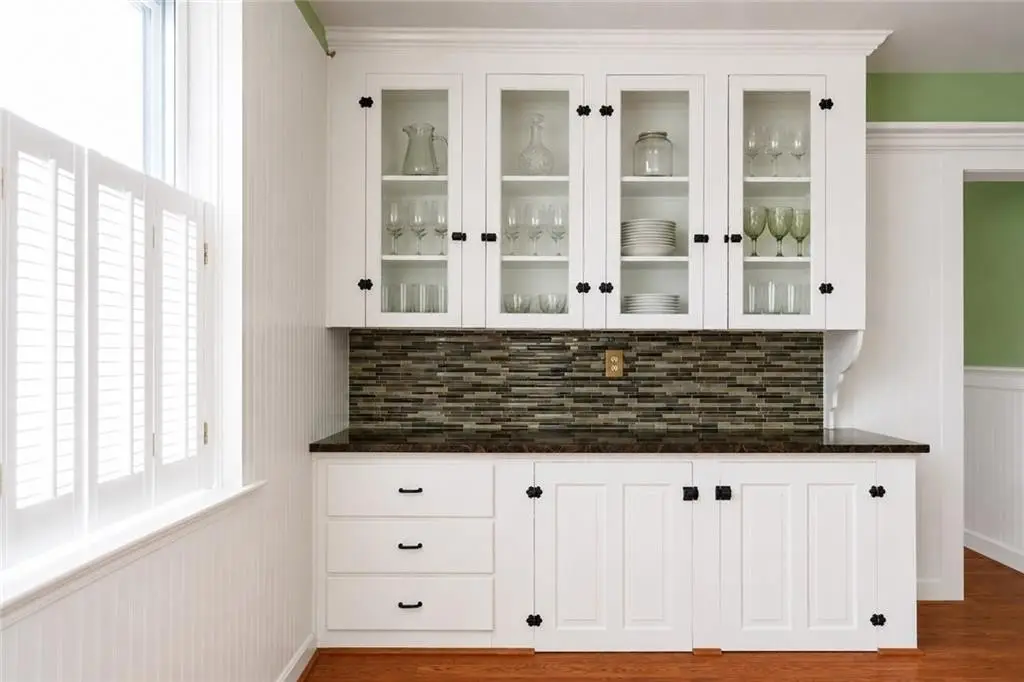
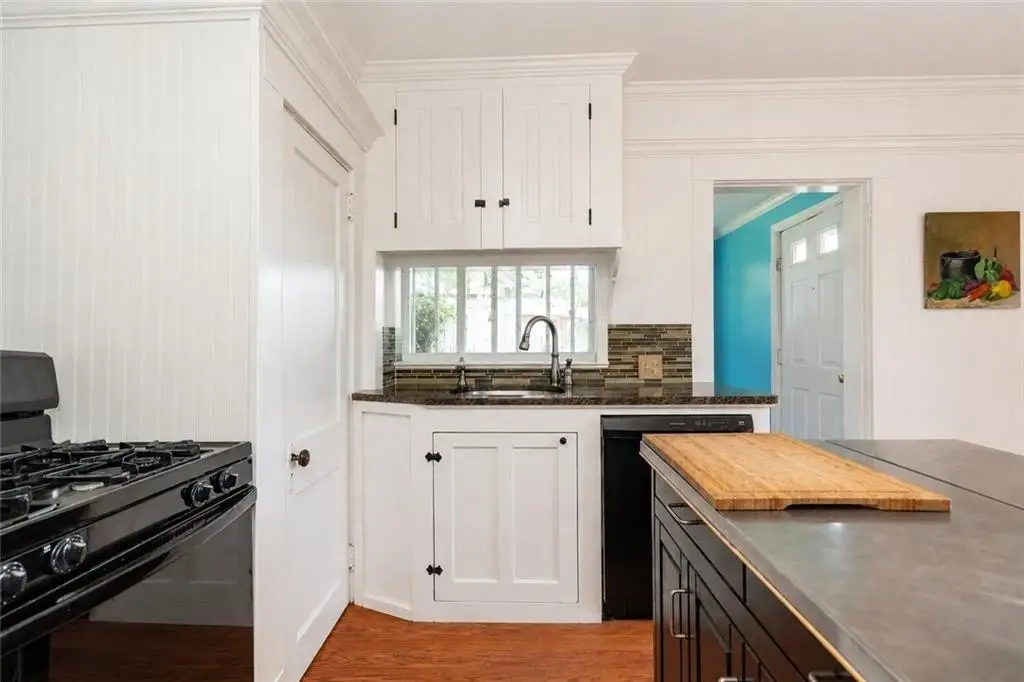
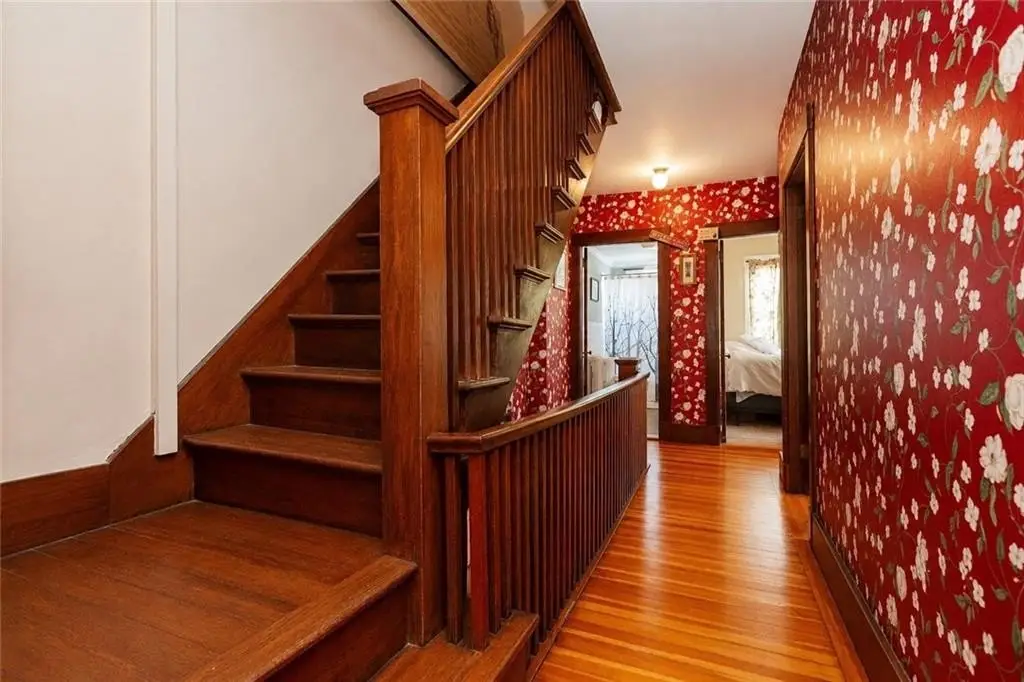
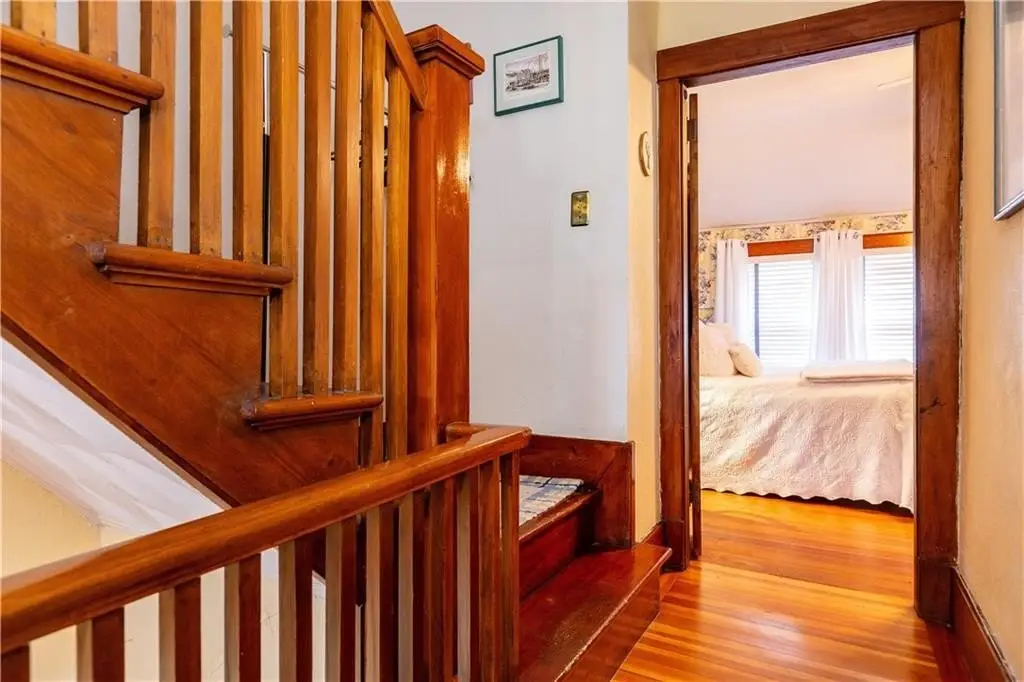
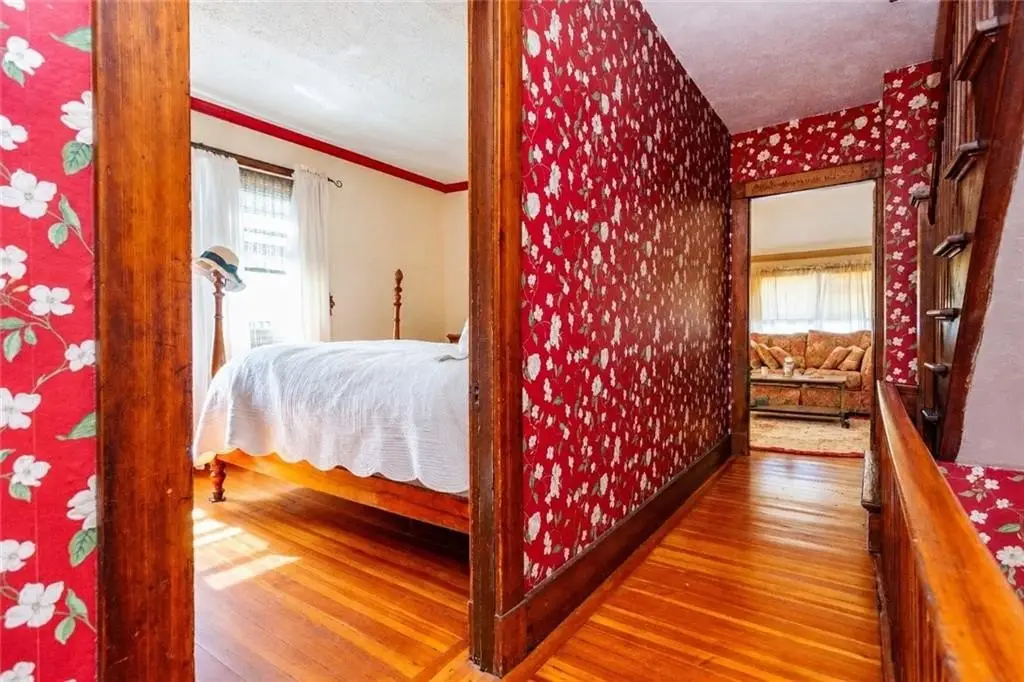
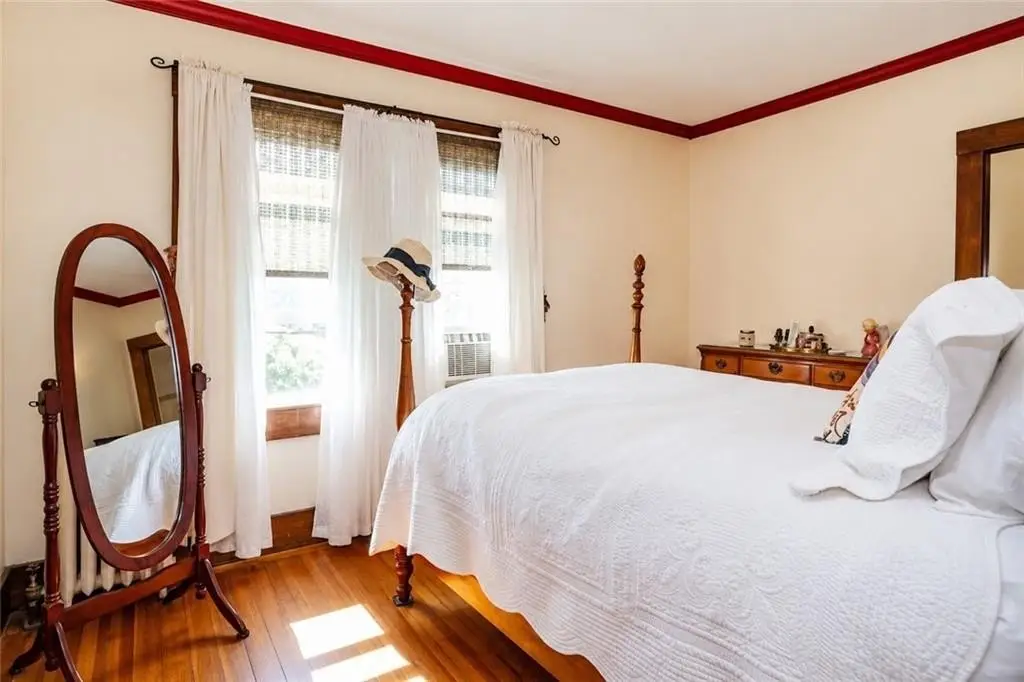
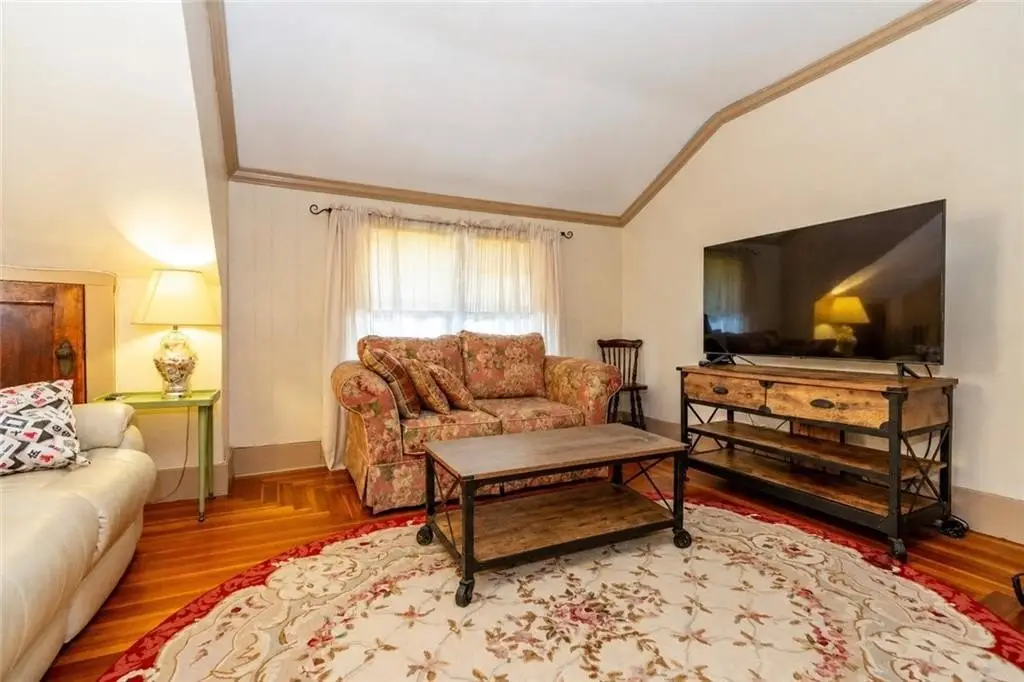
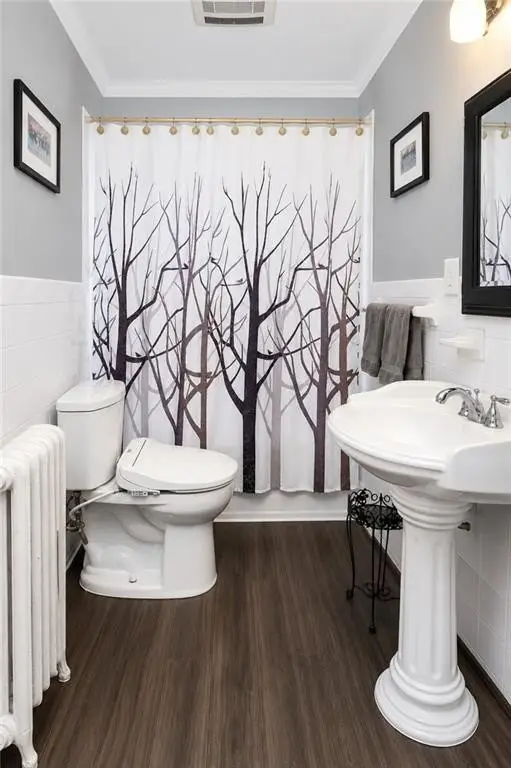
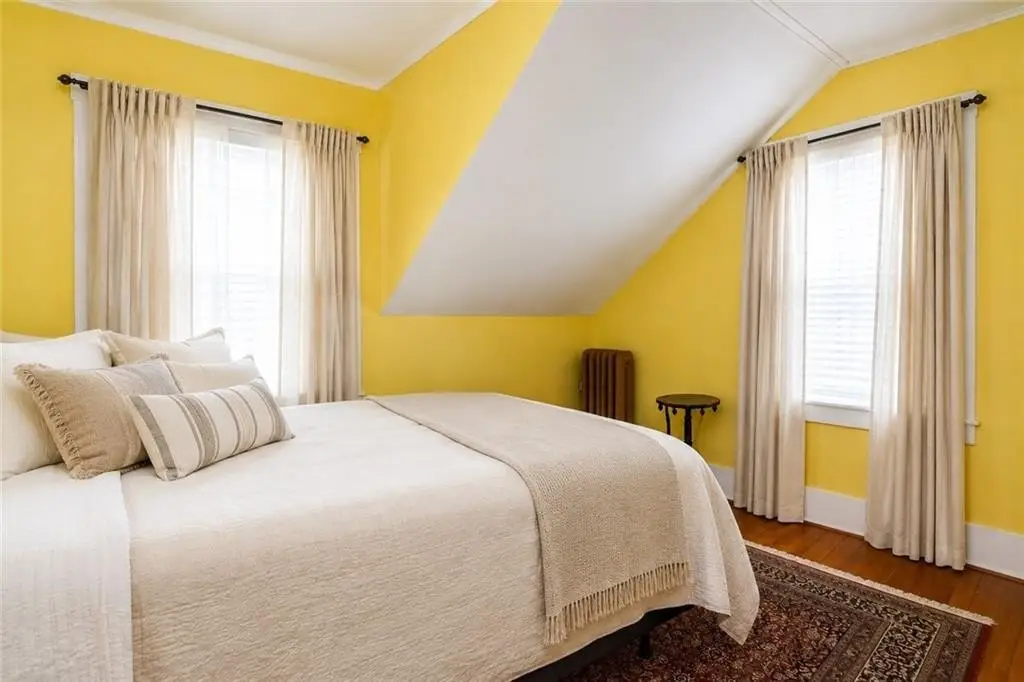
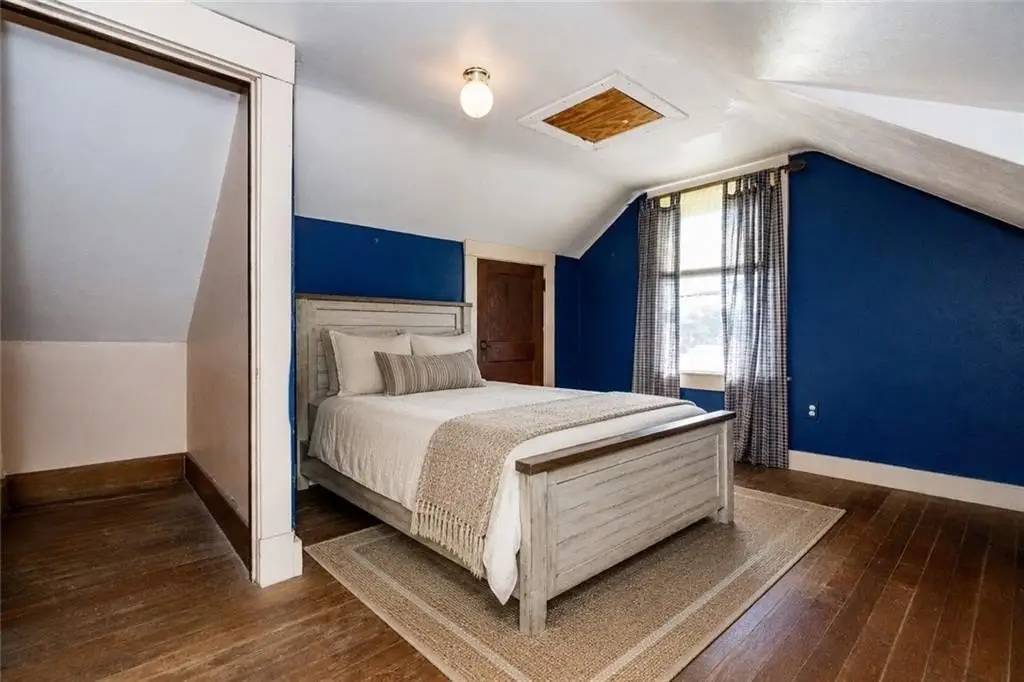
Built in the 1920s, this two-family craftsman home at 113-115 Beckwith Street offers a well-maintained, owner-occupied layout with approximately 3,000+ total square feet across two sides. Each unit features multiple bedrooms, with one side offering 1.5 baths and the other offering 1 bath. Interior highlights include original woodwork, updated kitchens with stainless steel appliances and granite counters, updated baths, skylights, gas fireplaces, and an alarm system.
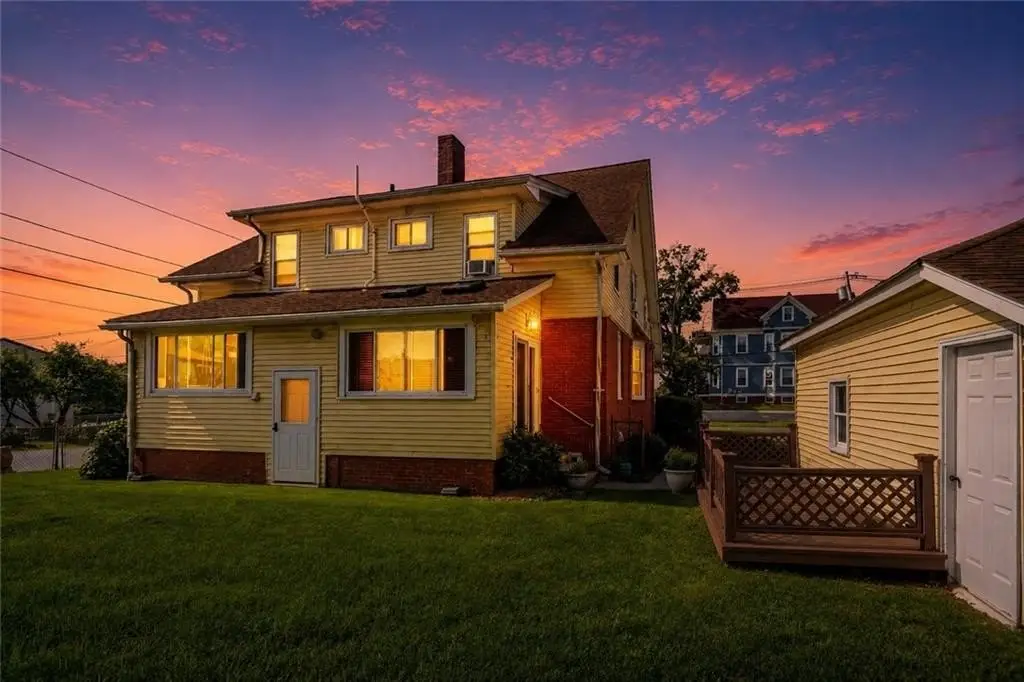
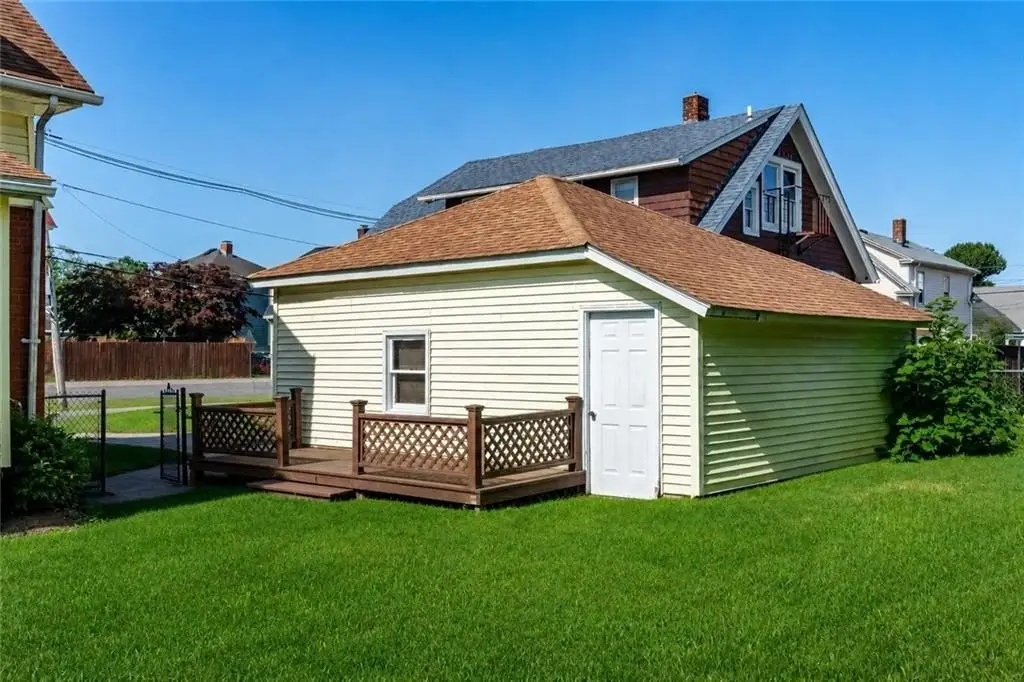
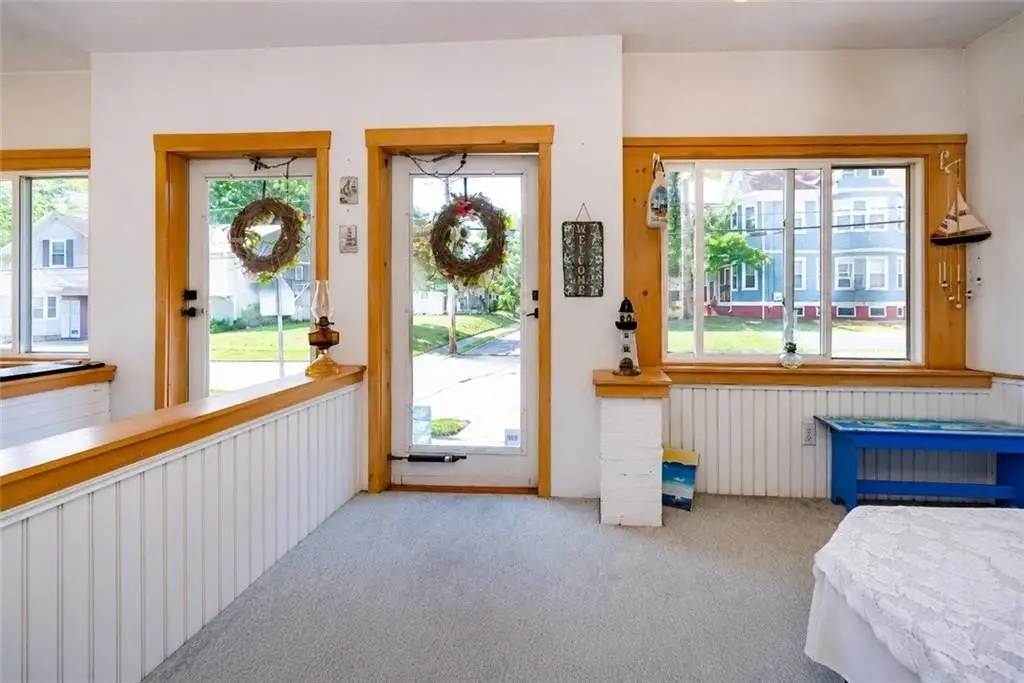
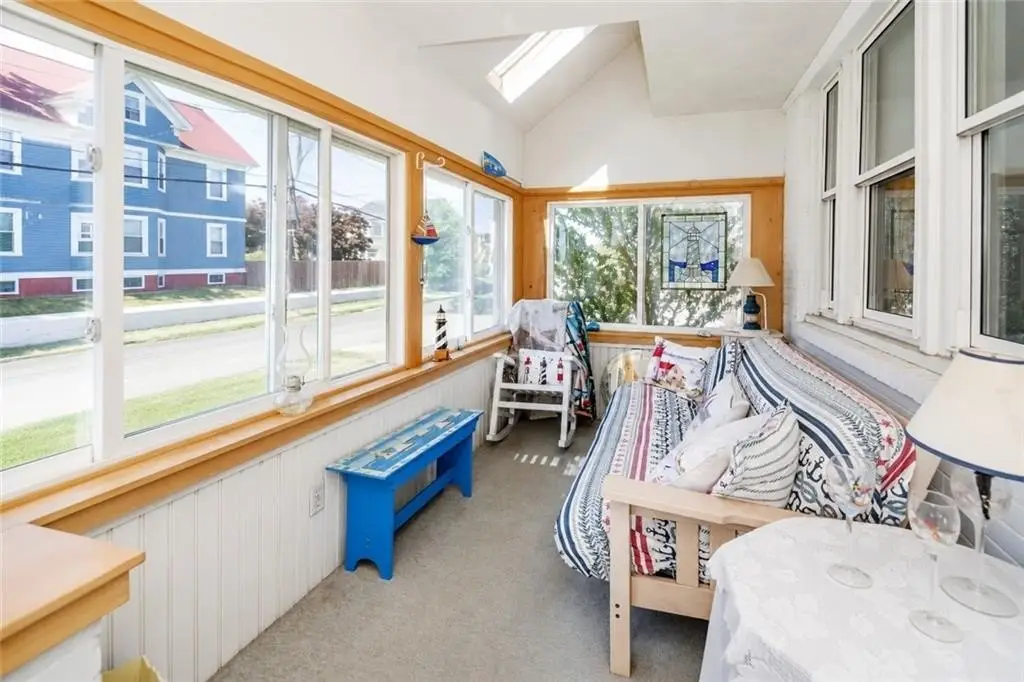
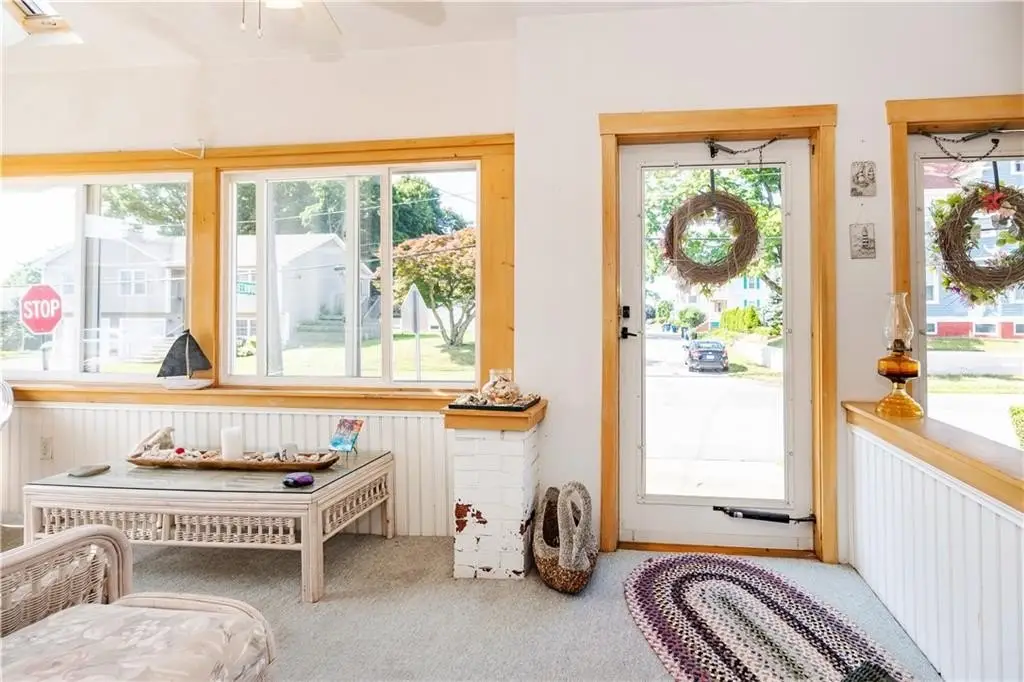
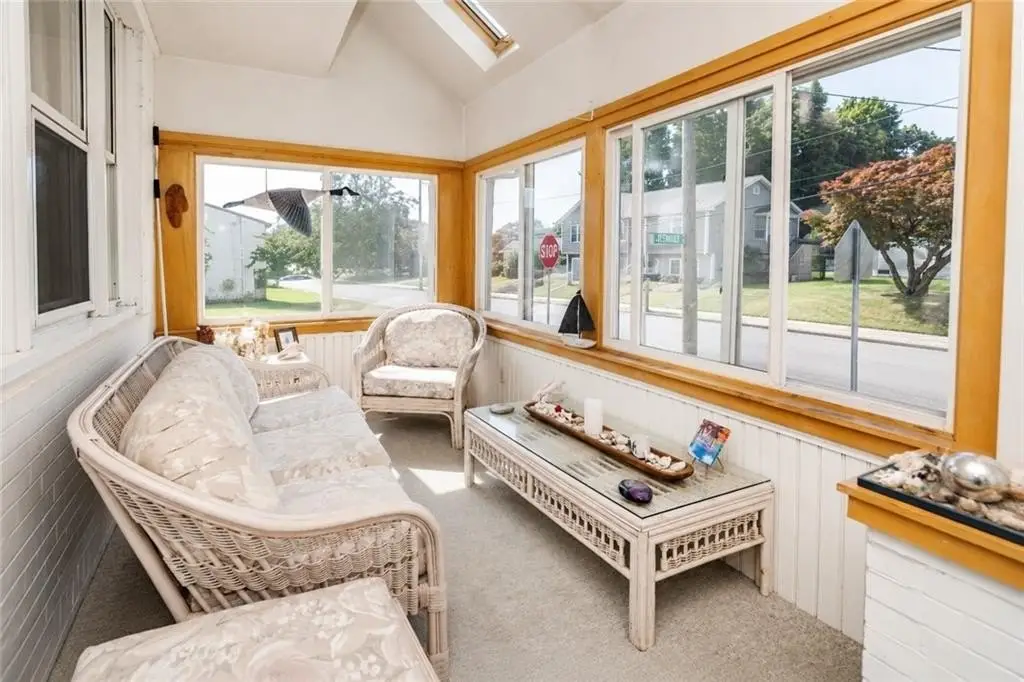
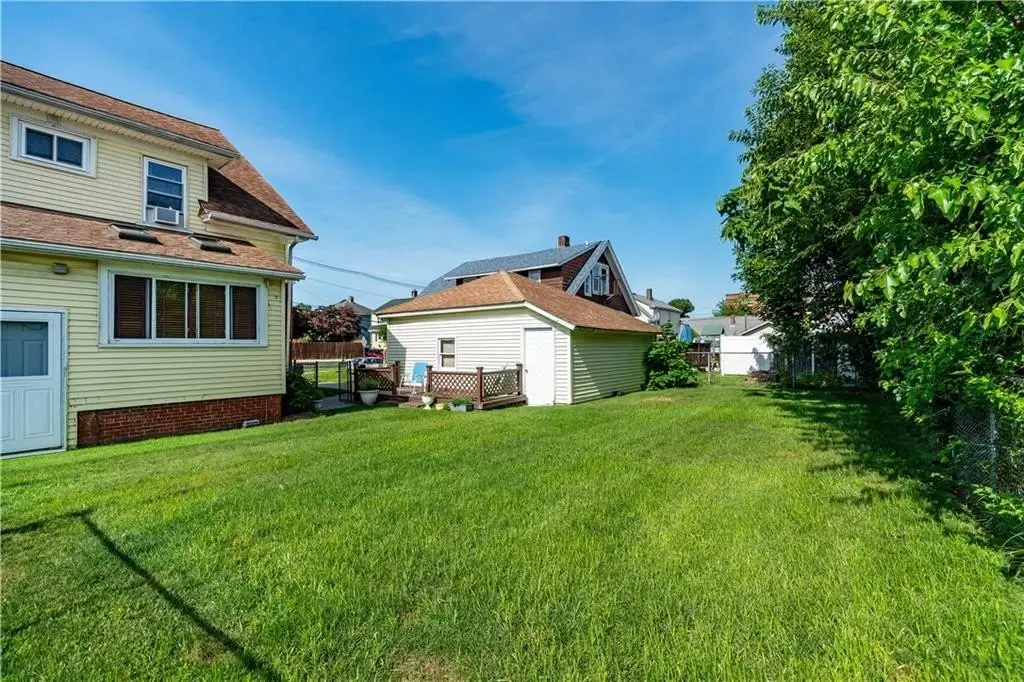
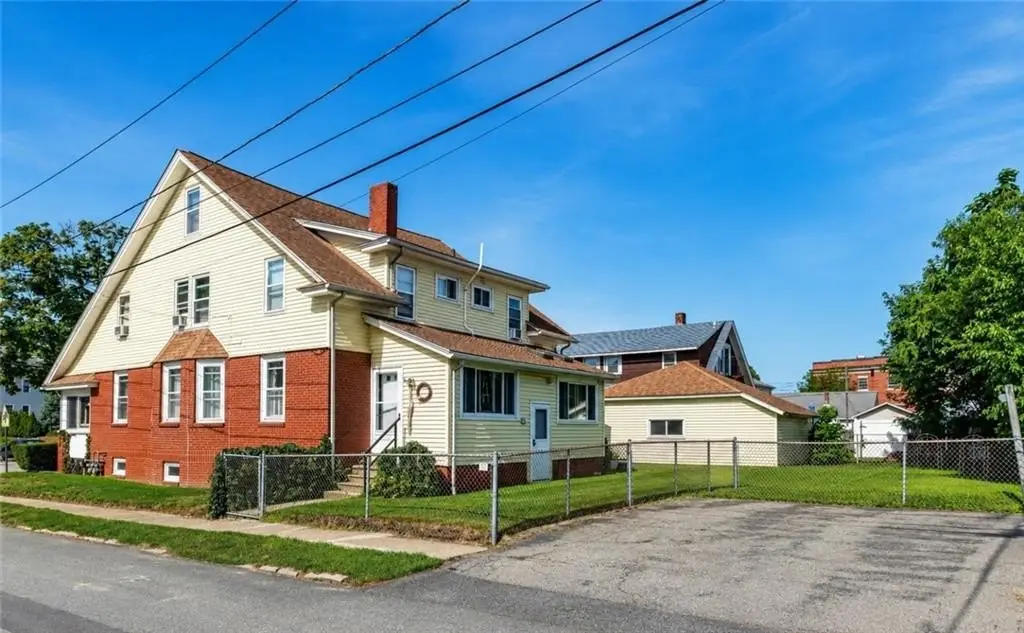
The property sits on a large corner lot with a professionally maintained fenced yard and sprinklers. Outdoor amenities include a deck, a huge enclosed front porch, and a bulkhead dormer providing outside access to the full basement. The home also has a two-car garage with storage and a workbench, plus two separate driveways.
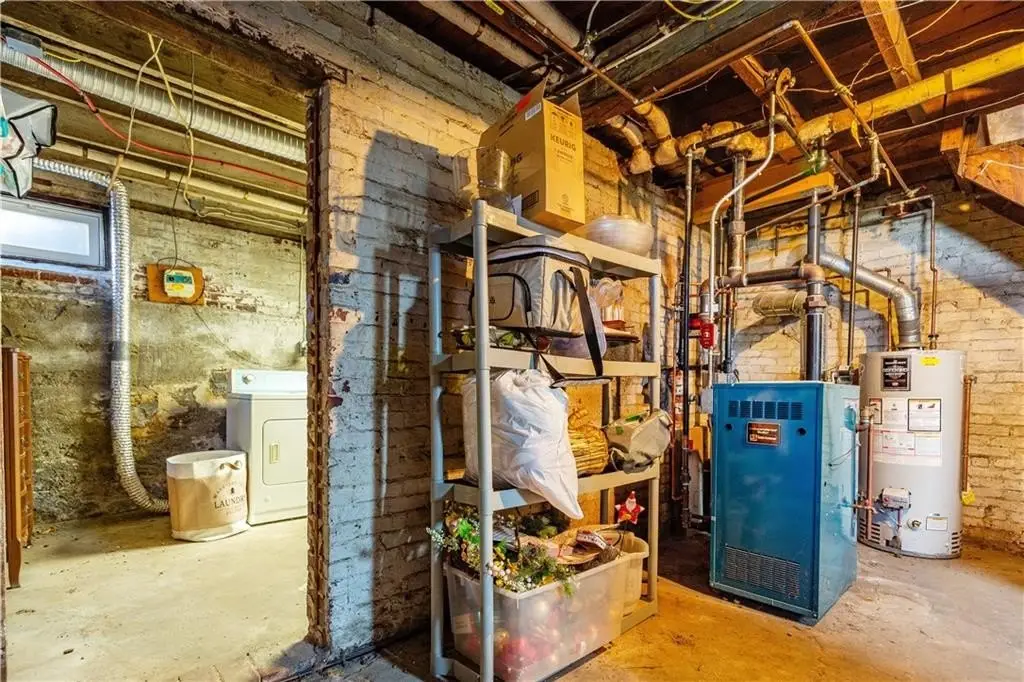
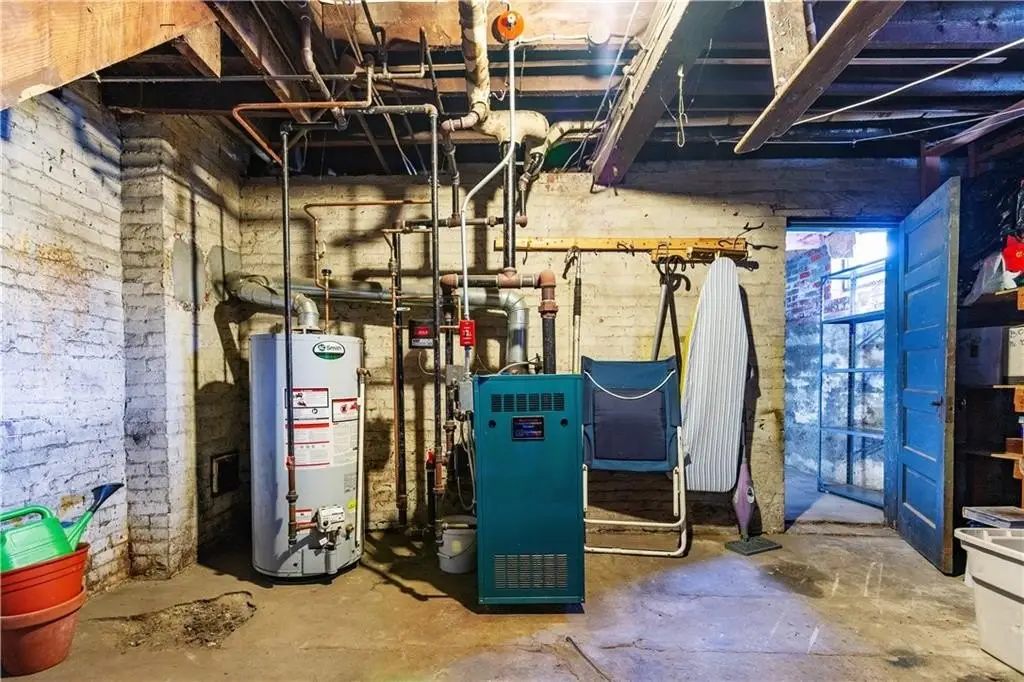
The full basement includes separate washer and dryer connections for each unit. Improvements noted include a newer roof, newer gas furnaces, and the structured upkeep reflected in the home’s long-term preservation.
The property sits on a large corner lot with a professionally maintained fenced yard and sprinklers. Outdoor amenities include a deck, a huge enclosed front porch, and a bulkhead dormer providing outside access to the full basement. The home also has a two-car garage with storage and a workbench, plus two separate driveways.
The full basement includes separate washer and dryer connections for each unit. Improvements noted include a newer roof, newer gas furnaces, and the structured upkeep reflected in the home’s long-term preservation.
Key Highlights
- 1920 Craftsman two‑family home with over 3,000 sq ft total living space (~1,500 sq ft per side)
- Each unit has been owner‑occupied for 30+ years; both sides offer 3–4 bedrooms
- Updated kitchens with stainless steel appliances and granite counters plus updated baths and skylights
Local Financial Insights For Multifamily LT 5
Simulate Cap Rate and NOI
NOI Build-Up
- Vacancy
- income lost from leasable area expected to sit empty during the year — subtracted from gross rent.
- EGI (Effective Gross Income)
- gross rent minus vacancy losses — the realistic income before paying operating costs.
- OpEx (Operating Expenses)
- recurring costs to operate the property (property tax, insurance, utilities, maintenance, management) — excludes financing and capital improvements.
- NOI (Net Operating Income)
- income a property generates after operating costs but before financing and taxes.
| Component | $ | $/SF |
|---|---|---|
| Gross rent | $77.7k | $25.44 |
| − Vacancy | −$5.1k | −$1.65 |
| EGI | $72.6k | $23.79 |
| − OpEx | −$21.8k | −$7.14 |
| NOI | $50.9k | $16.65 |
3,054 SF · lease $25.44/SF/yr · vacancy 6.50% · expense 30.00%
Alternative Uses
Best Use
Multifamily LT 5
$726.4K
$635.6K – $847.5K
NOI $50,851 @ 7.0% cap · market cap 7.60%
Second Best
Apartment 5plus
$576.5K
$504.5K – $672.6K
NOI $40,357 @ 7.0% cap · market cap 6.03%
Theoretical Best
—
—
same as Best Use
Zoning and permitted uses should be independently verified with local authorities.
Property Analytics
Property Profile
Location Intelligence
Current Use by Public Records
Duplexes
Similar For Sale Nearby










FAQs
What type of property is this?
Duplex - Meticulously maintained 1920s craftsman two-family home with two driveways, two-car garage, and separate unit laundry connections.
Where is this duplex located?
The property is located at 113 Beckwith Street Cranston, RI.
What is the asking price?
The asking price for this property is $669,000.
What are key features of this property?
This property features: 1920 Craftsman two‑family home with over 3,000 sq ft total living space (~1,500 sq ft per side); Each unit has been owner‑occupied for 30+ years; both sides offer 3–4 bedrooms; Updated kitchens with stainless steel appliances and granite counters plus updated baths and skylights


