1950s Walkup Apartment
For Sale
$3,100,000
1129 Lincoln BLVD, Santa Monica, CA 90403
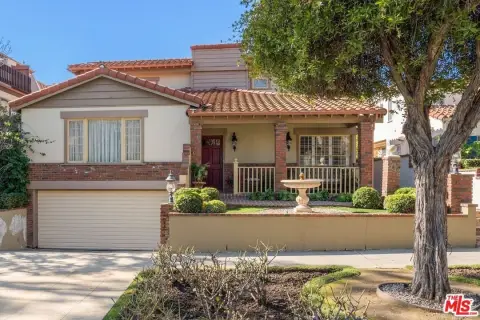
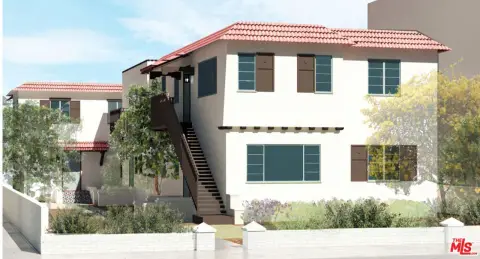
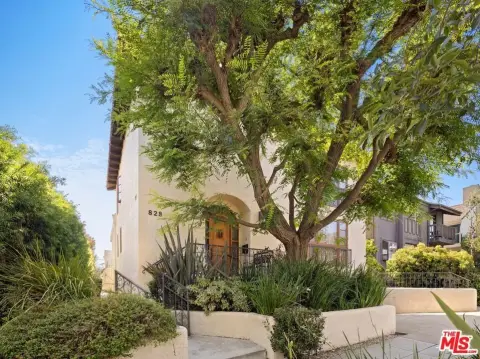
Two-story walkup features 10 rent-controlled units, gated courtyard access, on-site laundry, and parking garages plus surface spaces.
Property Size7,377 SF
Price / SF$420.23
Days on Market229
Property Features for 1129 Lincoln BLVD
General Information
Standard status
Active
Size
7,377 SF
Total Parking Spaces
10
Property subtype
Apartment
Additional Details
Fenced Yard
Yes
Multifamily Units
10
Amenities
gated central courtyard
laundry room
Building Details
Building Size
7,377 SF
Year Built
1956
Stories
2
Tenancy
Multi
Listing Agency:
Re/Max Commercial & Investment
Listed By:
Stephen Lampe · License #01164364
(310) 802-2500
Source:
Adambrawerestates
Added: Mar 6
Changed: Oct 17
Last Checked: Oct 21 at 3:40AM
Displayed information is deemed reliable but is not guaranteed and should be independently verified. All listing content including descriptions, pricing, images are the copyrighted material of Re/Max Commercial & Investment

Ask AI about this property
Review the available facts, identify missing information and prepare questions for the agent.
Investment Insights
Based on property information with market context.
Lincoln Park Apartments is a classic 1950’s, two-story walkup apartment building with 10 units. The mix includes three two-bedroom units, five one-bedroom units, and two studio apartments. A gated central courtyard provides access to the common area and entry for all units. On-site laundry is available, and the property includes seven parking garages plus a front parking area for three additional vehicles.
The building is subject to City of Santa Monica Rent Control, with rents described as below market and with rental income potential as units turn over. It is located in Santa Monica just north of Wilshire Boulevard, across from Reed Park, which occupies a full city block and includes picnic tables, benches, basketball courts, and public and private tennis courts. The complex is also described as a short walk or bike ride to 3rd Street Promenade, the park along Ocean Avenue, Santa Monica State Beach, and the Santa Monica Pier.
The building is subject to City of Santa Monica Rent Control, with rents described as below market and with rental income potential as units turn over. It is located in Santa Monica just north of Wilshire Boulevard, across from Reed Park, which occupies a full city block and includes picnic tables, benches, basketball courts, and public and private tennis courts. The complex is also described as a short walk or bike ride to 3rd Street Promenade, the park along Ocean Avenue, Santa Monica State Beach, and the Santa Monica Pier.
Key Highlights
- Classic 1950s two‑story walkup apartment building built in 1956 with 10 total units
- Unit mix: 3 two‑bedroom, 5 one‑bedroom, and 2 studio apartments
- Gated central courtyard provides access to the common area and entry for all units
Financial Insights
Estimated NOI and Cap Rate
NOI / Yr
$118,702
Cap Rate
3.83%
Suggested Prices Based on Cap Rates
Cap Rate 5%
$2,374,040
$2.4M
Cap Rate 7%
$1,695,743
$1.7M
Cap Rate 9%
$1,318,911
$1.3M
Market Conditions
NOI Build-Up for 7,377 SF
Gross rent
$234.6K $31.80/SF
− Vacancy
−$18.8K −$2.54/SF
EGI
$215.8K $29.26/SF
− OpEx
−$97.1K −$13.17/SF
NOI
$118.7K $16.09/SF
Area
Los Angeles County, CA
Vacancy
8.00%
Lease Rate
$31.80 /SF/Yr
Expense Ratio
45.00%
Simulate Cap Rate and NOI
Suggested Prices Based on Cap Rates
Cap Rate 5%
$2,374,040
Cap Rate 7%
$1,695,743
Cap Rate 9%
$1,318,911
Alternative Uses
Best Use
Apartment 5plus
$1.70M
$1.48M – $1.98M
NOI $118,702 @ 7.0% cap · market cap 3.83%
Second Best
—
—
no second resolved use
Theoretical Best
Office A
$3.95M
$3.46M – $4.61M
NOI $276,473 @ 7.0% cap · market cap 8.92%
Zoning and permitted uses should be independently verified with authorities.
How Realmo checks its estimates
Property Analytics
Contact the owner directly
Get the owner's phone numbers and email
Open Analytics
Lease Details
10
Residential units
Multi-tenant
Tenancy
Yes
Fenced yard
Location Intelligence
Trade Area within ½ mile
9,291
Businesses Nearby
Explore this area
Business Placement
Demographics for 90403, CA
25,278
Population
14,853
Households
1.7
Avg Household Size
42
Median Age
72%
College-Educated
96%
High-School Grad
1.4 sq mi
ZIP Area
18,056
Density / Sq Mi
$121,512
Median Household Income
$82,557
Median Earnings
$2,443
Median Rent
$1,553,500
Median Home Value
Check the figures for this property
Cap Rate, Value Estimation, Potential NOI and more
View Realmo Analytics
Market
Vacancy Rate% for Multifamily in West region





Frequently Asked Questions
What type of property is this?
Apartment building - Two-story walkup features 10 rent-controlled units, gated courtyard access, on-site laundry, and parking garages plus surface spaces.
Where is this apartment building located?
The property is located at 1129 Lincoln BLVD Santa Monica, CA.
What is the asking price?
The asking price for this property is $3,100,000.
What are key features of this property?
This property features: Classic 1950s two‑story walkup apartment building built in 1956 with 10 total units; Unit mix: 3 two‑bedroom, 5 one‑bedroom, and 2 studio apartments; Gated central courtyard provides access to the common area and entry for all units


