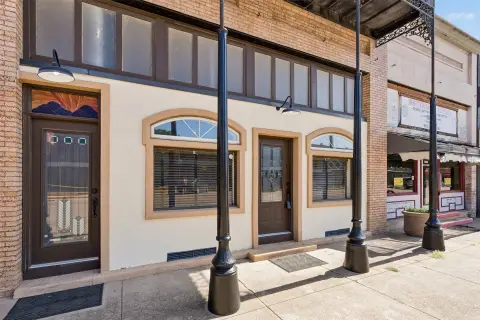
Historic Brick Restaurant
For Sale
$525,000
112 W Grand St, Whitewright, TX 75491
Restaurant with a full kitchen, bar, and original architectural details.
Property Size2,500 SF
Price / SF$210
Days on Market60
Property Features for 112 W Grand St
General Information
Standard status
Active
Size
2,500 SF
Building Details
Year Built
1911
Construction
brick
Listing Agency:
DFW Elite
Listed By:
Sheri Kent · License #0496604
(214) 642-6969
Source:
Heritance
Added: Aug 16
Changed: Oct 10
Last Checked: Oct 13 at 1:01AM
Displayed information is deemed reliable but is not guaranteed and should be independently verified. All listing content including descriptions, pricing, images are the copyrighted material of DFW Elite
Investment Insights
Based on property information with market context.
This 2,500-square-foot restaurant occupies a brick building constructed in 1911 at 112 W Grand St. in downtown Whitewright. The interior features exposed antique brick, rustic furnishings, and original ornate metal ceiling tiles over the main seating area. A full bar and beverage station serve the dining space, while the kitchen includes an additional work station. His-and-hers restrooms are also provided.
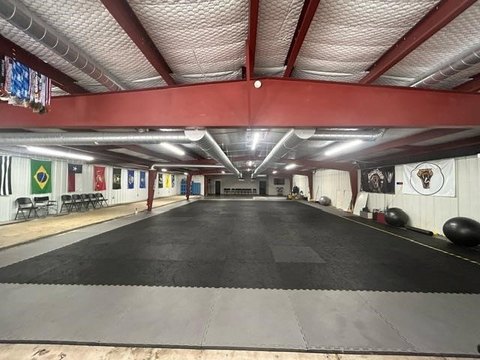
The building sits beside the Odeum Theater and a martial arts building, with staff parking available in the rear alley. The current operation, Tejas Mexican Grill, is open Wednesday through Sunday. The restaurant is available for appointment-based showings.
The building sits beside the Odeum Theater and a martial arts building, with staff parking available in the rear alley. The current operation, Tejas Mexican Grill, is open Wednesday through Sunday. The restaurant is available for appointment-based showings.
Key Highlights
- 2,500 SF restaurant in a brick building constructed in 1911
- Original ornate metal ceiling tiles above the seating area
- Full bar, beverage station, and kitchen with additional work station
Financial Insights
Estimated NOI and Cap Rate
NOI / Yr
$44,460
Cap Rate
8.47%
Suggested Prices Based on Cap Rates
Cap Rate 5%
$889,200
$889.2K
Cap Rate 7%
$635,143
$635.1K
Cap Rate 9%
$494,000
$494.0K
Market Conditions
NOI Build-Up for 2,500 SF
Gross rent
$62.4K $24.96/SF
− Vacancy
−$3.1K −$1.25/SF
EGI
$59.3K $23.71/SF
− OpEx
−$14.8K −$5.93/SF
NOI
$44.5K $17.78/SF
Area
Grayson County, TX
Vacancy
5.00%
Lease Rate
$24.96 /SF/Yr
Expense Ratio
25.00%
Simulate Cap Rate and NOI
Suggested Prices Based on Cap Rates
Cap Rate 5%
$889,200
Cap Rate 7%
$635,143
Cap Rate 9%
$494,000
Alternative Uses
Best Use
Specialty Retail
$635.1K
$555.8K – $741.0K
NOI $44,460 @ 7.0% cap · market cap 8.47%
Second Best
Industrial
$186.0K
$162.8K – $217.1K
NOI $13,023 @ 7.0% cap · market cap 2.48%
Theoretical Best
Hotel Hospitality
$1.28M
$1.12M – $1.50M
NOI $89,775 @ 7.0% cap · market cap 17.10%
Zoning and permitted uses should be independently verified with authorities.
How Realmo checks its estimates
Property Analytics
Unlock full access to Insights
Subscribe to Realmo Intelligence
Open Analytics
Current Use
Location Intelligence
Trade Area within ½ mile
125
Businesses Nearby
Well-served
Demand for This Use
Explore this area
Business Placement
Demographics for 75491, TX
5,148
Population
2,353
Households
2.2
Avg Household Size
43
Median Age
26%
College-Educated
91%
High-School Grad
98.6 sq mi
ZIP Area
52
Density / Sq Mi
$71,774
Median Household Income
$48,813
Median Earnings
$881
Median Rent
$239,700
Median Home Value
Check the figures for this property
Cap Rate, Value Estimation, Potential NOI and more
View Realmo Analytics
Market
Vacancy Rate% for Retail in South region

Questions? Ask Rey
Realmo’s AI knows this listing — price, zoning, demand, history. Ask anything.



Frequently Asked Questions
What type of property is this?
Conventional restaurant - Restaurant with a full kitchen, bar, and original architectural details.
Where is this conventional restaurant located?
The property is located at 112 W Grand St Whitewright, TX.
What is the asking price?
The asking price for this property is $525,000.
What are key features of this property?
This property features: 2,500 SF restaurant in a brick building constructed in 1911; Original ornate metal ceiling tiles above the seating area; Full bar, beverage station, and kitchen with additional work station