Restored Live-Work
For Sale
$625,000
112 Buckroe Ave, Hampton, VA 23664
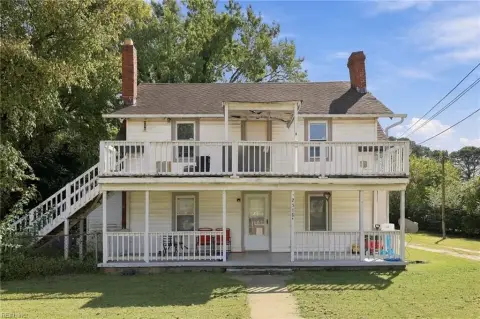
Two-level property combines a professional office layout with a two-bedroom residence and water views.
Property Size1,892 SF
Price / SF$330.34
Days on Market49
Property Features for 112 Buckroe Ave
General Information
Standard status
Active
Size
1,892 SF
Additional Details
Floor
1
Building Details
Year Built
1931
Buildings
1
Stories
2
Listing Agency:
Swell Realty Co
Listed By:
Tammy Coleman · License #7318
(757) 333-3366
Source:
Distinctlyrealestate
Added: Aug 28
Changed: Oct 7
Last Checked: Oct 7 at 3:15PM
Displayed information is deemed reliable but is not guaranteed and should be independently verified. All listing content including descriptions, pricing, images are the copyrighted material of Swell Realty Co
Investment Insights
Based on property information with market context.
This 1,892-square-foot live-work property, built in 1931, combines a professional office environment with an upper-level residence. The first floor includes a lobby, conference area, three offices, an accessible restroom, kitchenette, storage, and a covered rear porch. The second floor contains a two-bedroom residence with a full bath, large kitchen, living area, water views, and an oversized rear deck.
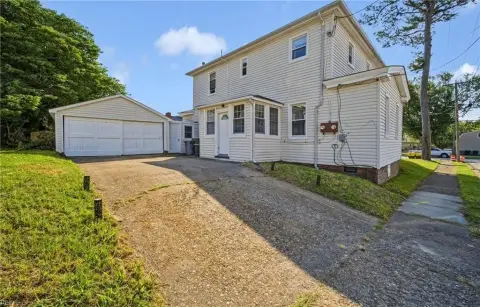
The property has undergone extensive restoration, with updated HVAC, electrical, and plumbing systems, structural improvements, and renewed interior finishes alongside preserved architectural details. Front and rear parking provide on-site convenience. Buckroe Beach is 0.1 mile away, described as a 2-minute walk, while the property is also positioned near the Chesapeake Bay.
The property has undergone extensive restoration, with updated HVAC, electrical, and plumbing systems, structural improvements, and renewed interior finishes alongside preserved architectural details. Front and rear parking provide on-site convenience. Buckroe Beach is 0.1 mile away, described as a 2-minute walk, while the property is also positioned near the Chesapeake Bay.
Key Highlights
- 1,892 SF live‑work property built in 1931
- Second‑level two‑bedroom residence with water views and oversized rear deck
- First‑floor office layout with lobby, conference area, three offices, and kitchenette
Financial Insights
Estimated NOI and Cap Rate
NOI / Yr
$24,865
Cap Rate
3.98%
Suggested Prices Based on Cap Rates
Cap Rate 5%
$497,300
$497.3K
Cap Rate 7%
$355,214
$355.2K
Cap Rate 9%
$276,278
$276.3K
Market Conditions
NOI Build-Up for 1,892 SF
Gross rent
$37.5K $19.80/SF
− Vacancy
−$4.3K −$2.28/SF
EGI
$33.2K $17.52/SF
− OpEx
−$8.3K −$4.38/SF
NOI
$24.9K $13.14/SF
Area
Hampton, VA
Vacancy
11.50%
Lease Rate
$19.80 /SF/Yr
Expense Ratio
25.00%
Simulate Cap Rate and NOI
Suggested Prices Based on Cap Rates
Cap Rate 5%
$497,300
Cap Rate 7%
$355,214
Cap Rate 9%
$276,278
Alternative Uses
Best Use
Office B
$355.2K
$310.8K – $414.4K
NOI $24,865 @ 7.0% cap · market cap 3.98%
Second Best
Mixed Use
$335.7K
$293.7K – $391.7K
NOI $23,499 @ 7.0% cap · market cap 3.76%
Theoretical Best
Office A
$492.0K
$430.5K – $574.0K
NOI $34,442 @ 7.0% cap · market cap 5.51%
Zoning and permitted uses should be independently verified with authorities.
How Realmo checks its estimates
Property Analytics
Unlock full access to Insights
Subscribe to Realmo Intelligence
Open Analytics
Current Use
Location Intelligence
Trade Area within ½ mile
115
Businesses Nearby
Explore this area
Business Placement
Demographics for 23664, VA
10,301
Population
4,871
Households
2.1
Avg Household Size
43
Median Age
33%
College-Educated
97%
High-School Grad
5.4 sq mi
ZIP Area
1,908
Density / Sq Mi
$81,667
Median Household Income
$44,014
Median Earnings
$1,303
Median Rent
$280,700
Median Home Value
Check the figures for this property
Cap Rate, Value Estimation, Potential NOI and more
View Realmo Analytics
Market
Vacancy Rate% for Office in South region

Questions? Ask Rey
Realmo’s AI knows this listing — price, zoning, demand, history. Ask anything.




Frequently Asked Questions
What type of property is this?
Live-work space - Two-level property combines a professional office layout with a two-bedroom residence and water views.
Where is this live-work space located?
The property is located at 112 Buckroe Ave Hampton, VA.
What is the asking price?
The asking price for this property is $625,000.
What are key features of this property?
This property features: 1,892 SF live‑work property built in 1931; Second‑level two‑bedroom residence with water views and oversized rear deck; First‑floor office layout with lobby, conference area, three offices, and kitchenette


