Gresham Duplex Apartments with Conversion
For Sale
Contact for pricing
110-162 NW 15th Ave., Gresham, OR 97030
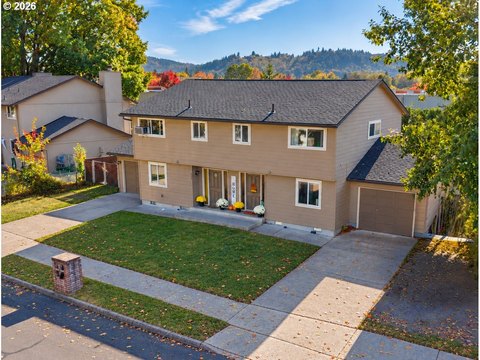
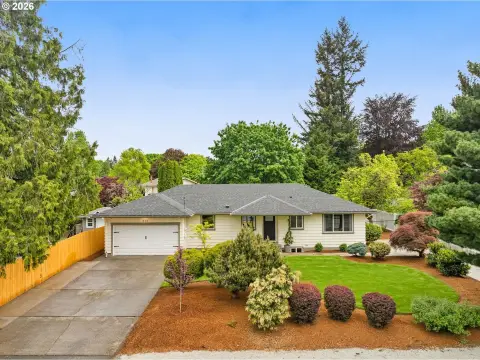
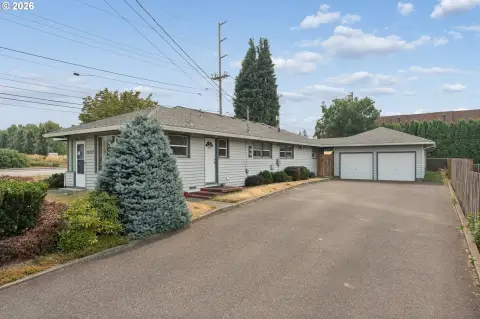
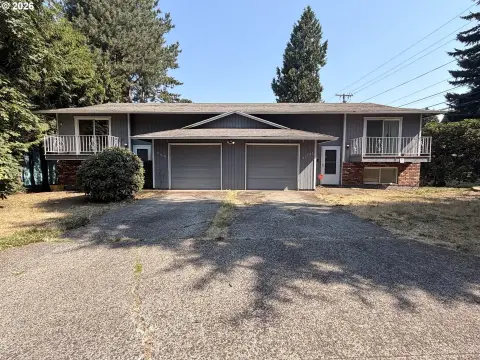
Eleven well-maintained duplex units in a convenient Gresham location.
Property Size19,580 SF
Price / SF$178.75
Days on Market158
Property Features for 110-162 NW 15th Ave.
General Information
Standard status
Active
Size
19,580 SF
Property subtype
Multifamily
Zoning
Gresham DRL-2
Investment Type
Stabilized
Building Details
Year Built
1966
Year Renovated
2022
Buildings
11
Units
22
Tenancy
Multi
Listing Agency:
Think Commercial
Listed By:
Hope Beraka · License #200603056
(503) 847-2722
Source:
Crexi
Added: May 16
Changed: Oct 7
Last Checked: Oct 19 at 7:29AM
Displayed information is deemed reliable but is not guaranteed and should be independently verified. All listing content including descriptions, pricing, images are the copyrighted material of Think Commercial

Ask AI about this property
Review the available facts, identify missing information and prepare questions for the agent.
Investment Insights
Based on property information with market context.
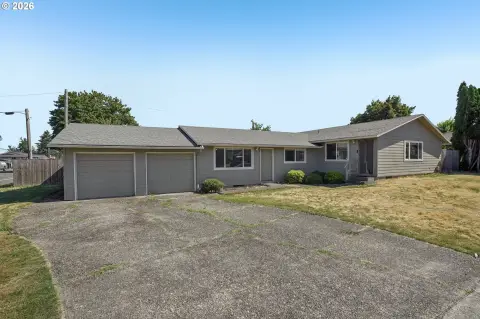
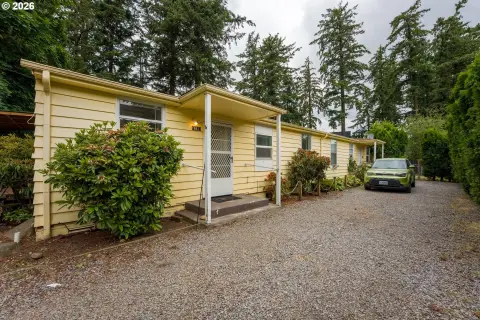
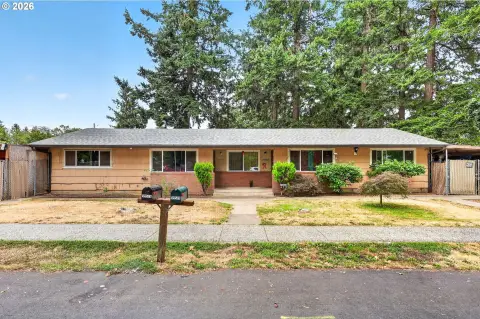
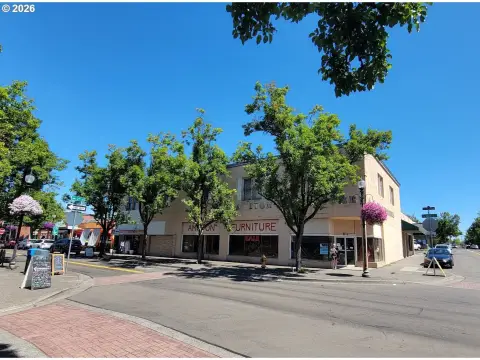
The Fran-Mar Apartments are located at the end of a quiet cul-de-sac in Gresham. This property features 11 duplex units, each offering 890 square feet of living space with 2 bedrooms and 1 bathroom. Each apartment includes dedicated yard space, and spacious living rooms open onto private back patios. Substantial interior and exterior improvements have been made, including the renovation of 13 units. The property is located near Historic Downtown Gresham and Gresham Station, providing easy access to the MAX light rail, multiple bus lines, and a Trader Joe's. A nearby golf course, the Gresham Farmer's Market, and proximity to Mt. Hood offer additional recreation options. The property offers a future condo conversion opportunity, offering investors both stable cash flow and upside potential. The property size is 19580 square feet.
Key Highlights
- Excellent location near Historic Downtown Gresham, Gresham Station, MAX, bus lines, and Trader Joe's.
- Future condo conversion opportunity for significant upside potential.
- Substantial interior and exterior renovations completed on 13 units, reducing near‑term capital needs.
Financial Insights
Estimated NOI and Cap Rate
NOI / Yr
$259,981
Cap Rate
7.43%
Suggested Prices Based on Cap Rates
Cap Rate 5%
$5,199,620
$5.2M
Cap Rate 7%
$3,714,014
$3.7M
Cap Rate 9%
$2,888,678
$2.9M
Market Conditions
NOI Build-Up for 19,580 SF
Gross rent
$387.7K $19.80/SF
− Vacancy
−$16.3K −$0.83/SF
EGI
$371.4K $18.97/SF
− OpEx
−$111.4K −$5.69/SF
NOI
$260.0K $13.28/SF
Area
Gresham, OR
Vacancy
4.20%
Lease Rate
$19.80 /SF/Yr
Expense Ratio
30.00%
Simulate Cap Rate and NOI
Suggested Prices Based on Cap Rates
Cap Rate 5%
$5,199,620
Cap Rate 7%
$3,714,014
Cap Rate 9%
$2,888,678
Alternative Uses
Best Use
Multifamily LT 5
$3.71M
$3.25M – $4.33M
NOI $259,981 @ 7.0% cap · market cap 7.43%
Second Best
Apartment 5plus
$3.34M
$2.92M – $3.90M
NOI $233,717 @ 7.0% cap · market cap 6.68%
Theoretical Best
Office A
$4.47M
$3.92M – $5.22M
NOI $313,202 @ 7.0% cap · market cap 8.95%
Zoning and permitted uses should be independently verified with authorities.
How Realmo checks its estimates
Location Intelligence
Trade Area within ½ mile
1,760
Businesses Nearby
Explore this area
Business Placement
Demographics for 97030, OR
39,492
Population
16,500
Households
2.4
Avg Household Size
37
Median Age
21%
College-Educated
88%
High-School Grad
7.5 sq mi
ZIP Area
5,266
Density / Sq Mi
$61,793
Median Household Income
$40,352
Median Earnings
$1,604
Median Rent
$418,100
Median Home Value
Market
Vacancy Rate% for Multifamily in West region




Frequently Asked Questions
What type of property is this?
Duplex - Eleven well-maintained duplex units in a convenient Gresham location.
Where is this duplex located?
The property is located at 110-162 NW 15th Ave. Gresham, OR.
What is the asking price?
The asking price for this property is $3,500,000.
What are key features of this property?
This property features: Excellent location near Historic Downtown Gresham, Gresham Station, MAX, bus lines, and Trader Joe's.; Future condo conversion opportunity for significant upside potential.; Substantial interior and exterior renovations completed on 13 units, reducing near‑term capital needs.


