Duplex-Style Property with In-Law
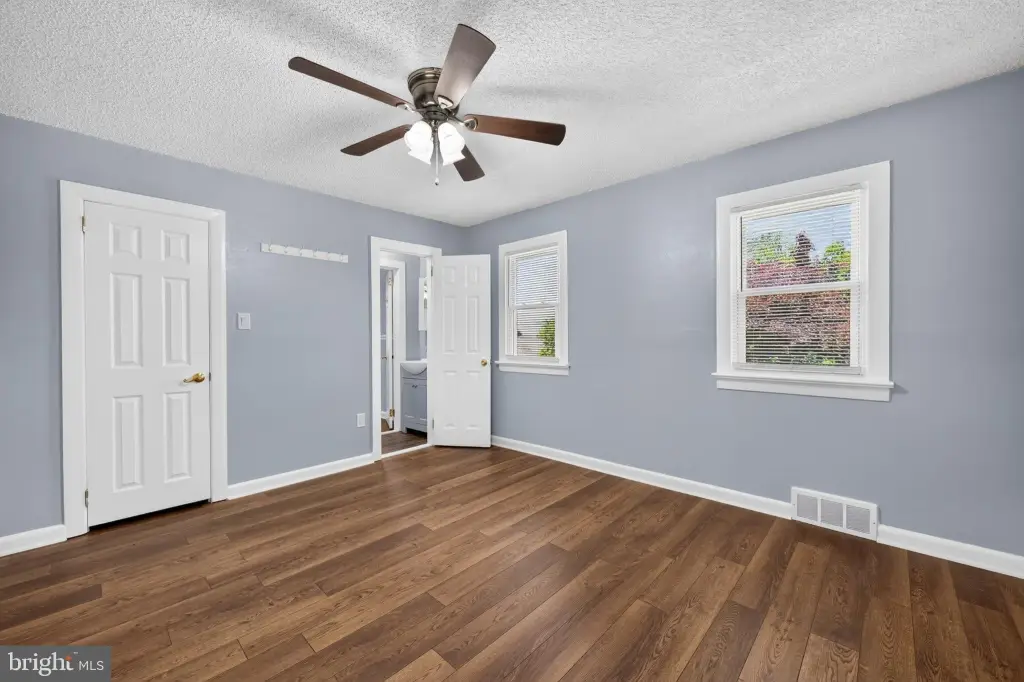
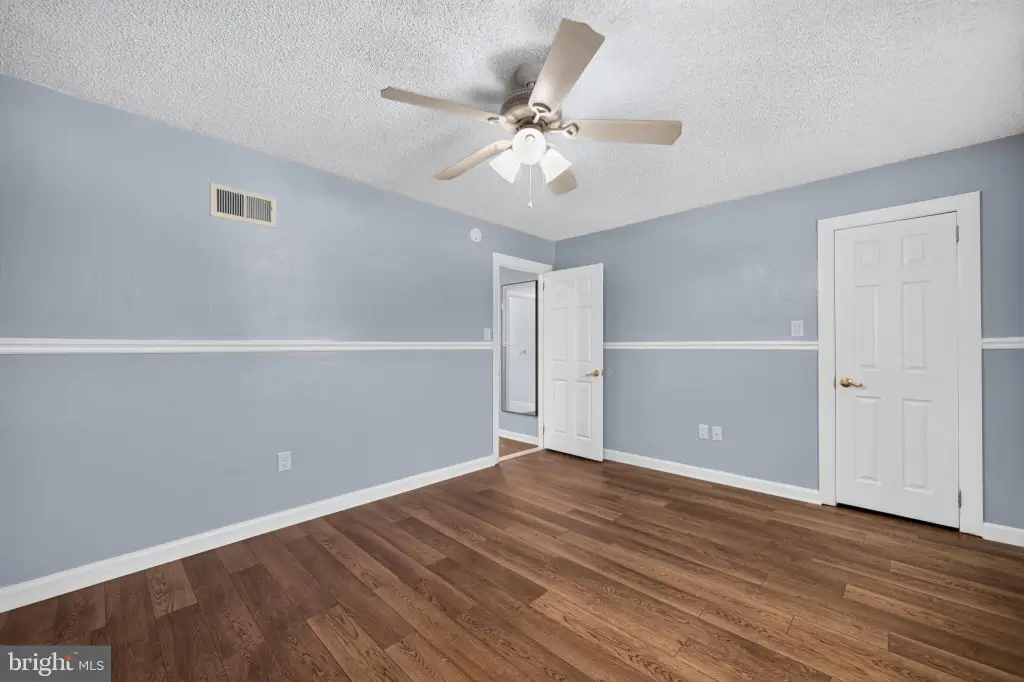
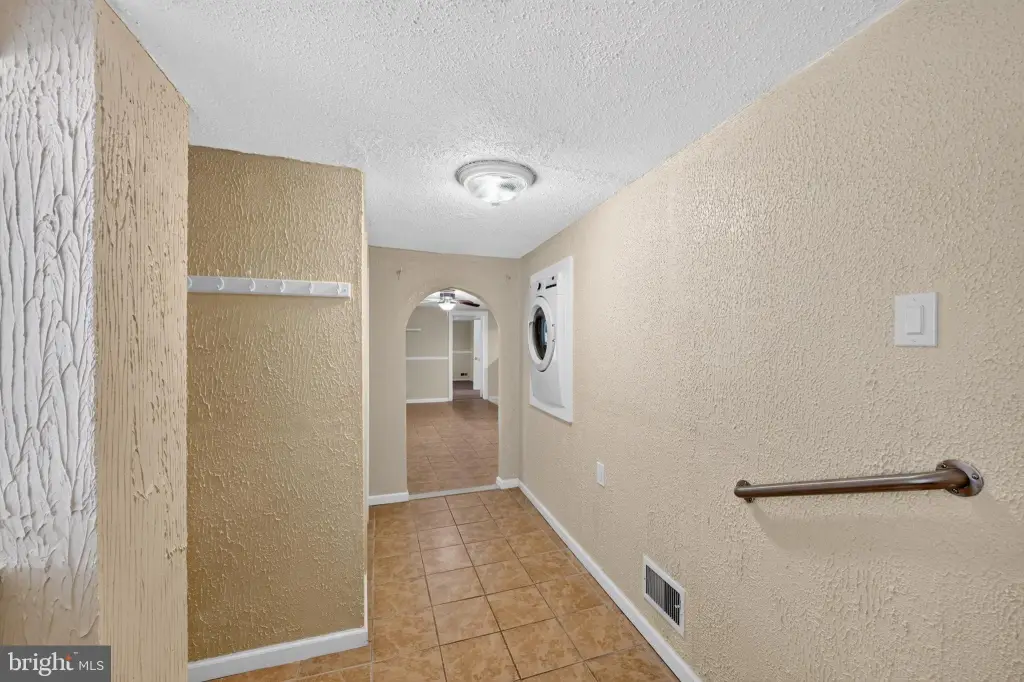
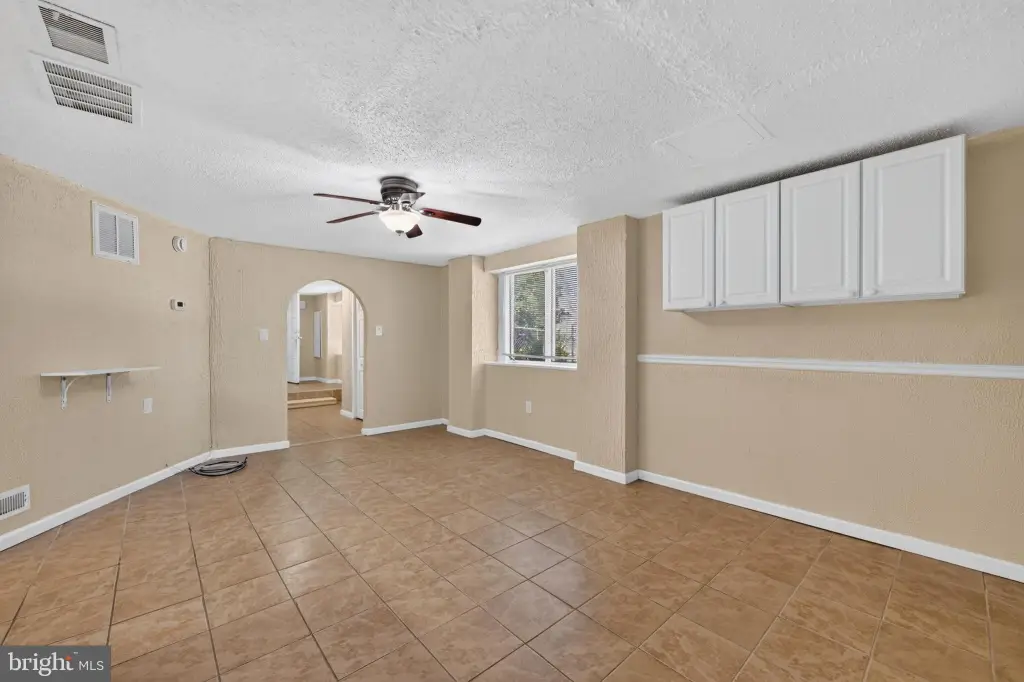
For Sale
Under Contract
$689,900
11 WILLIAMS Lane, Yardley, PA 19067
Multi-Family, YARDLEY, PA
Property Size3,092 SF
Lot Size1.02 Acres
Price / SF$223.12
Days on Market76
Property Features for 11 WILLIAMS Lane
General Information
Property type
Residential Multi Family
Property subtype
Duplex
Rooms
Family Room, Basement
Parking
2
Parking features
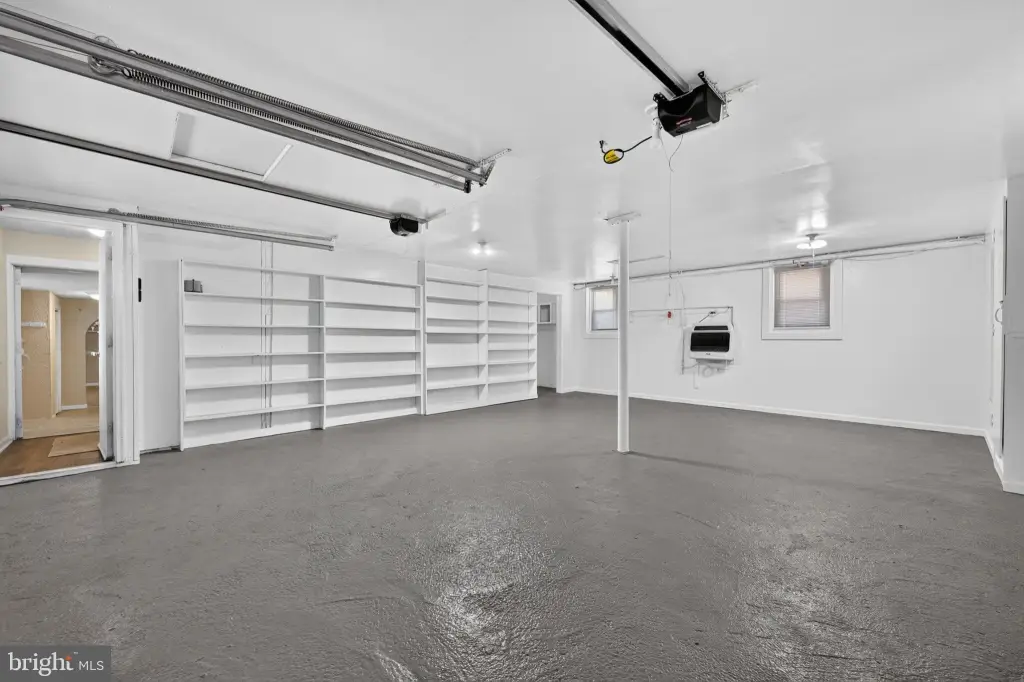
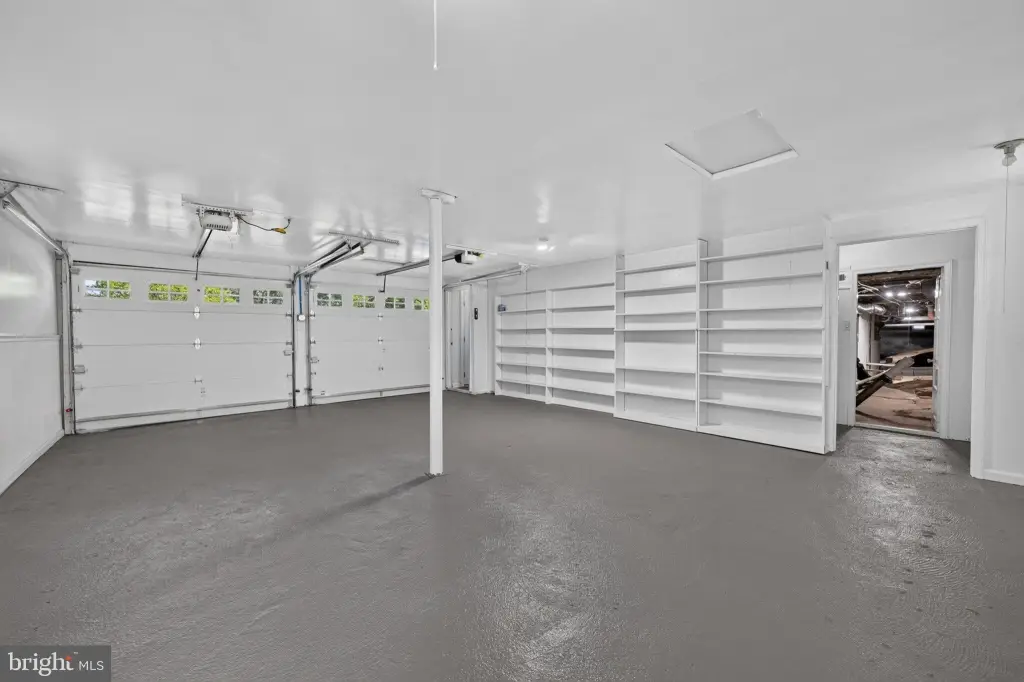
Driveway, Garage - Attached
Pool private
1
Interior features
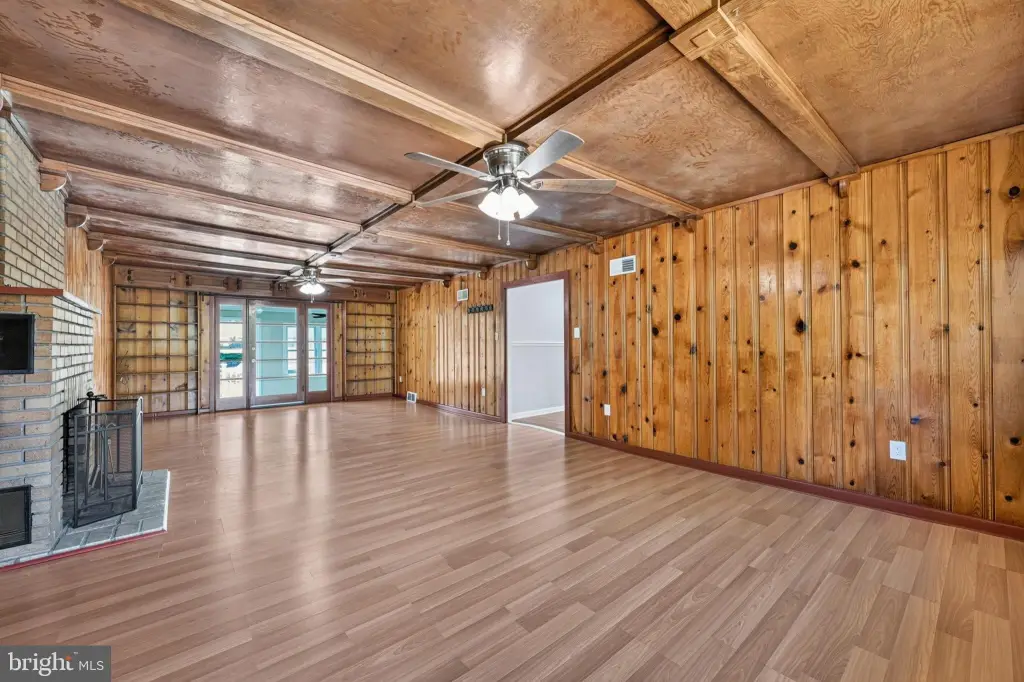
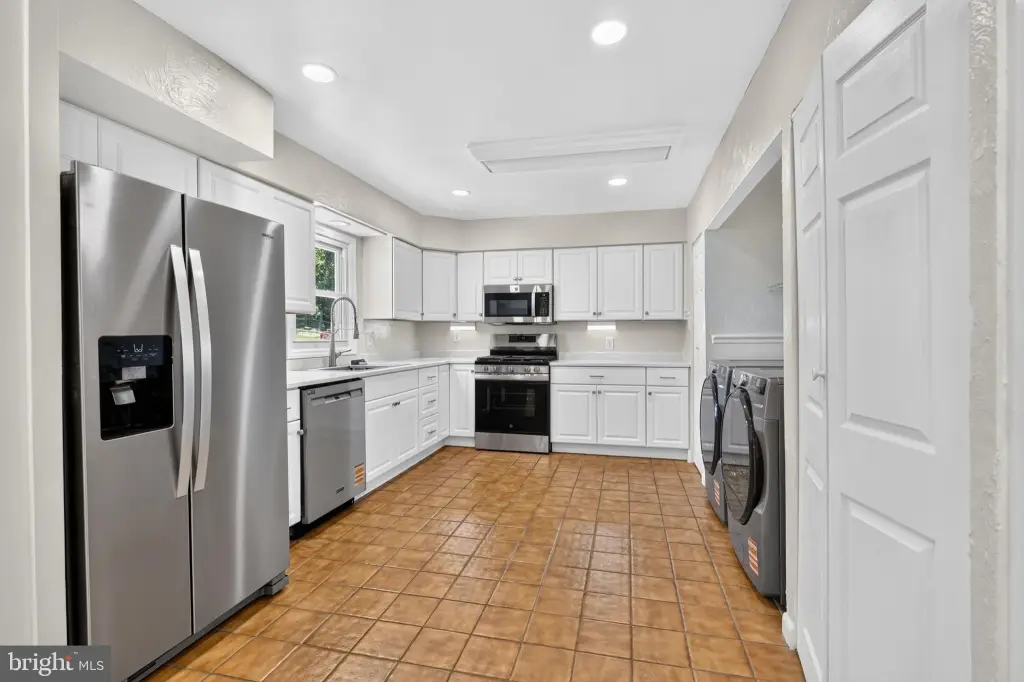
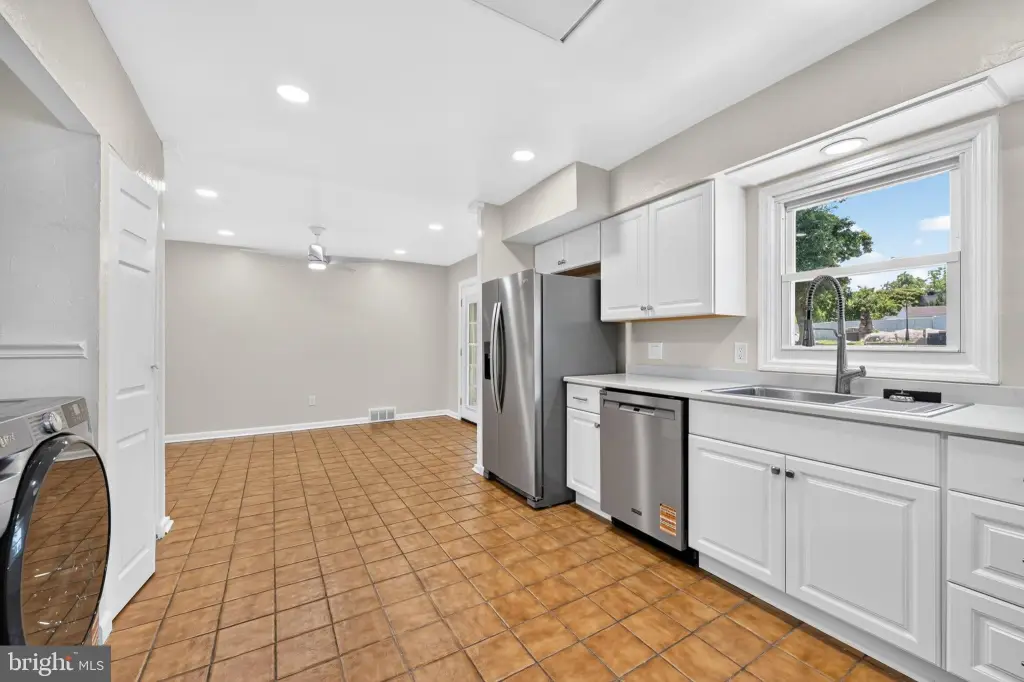
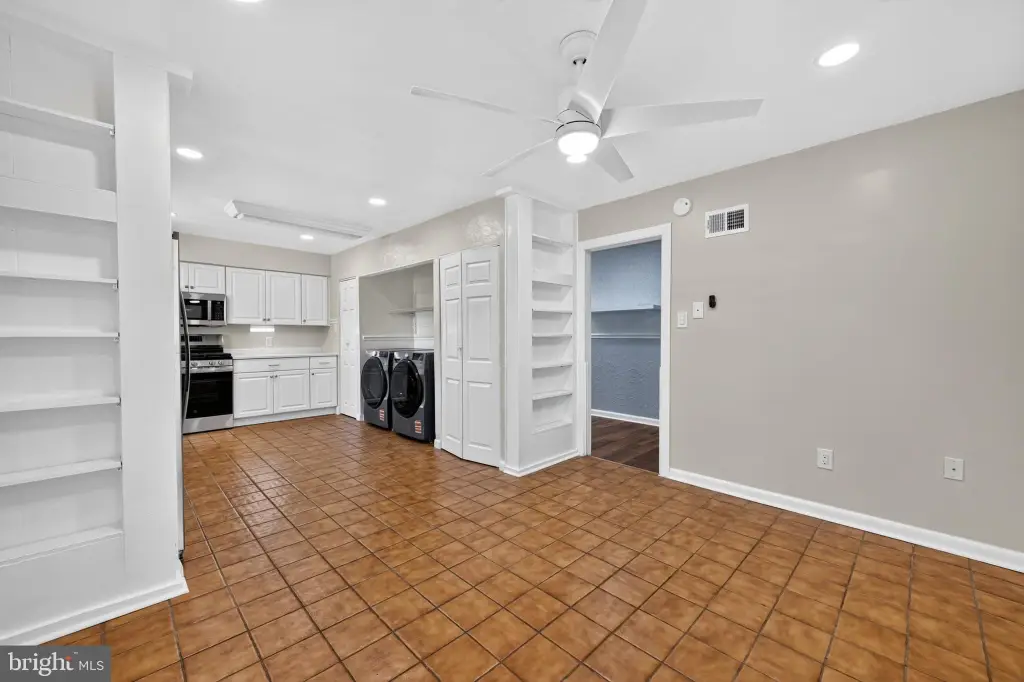
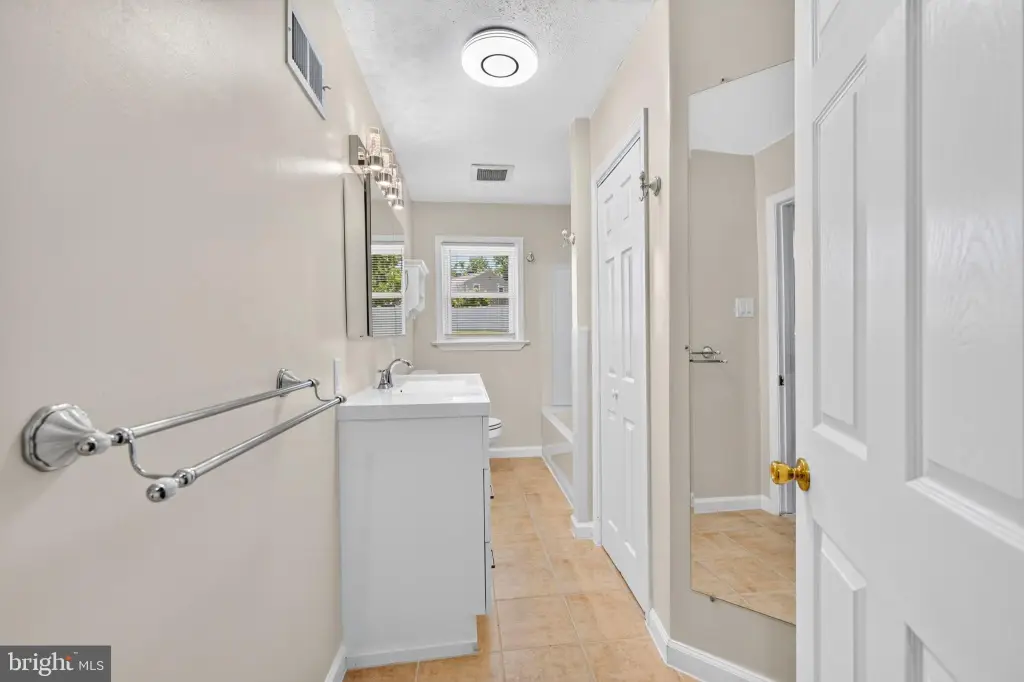
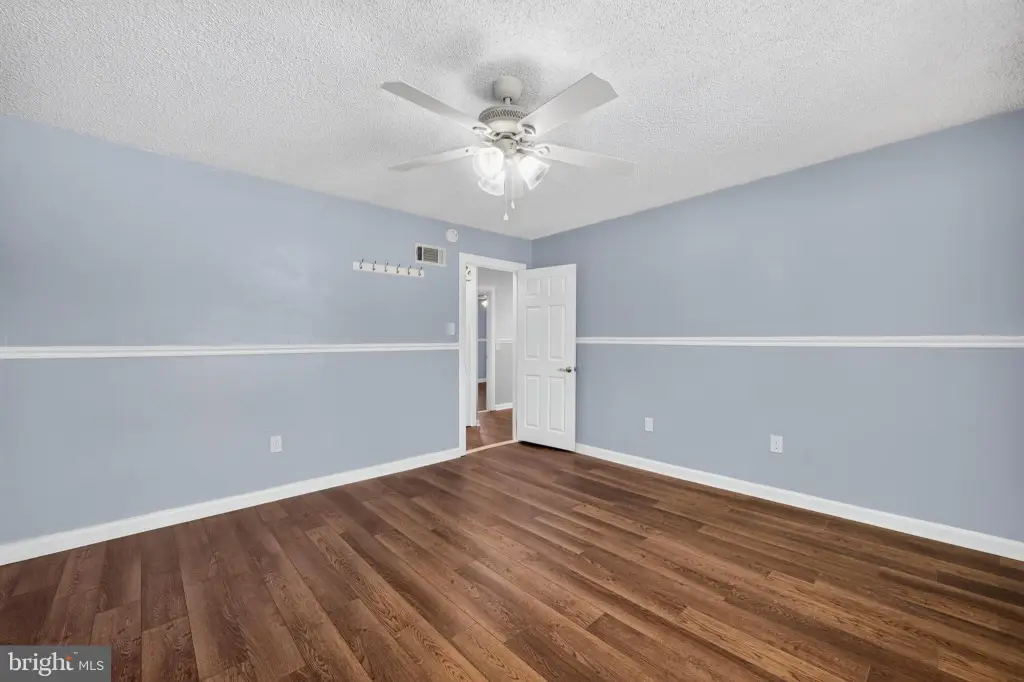
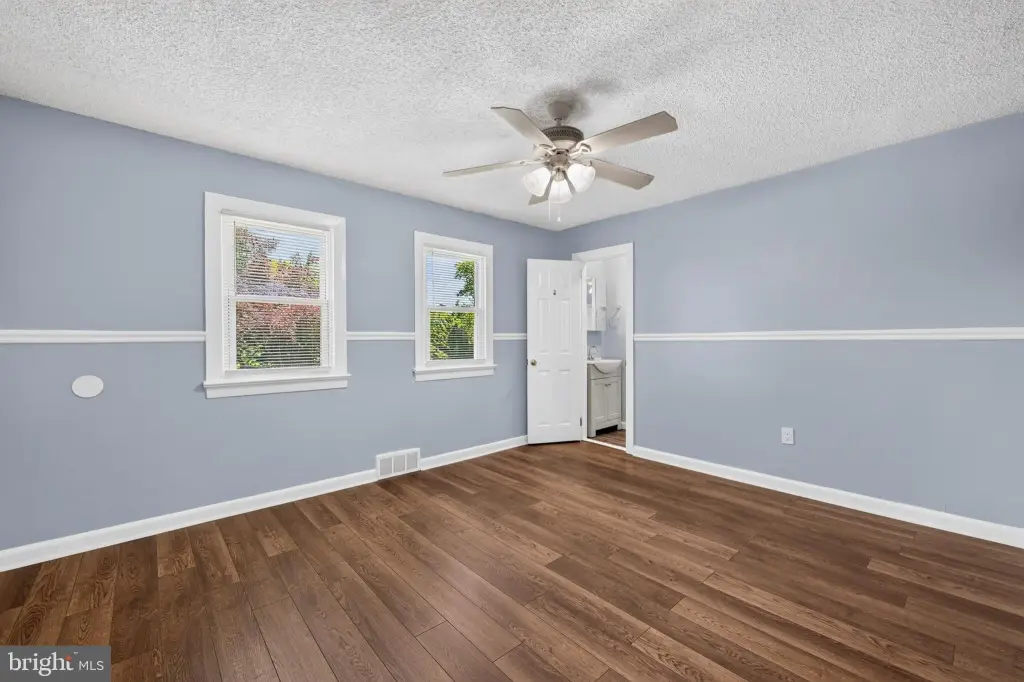
2nd Kitchen, Bathroom - Stall Shower, Bathroom - Tub Shower, Carpet, Ceiling Fan(s), Chair Railings, Entry Level Bedroom, Family Room Off Kitchen, Kitchen - Eat-In, Upgraded Countertops, Recessed Lighting
Fireplace
1
Appliances
Built-In Microwave, Dishwasher, Dryer, Oven/Range - Gas, Refrigerator, Stainless Steel Appliances, Washer, WaterHeater
Subdivision
NONE AVAILABLE
Elementary school
ROOSEVELT
Middle school
PENNWOOD
High school
PENNSBURY
Elementary school district
PENNSBURY
Middle school district
PENNSBURY
High school district
PENNSBURY
Standard status
Active Under Contract
Size
3,092 SF
Lot size
1.02 Acres
Taxes and HOA fees
Tax Annual Amount
9207
Utilities
Heating system
Forced Air
Cooling system
Central Air
Amenities
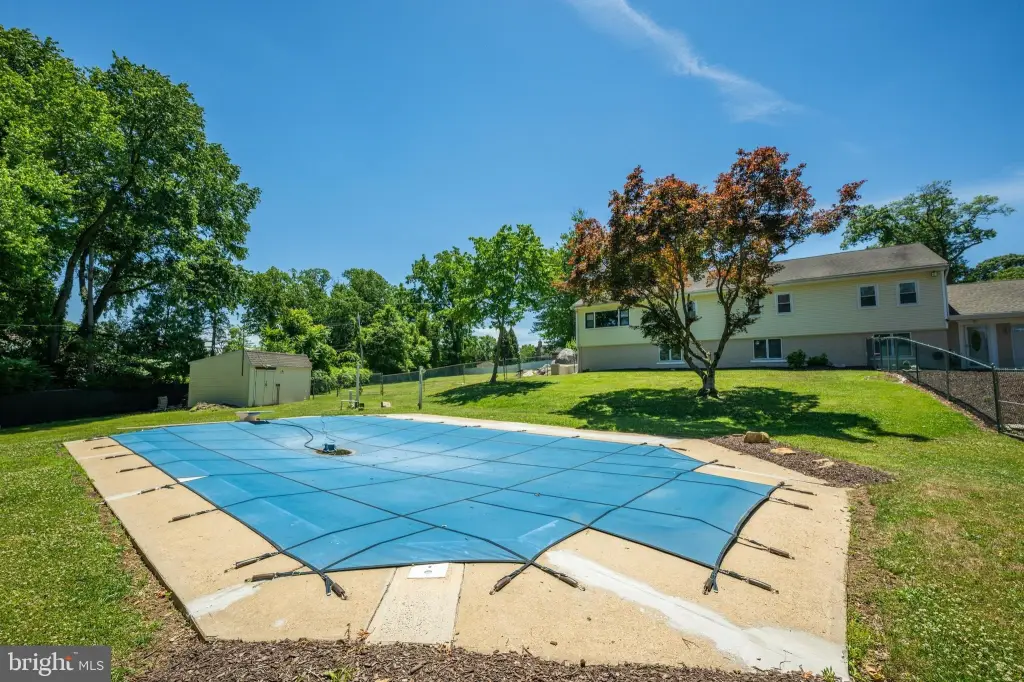
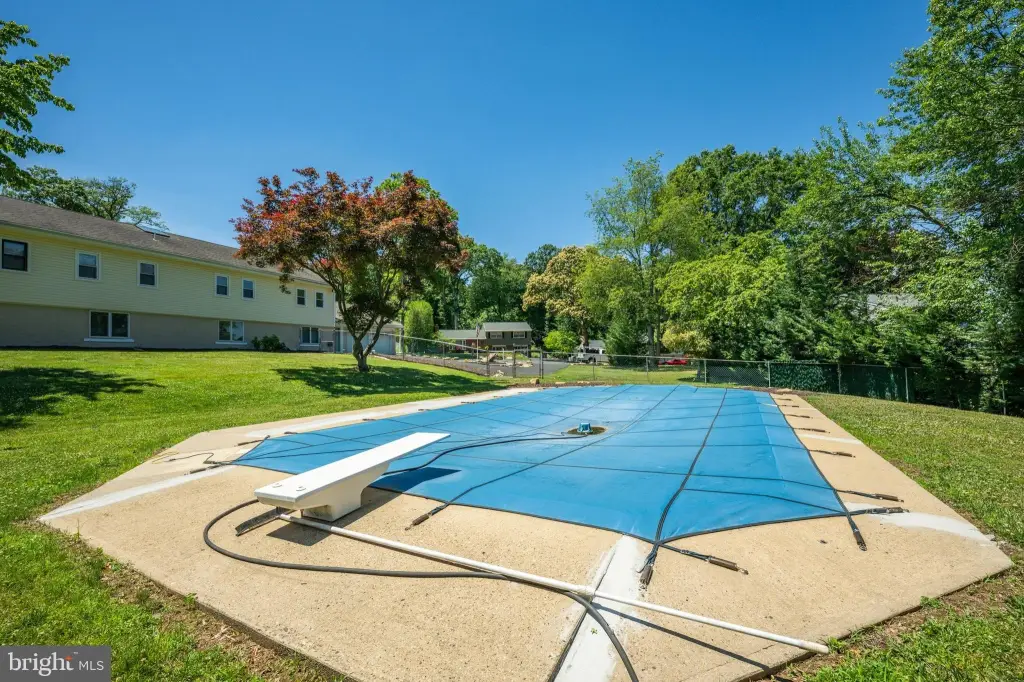
in-ground pool
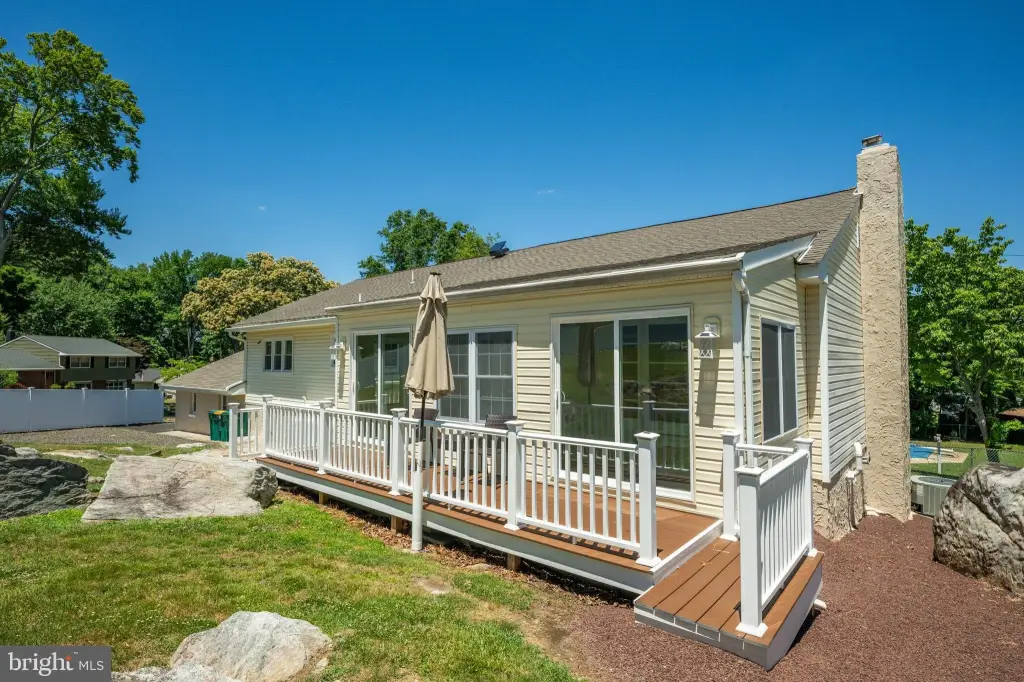
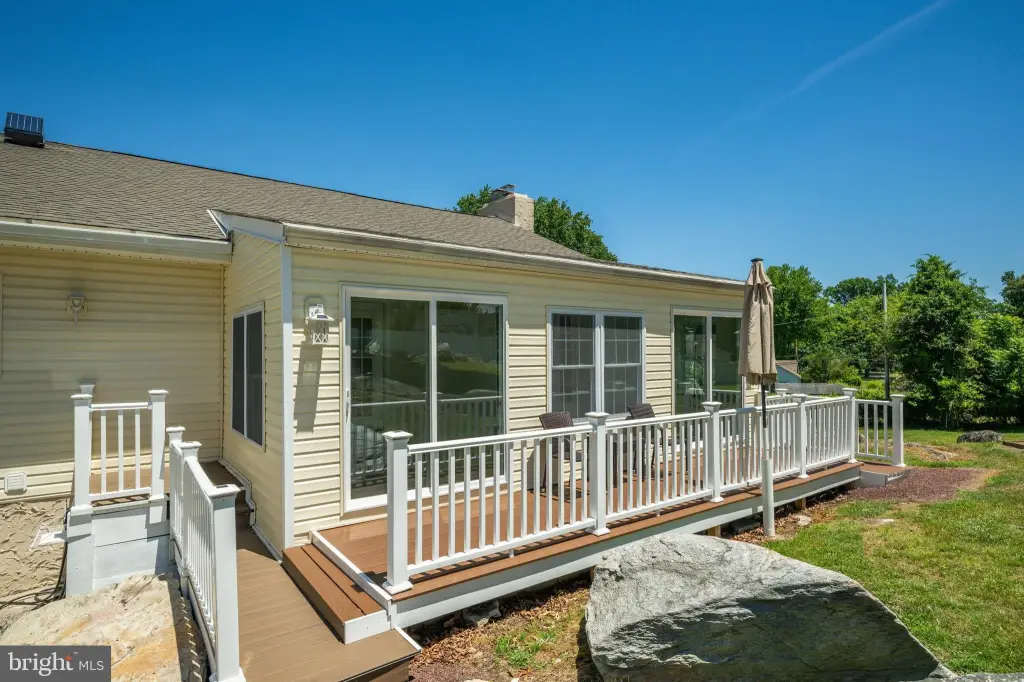
Trex deck
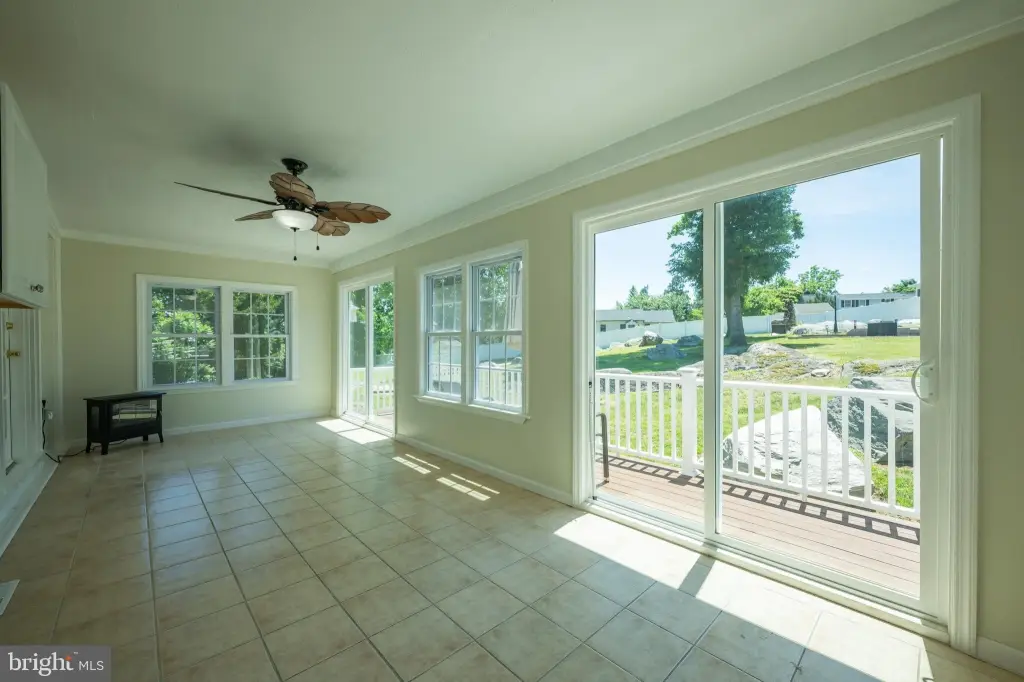
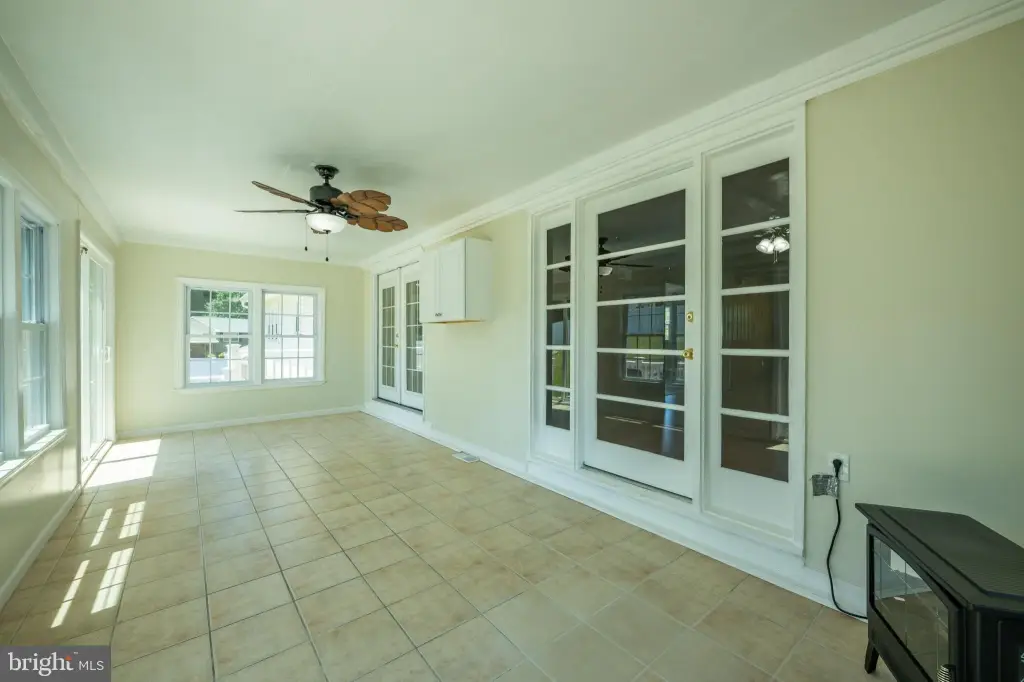
sun porch
fire pit
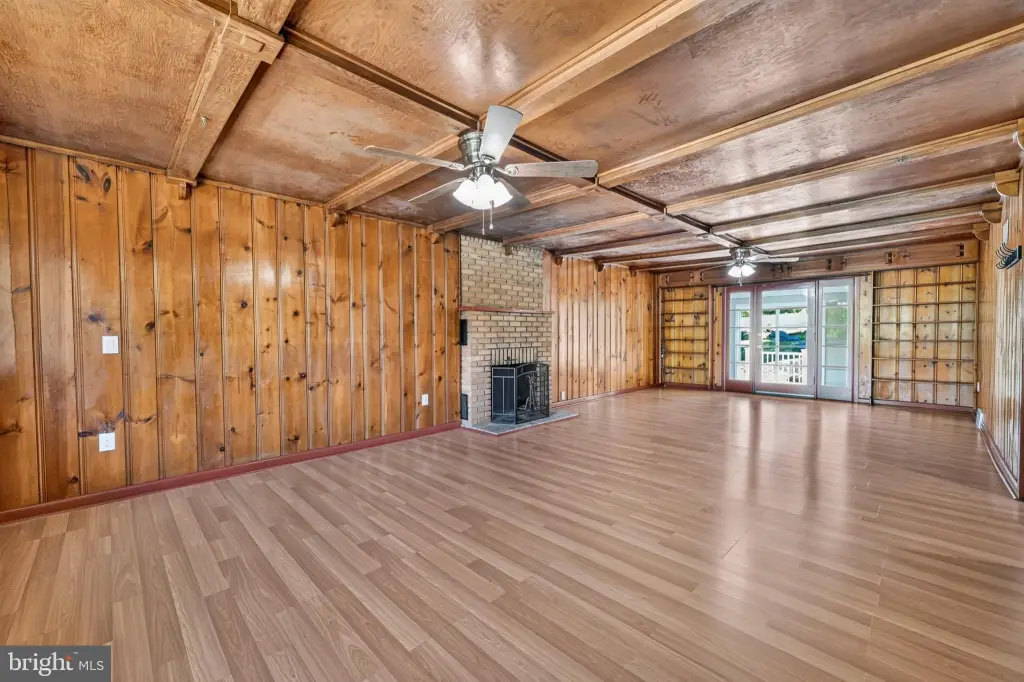
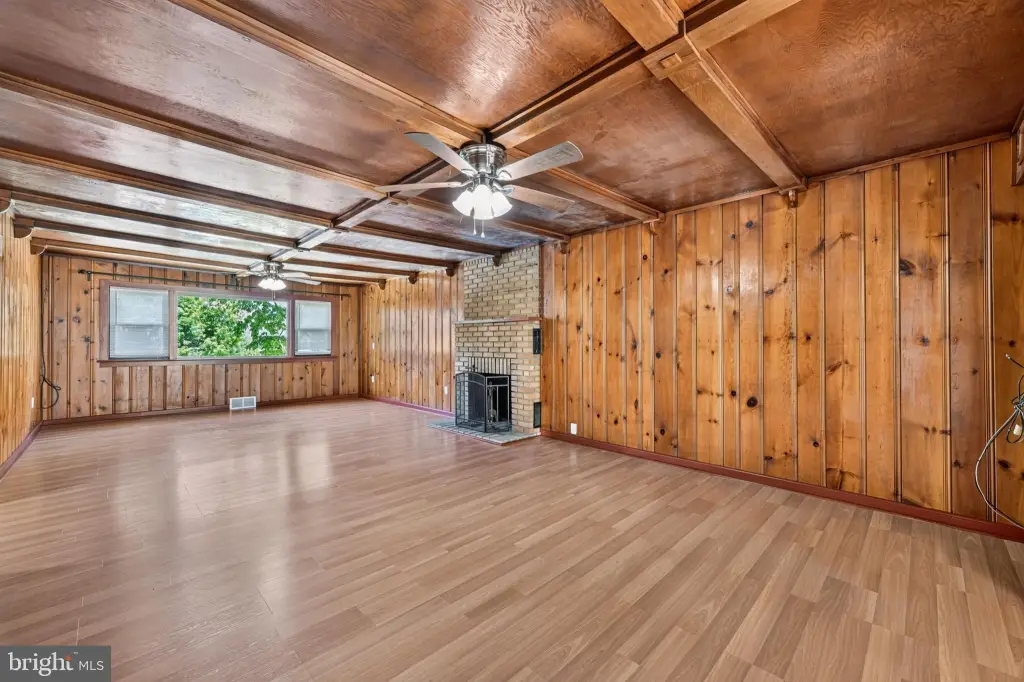
wood-burning fireplace
Building Details
Year built
1952
Floors in Building
2
Number of units
2
Building materials
Frame
Architectural style
Other
Listing Agency:
Keller Williams Real Estate-Langhorne · Keller Williams Realty
(215) 757-6100
Listed By:
Kimberly Rock · License #RS308814
(215) 650-7007
Added: Aug 3
Changed: Oct 16
Last Checked: Oct 17 at 4:06PM
MLS# PABU2126506
Copyright © 2026 Bright MLS. All rights reserved. All information provided by the listing agent/broker is deemed reliable but is not guaranteed and should be independently verified.

Ask AI about this property
Review the available facts, identify missing information and prepare questions for the agent.
Investment Insights
Based on property information with market context.
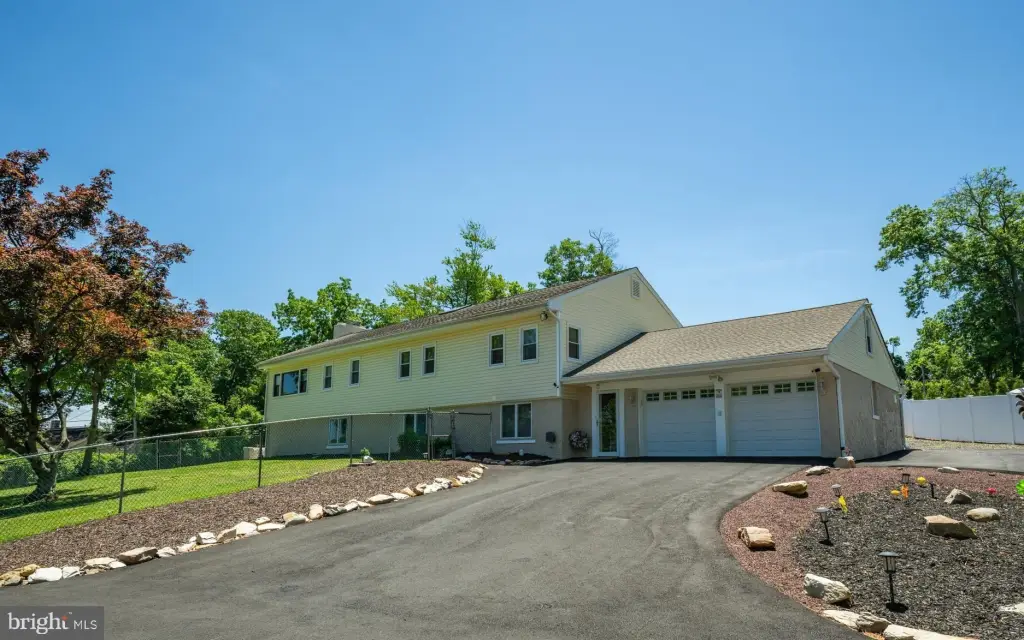
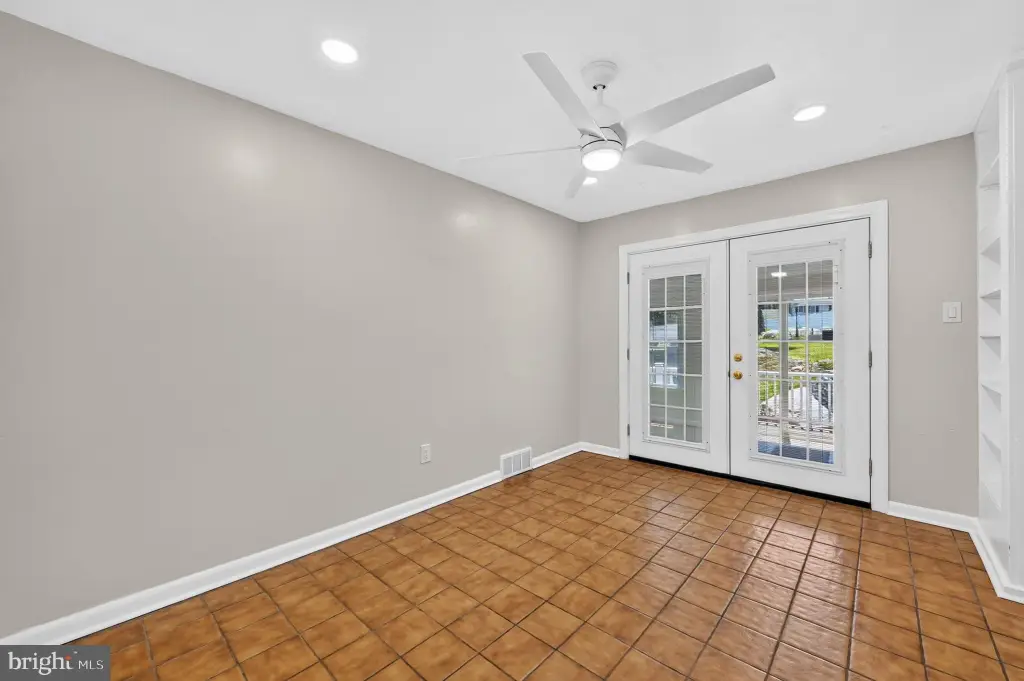
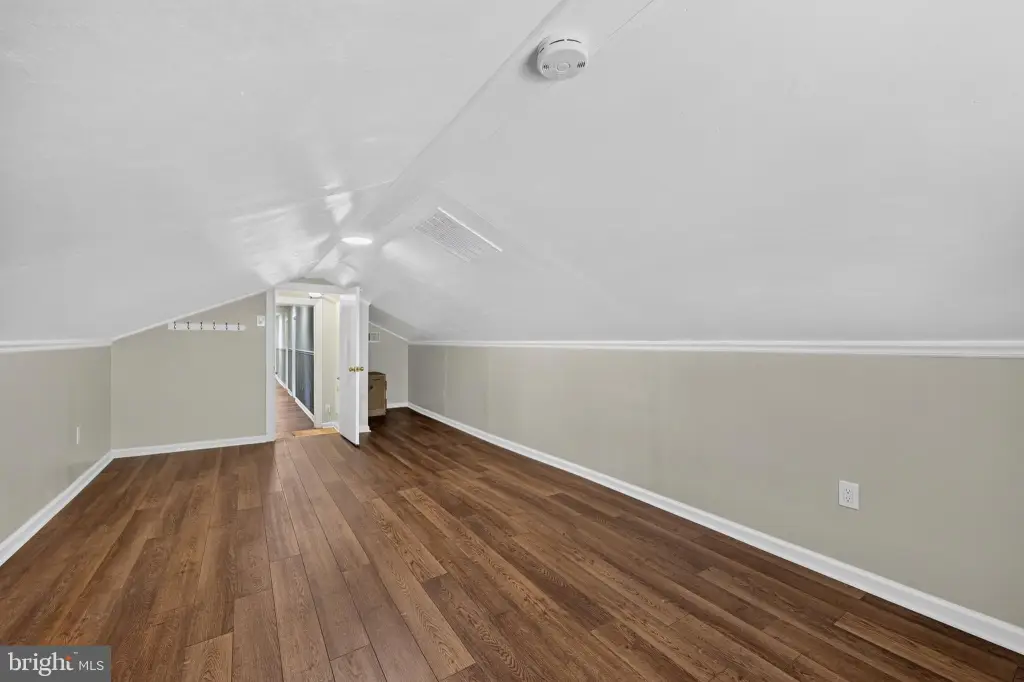
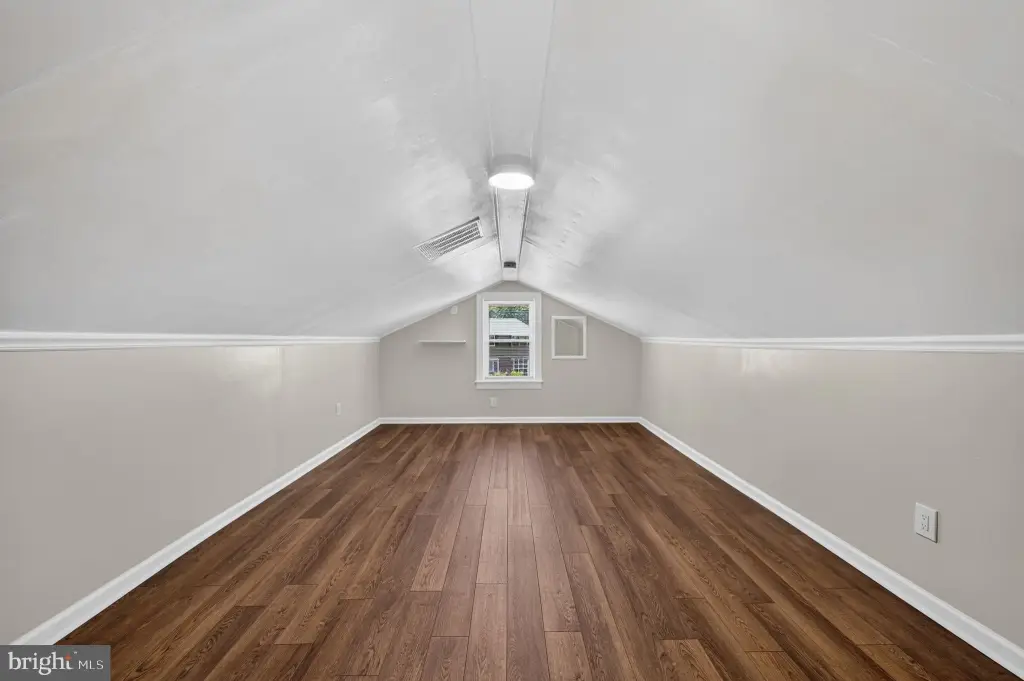
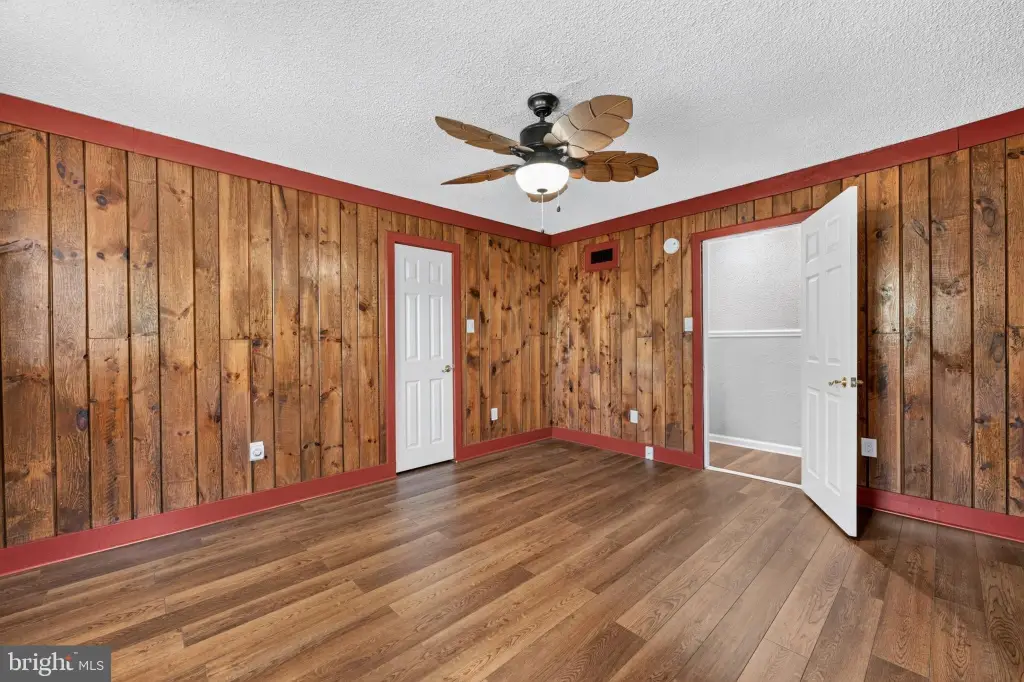
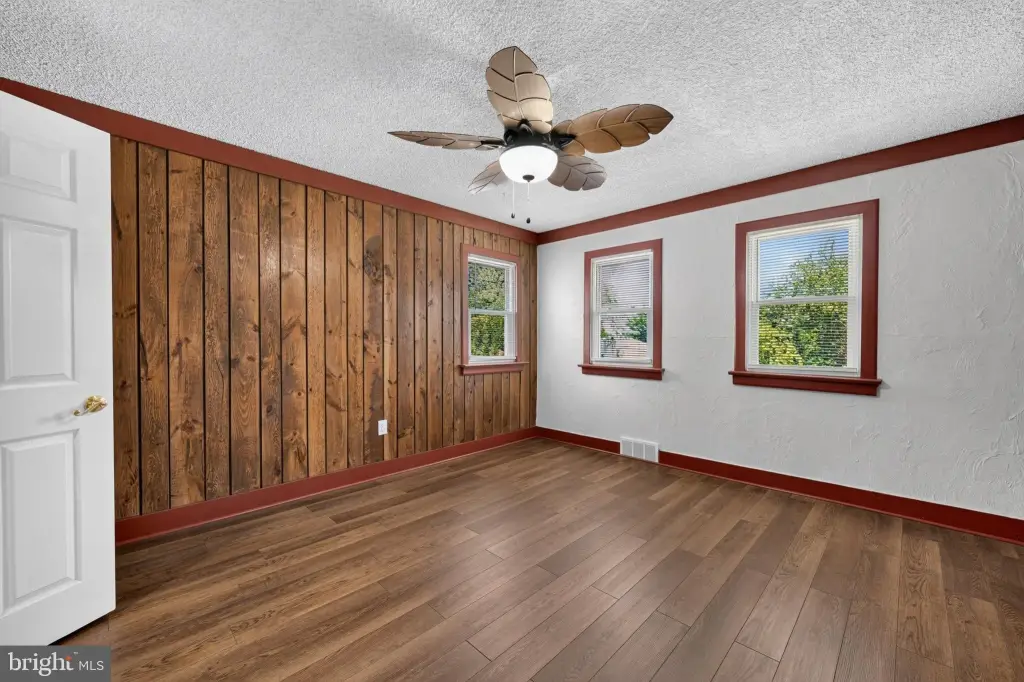
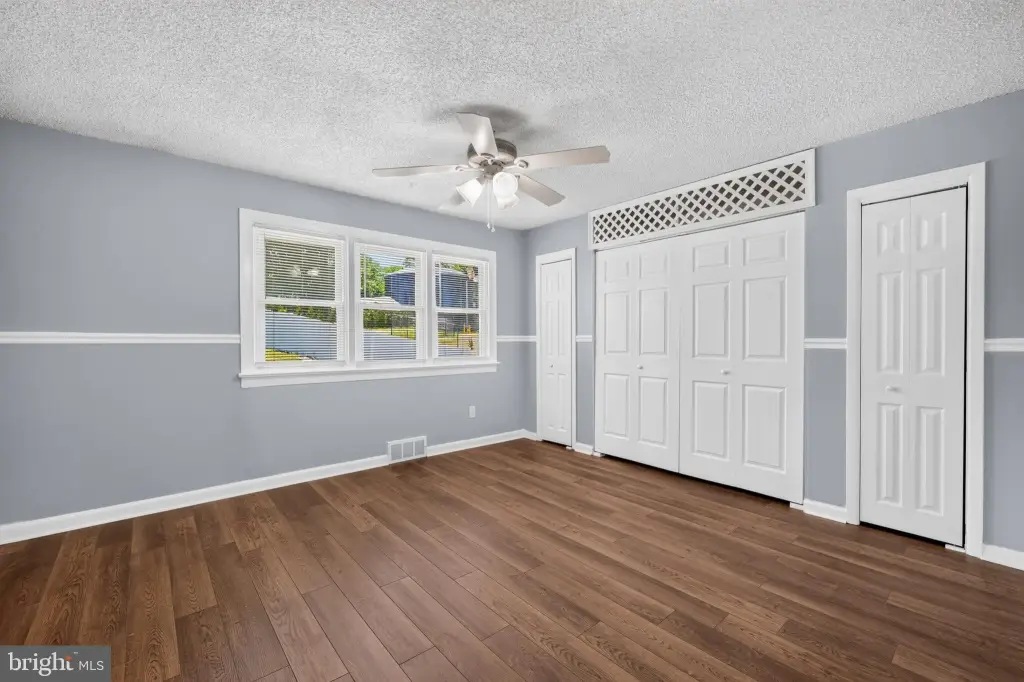
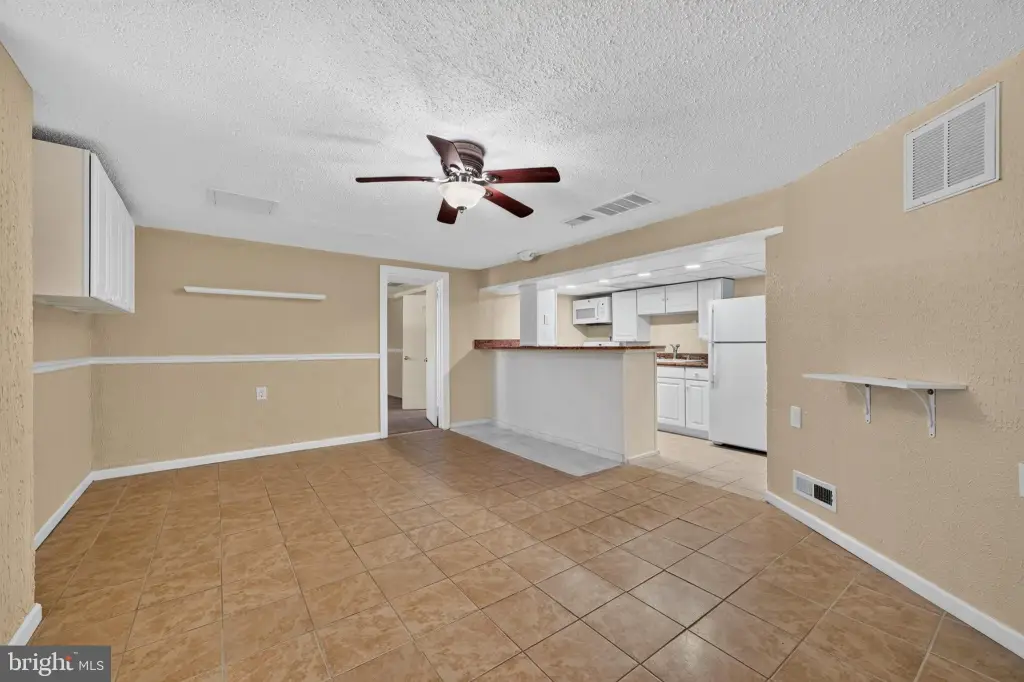
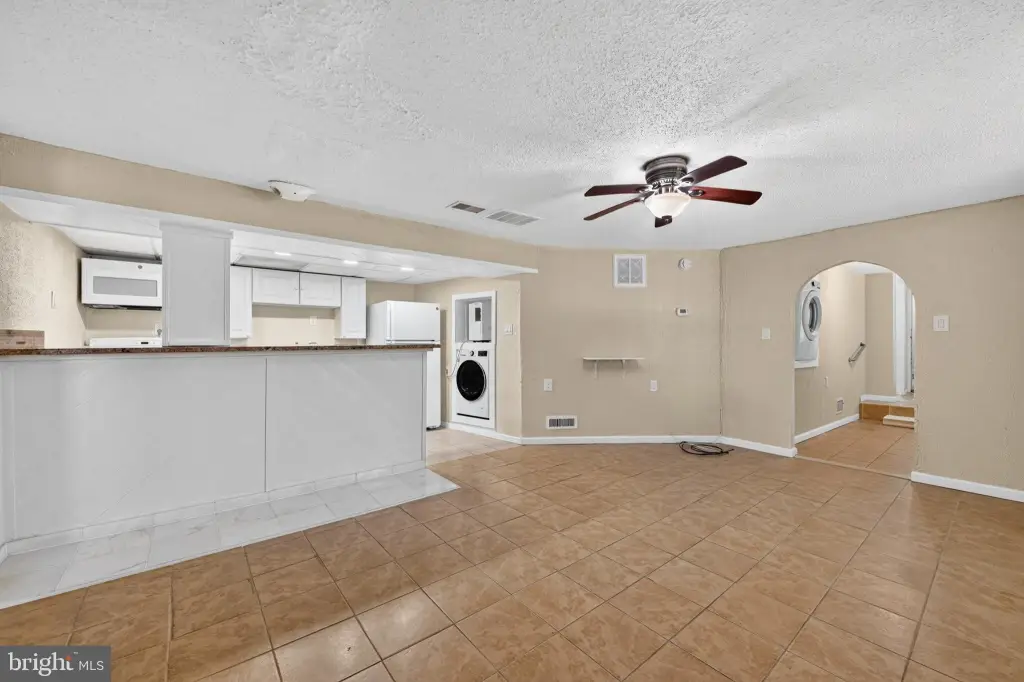
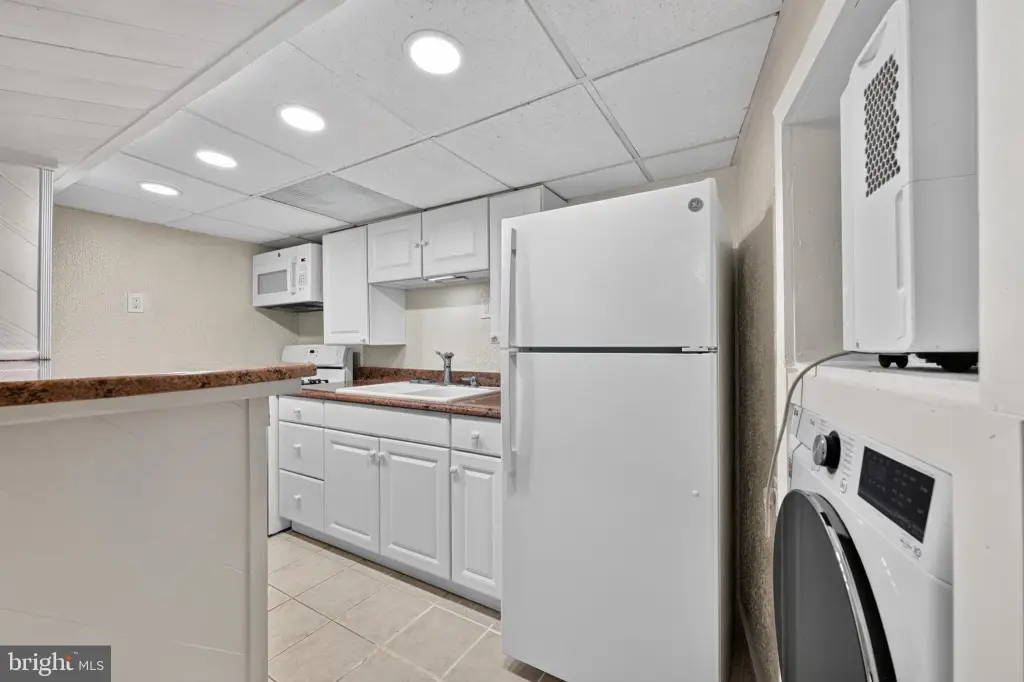
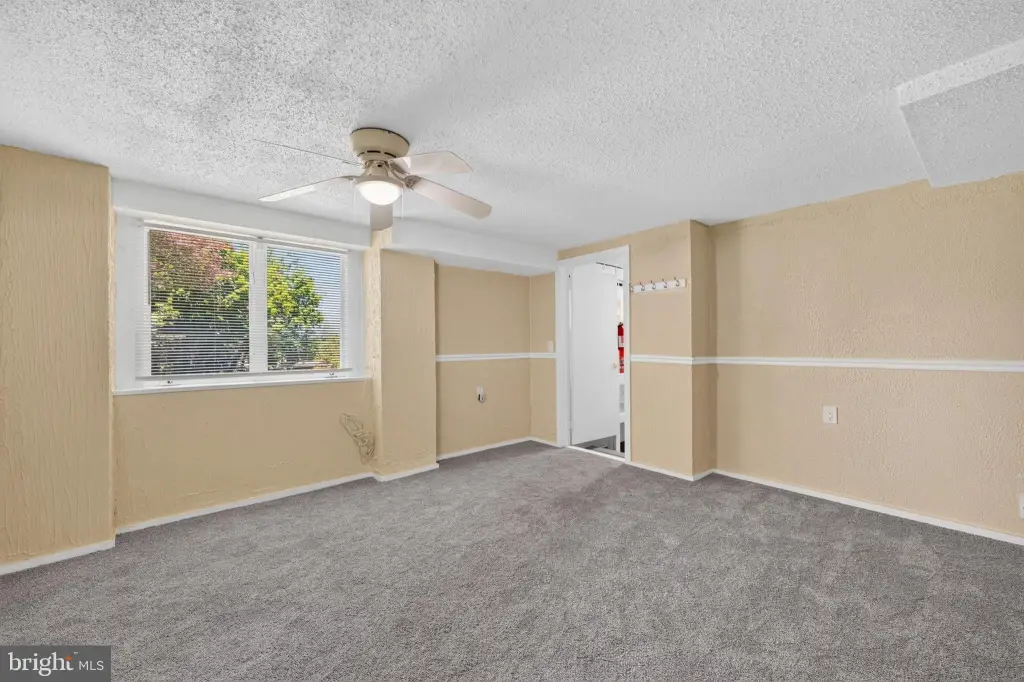
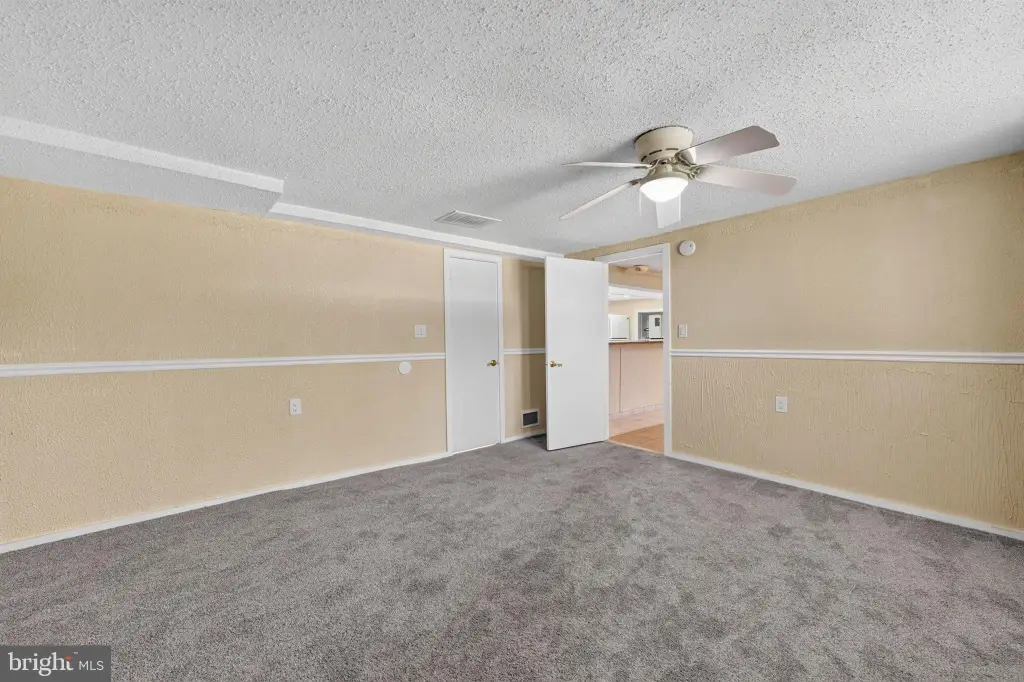
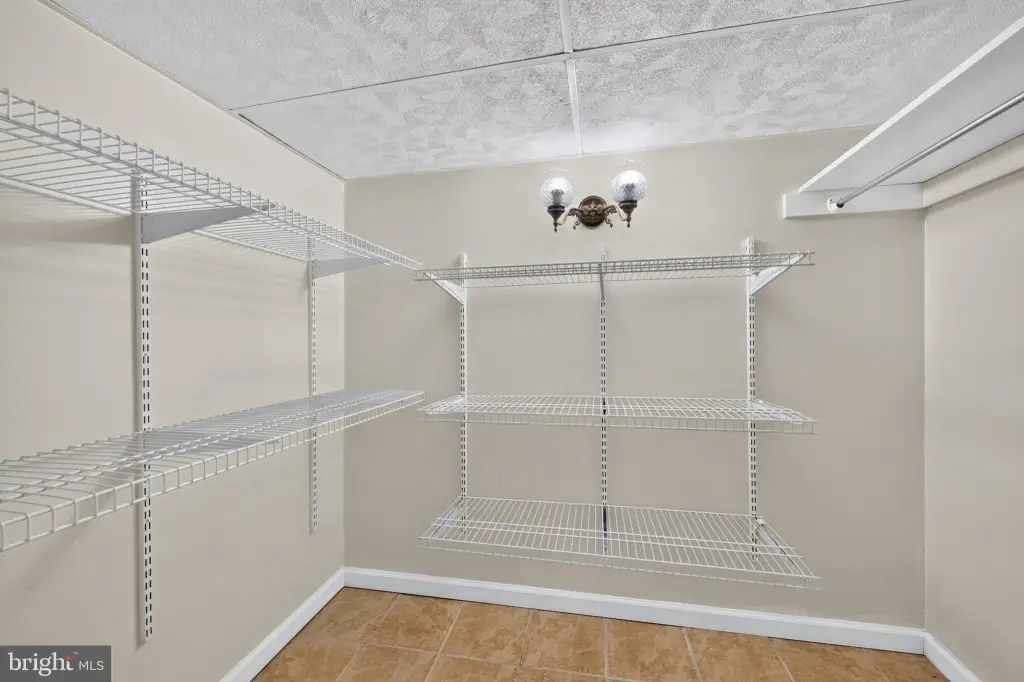
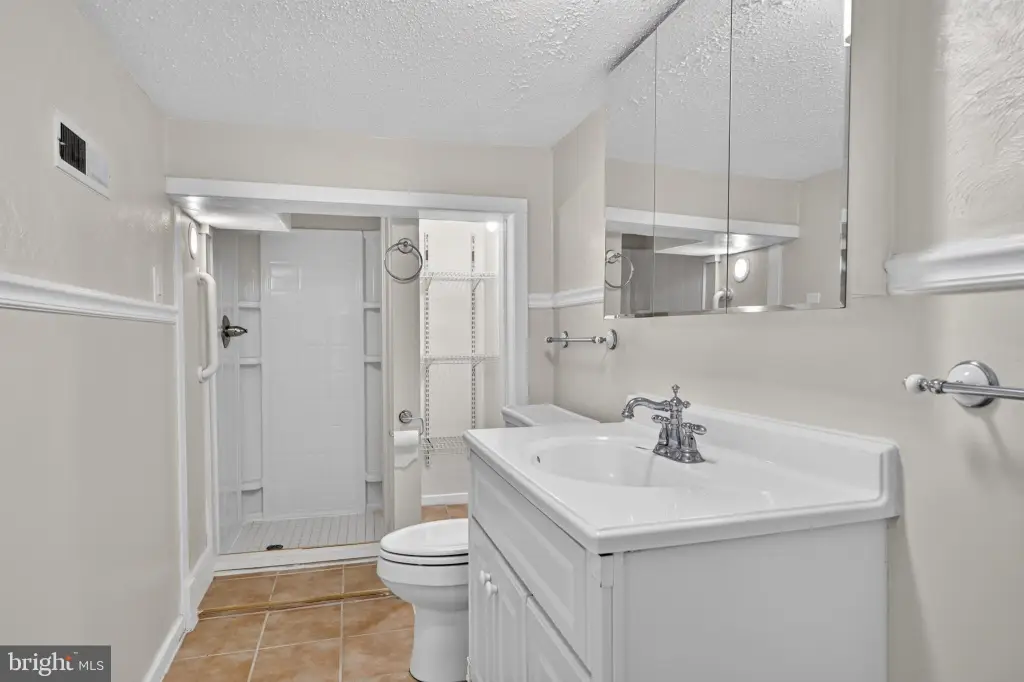
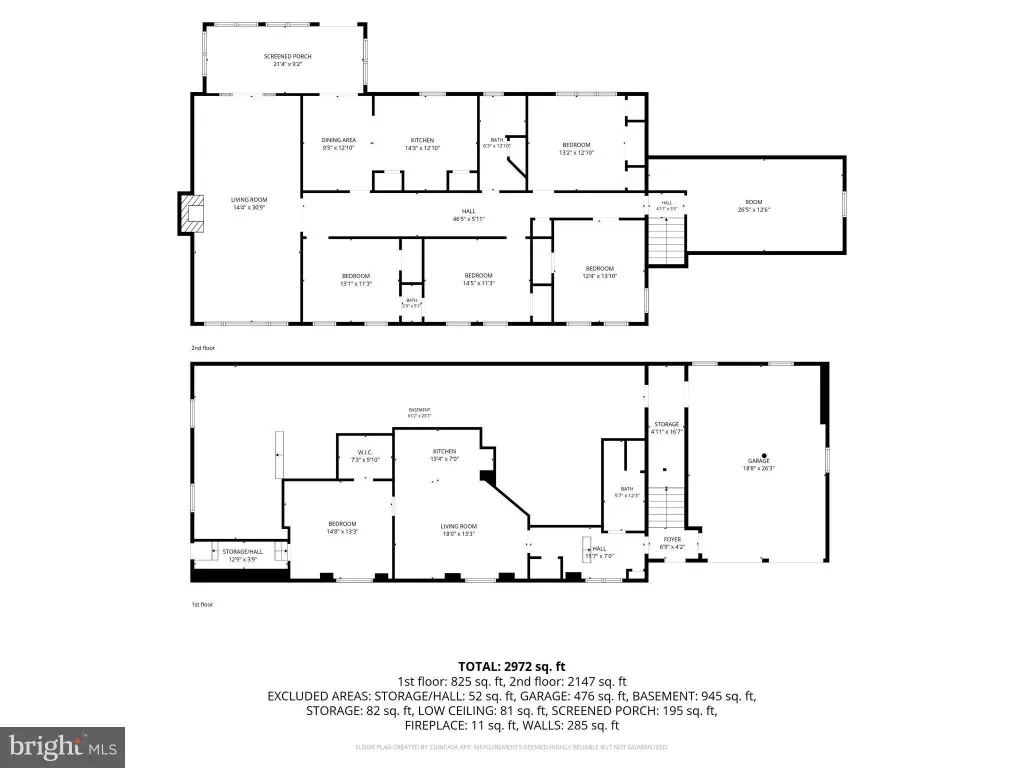
This 3,092-square-foot bi-level residence includes five bedrooms and a separate lower-level suite with its own entrance, living room, kitchenette, bedroom, full bathroom, washer, and dryer. The main living area offers four bedrooms, a bonus room, a family room with built-in shelving and a wood-burning fireplace, plus an updated eat-in kitchen with new cabinetry, Corian countertops, and new appliances. A window-lined sun porch connects to the living areas and provides access to the outdoor space.
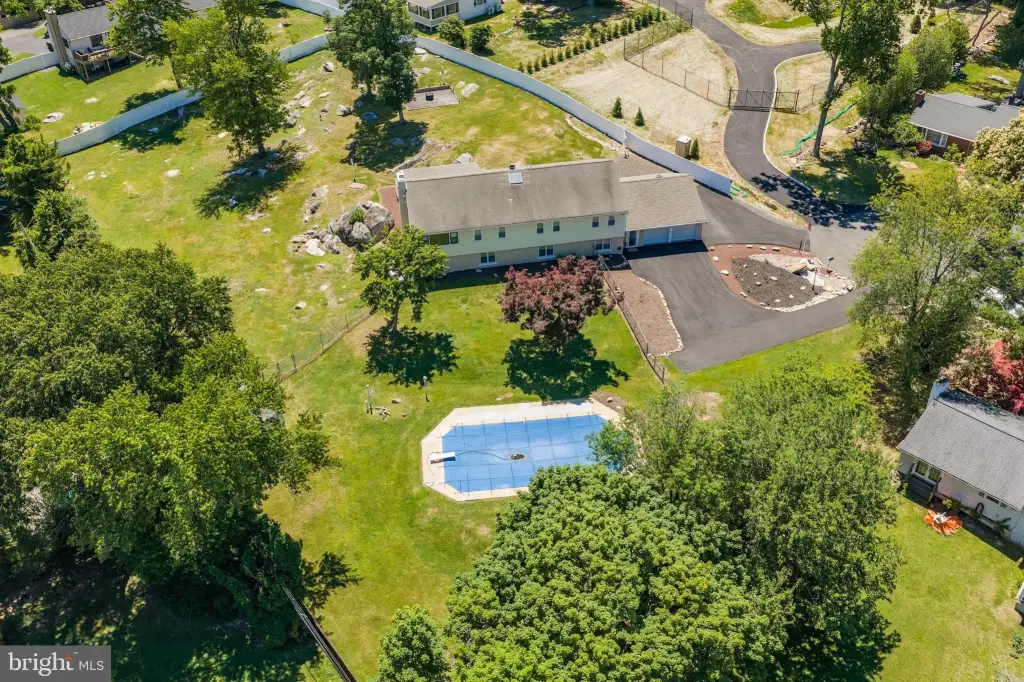
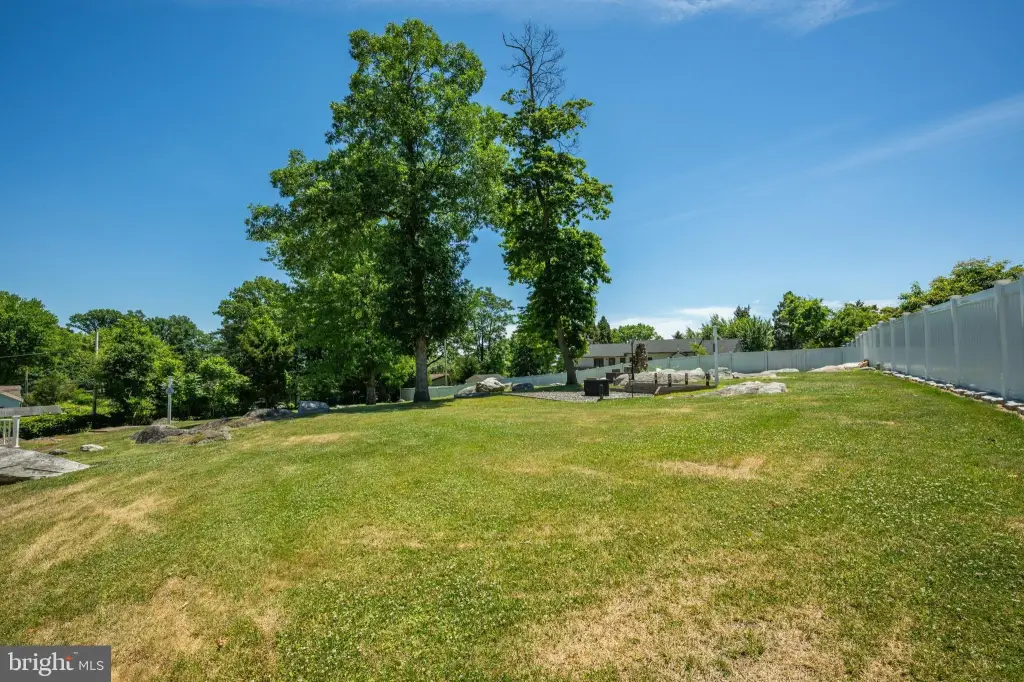
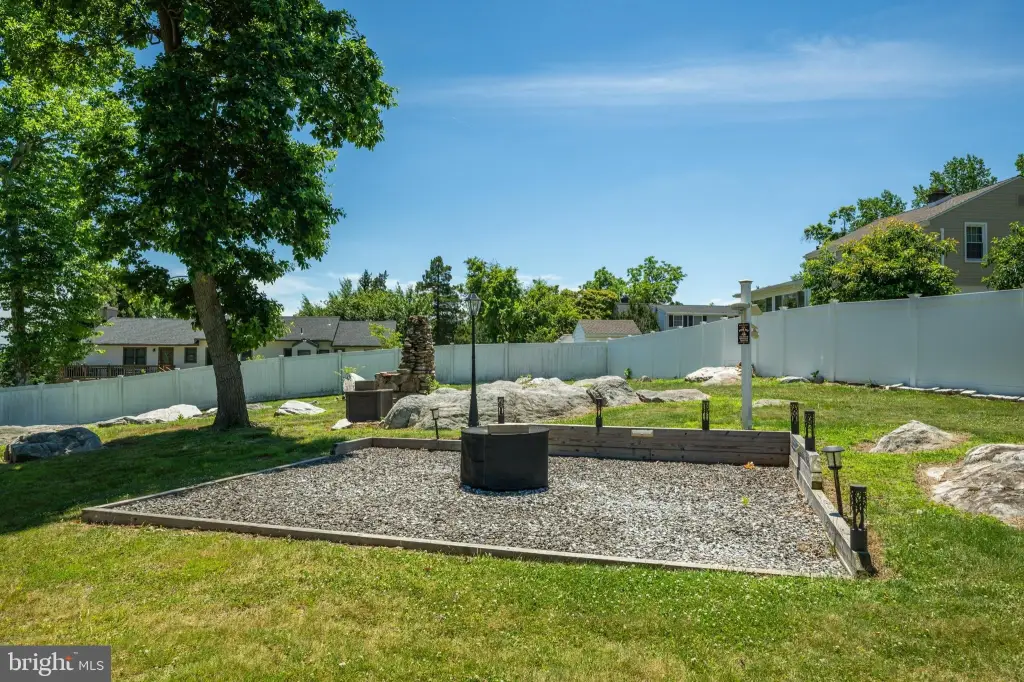
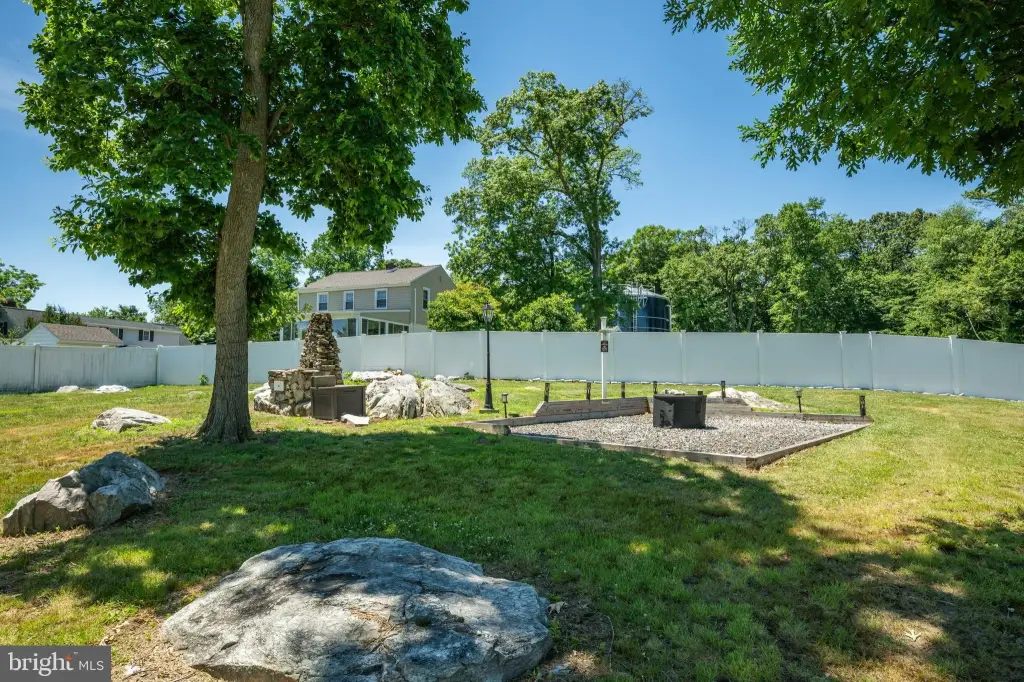
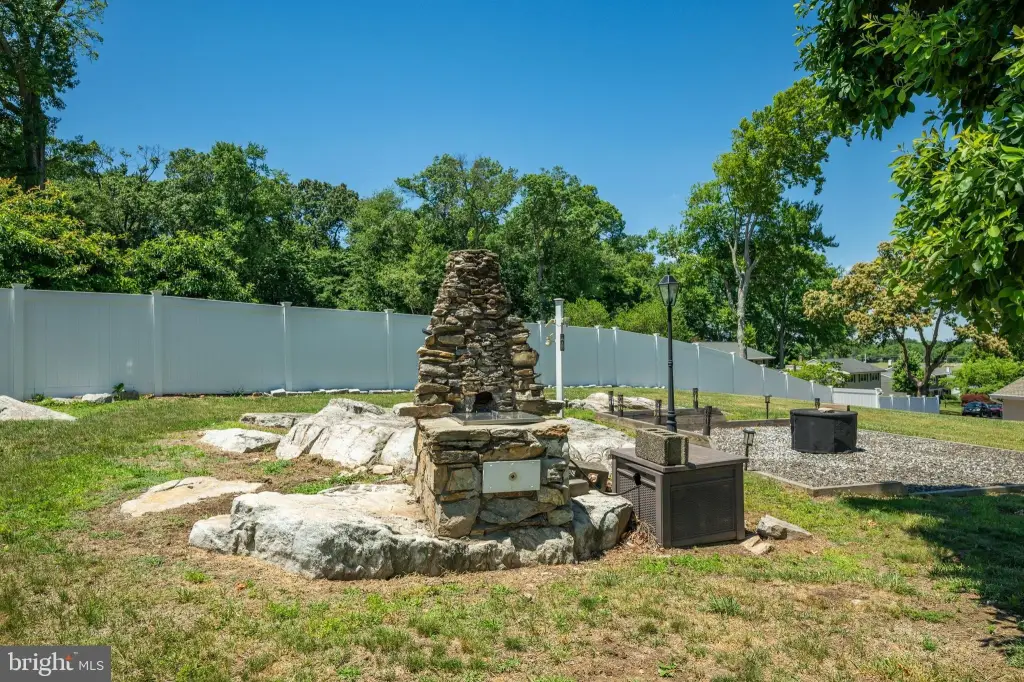
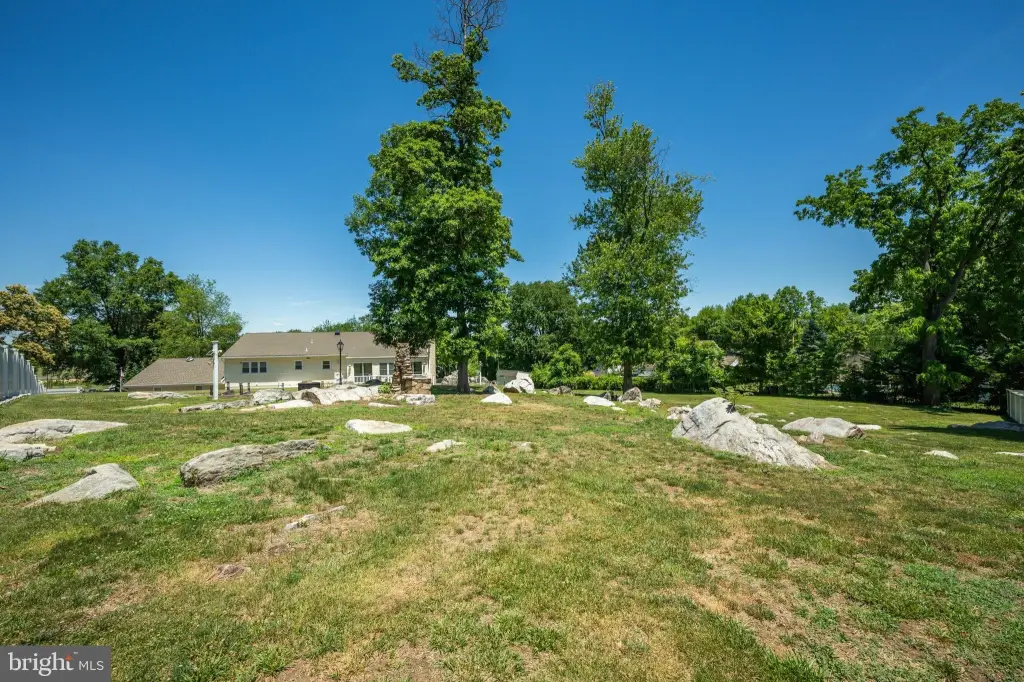
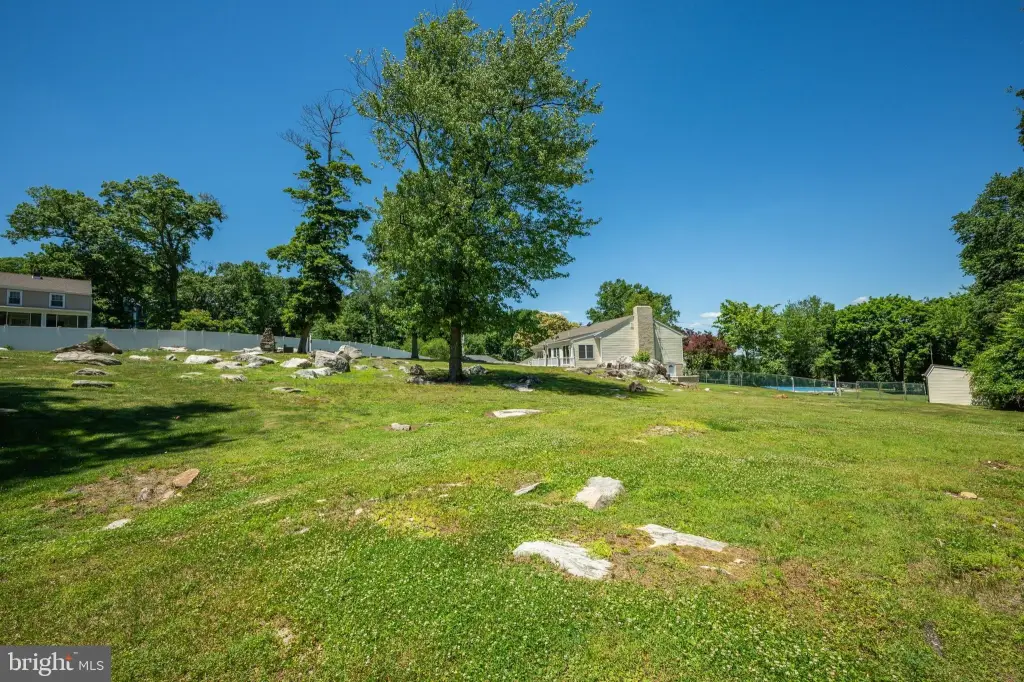
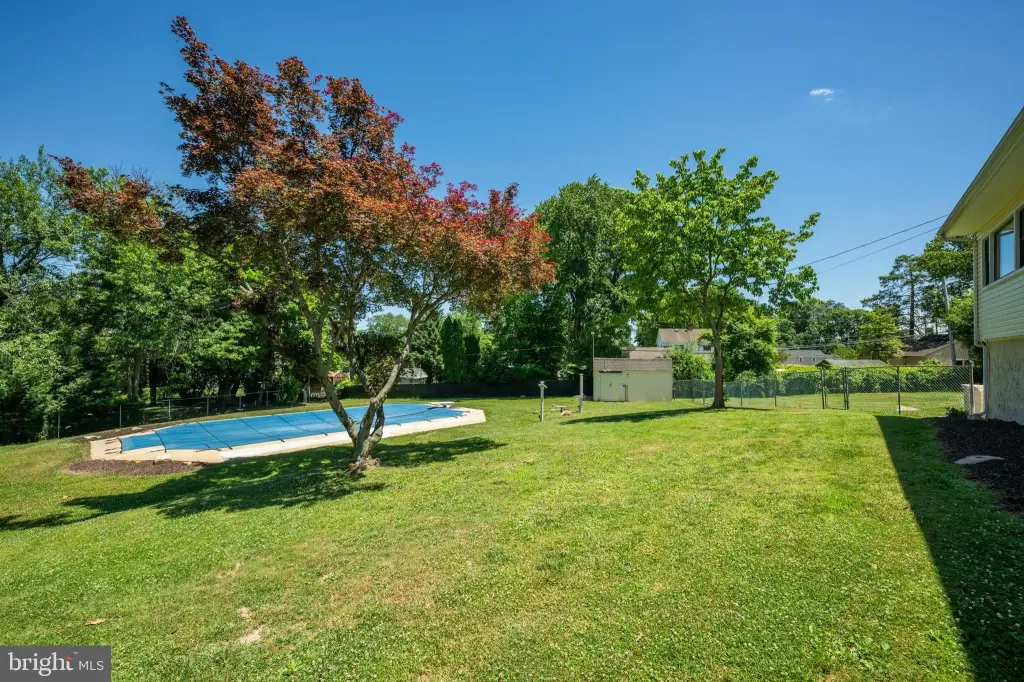
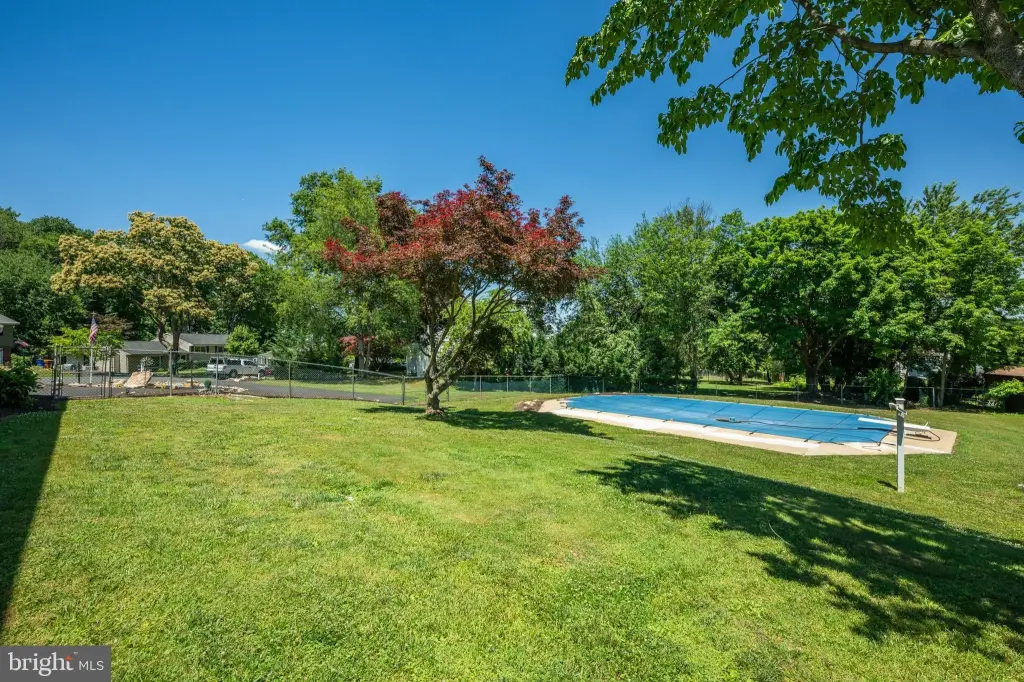
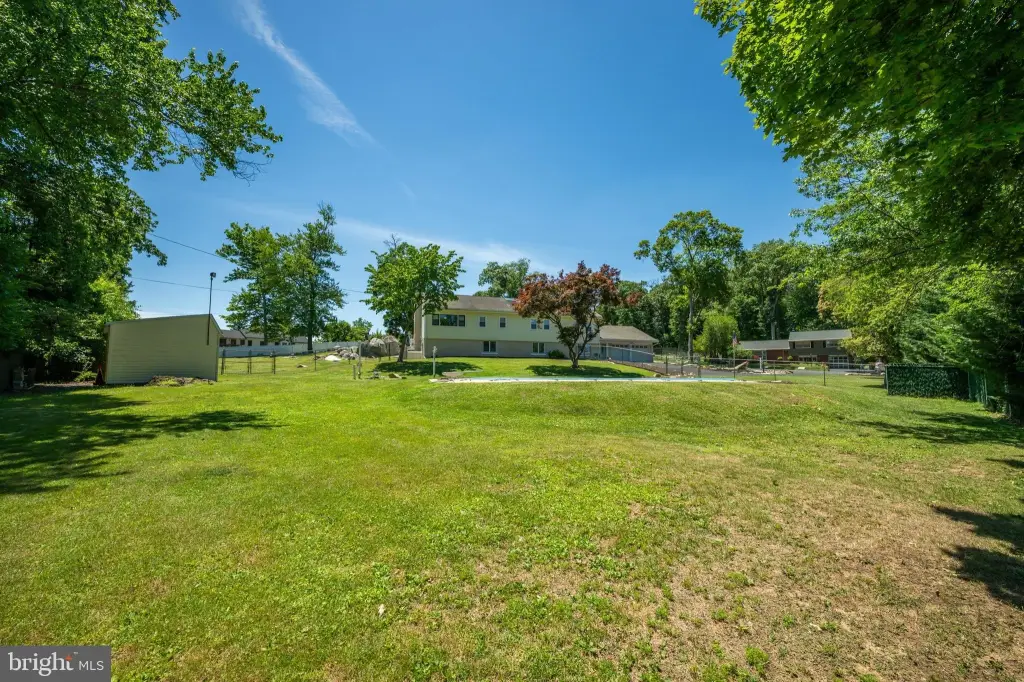
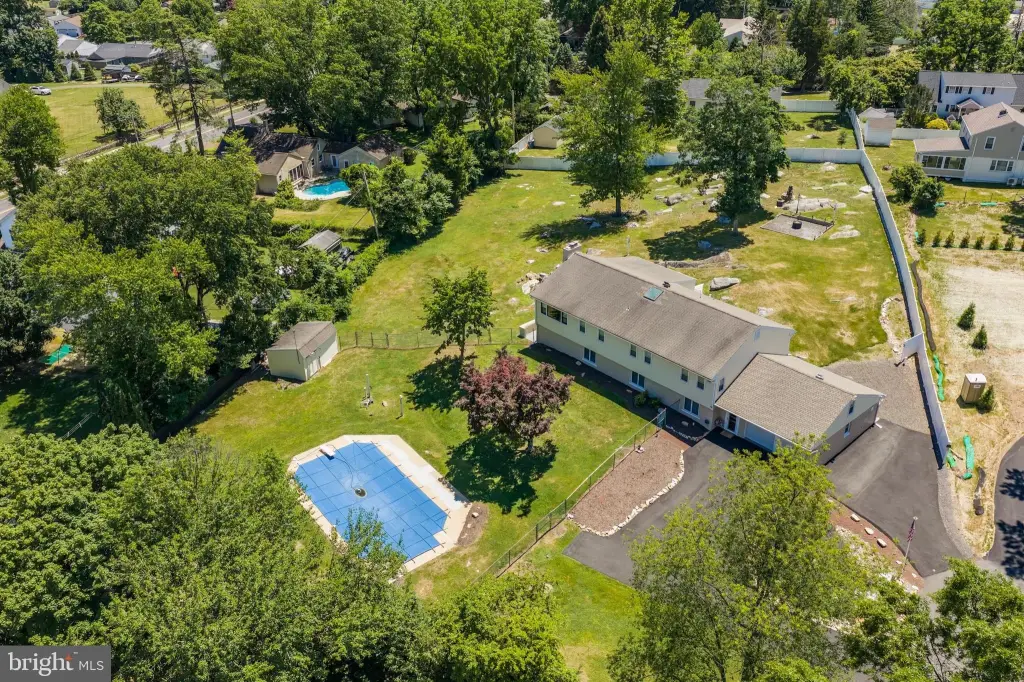
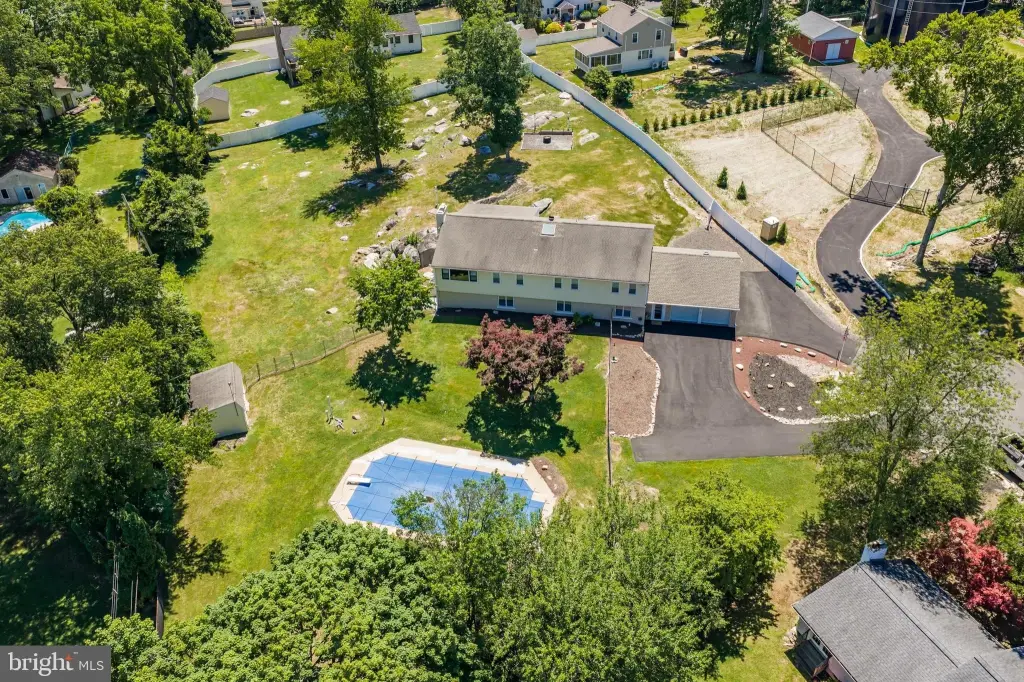
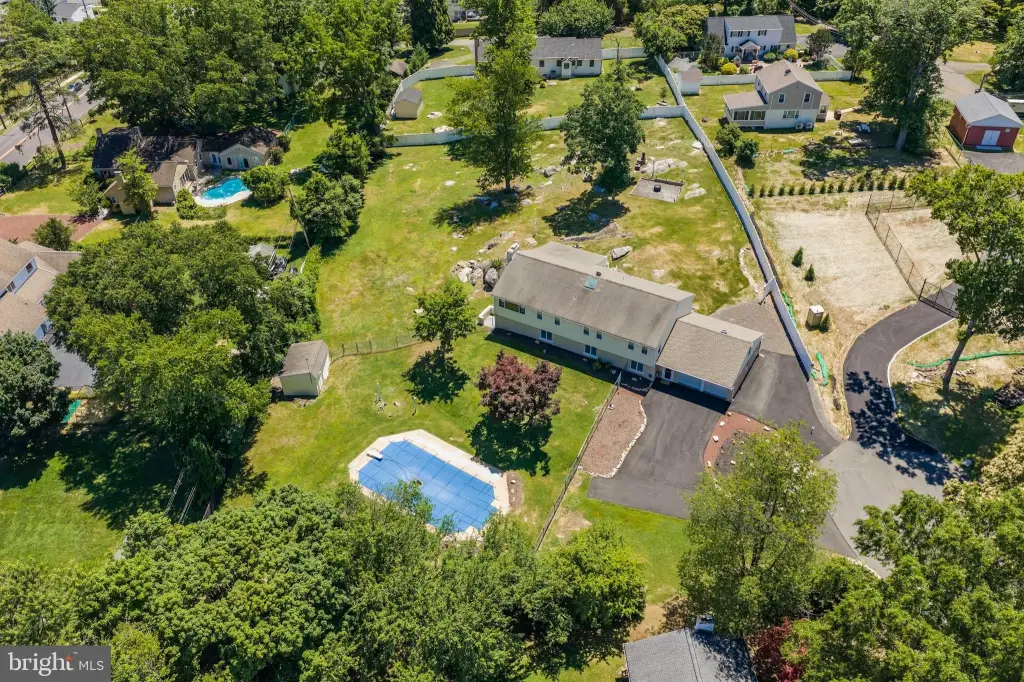
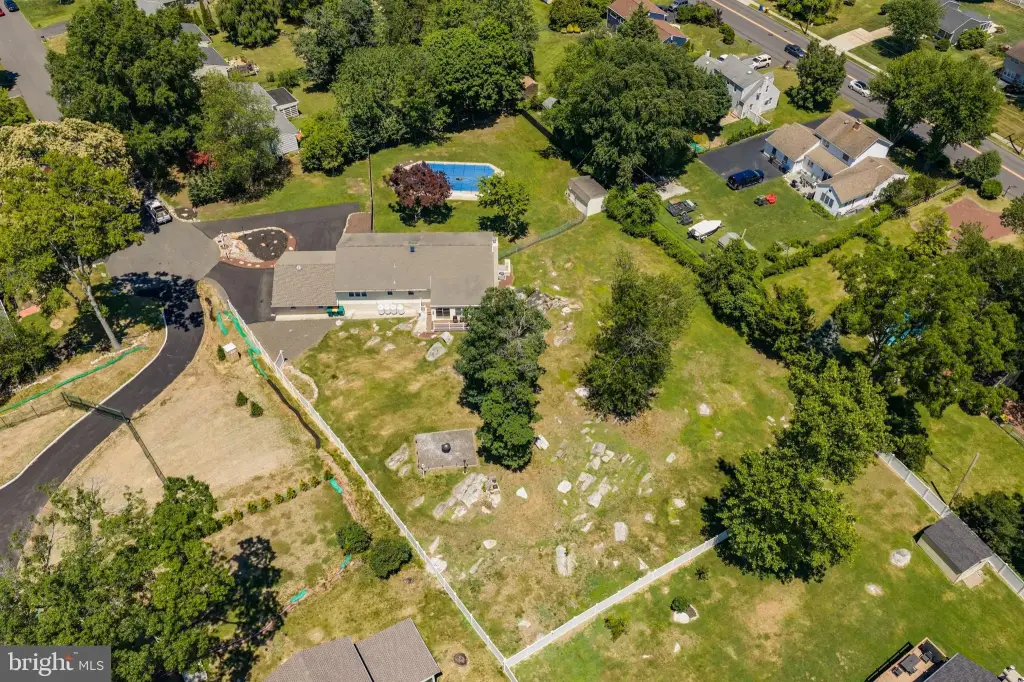
Set on 1.02 acres in Yardley, the property includes a fenced backyard, Trex deck, fire pit, chimney, driveway, attached garage, and private in-ground pool. Recent improvements include a new pool liner and cover, flooring, high-efficiency heaters, porch windows and doors, garage doors and openers, and driveway. The home was historically used as a two-family residence but is not a legal or approved duplex; township approval and buyer due diligence are required for that use. The property is near Yardley Station, Trenton Mercer Airport, I-295, shopping, dining, and the Pennsbury School District.
Set on 1.02 acres in Yardley, the property includes a fenced backyard, Trex deck, fire pit, chimney, driveway, attached garage, and private in-ground pool. Recent improvements include a new pool liner and cover, flooring, high-efficiency heaters, porch windows and doors, garage doors and openers, and driveway. The home was historically used as a two-family residence but is not a legal or approved duplex; township approval and buyer due diligence are required for that use. The property is near Yardley Station, Trenton Mercer Airport, I-295, shopping, dining, and the Pennsbury School District.
Key Highlights
- 3,092 square feet with five bedrooms in a bi‑level layout
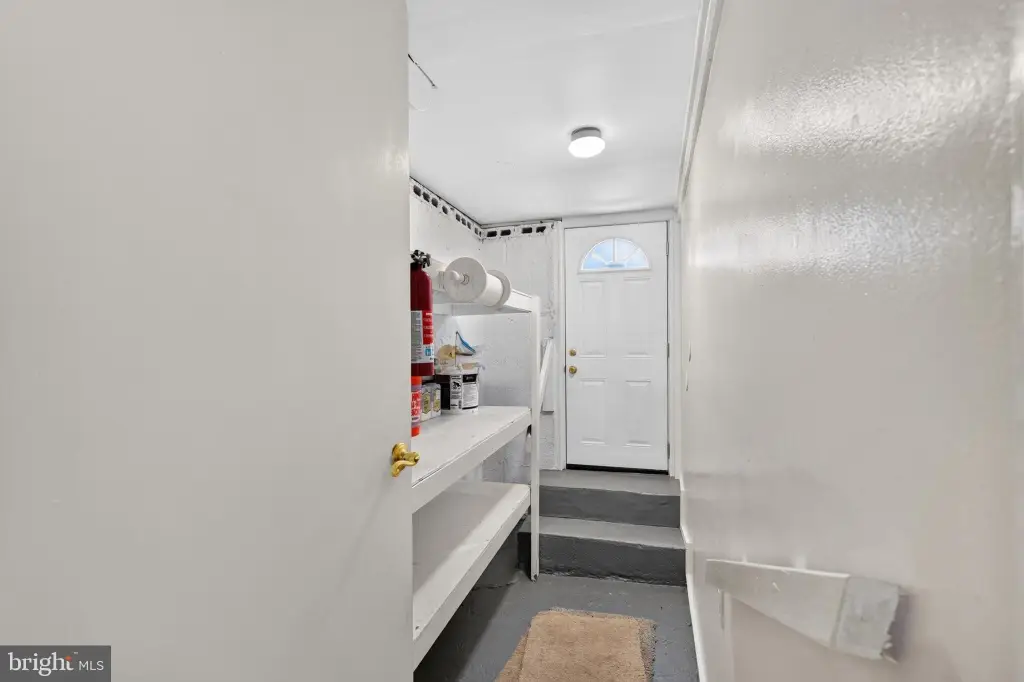
- Separate lower‑level suite with kitchenette, full bathroom, laundry, and private backyard entrance
- 1.02‑acre lot with fenced yard, Trex deck, fire pit, and private in‑ground pool
Financial Insights
Estimated NOI and Cap Rate
NOI / Yr
$38,283
Cap Rate
5.55%
Suggested Prices Based on Cap Rates
Cap Rate 5%
$765,660
$765.7K
Cap Rate 7%
$546,900
$546.9K
Cap Rate 9%
$425,367
$425.4K
Market Conditions
NOI Build-Up for 3,092 SF
Gross rent
$72.0K $23.28/SF
− Vacancy
−$2.4K −$0.77/SF
EGI
$69.6K $22.51/SF
− OpEx
−$31.3K −$10.13/SF
NOI
$38.3K $12.38/SF
Area
Bucks County, PA
Vacancy
3.30%
Lease Rate
$23.28 /SF/Yr
Expense Ratio
45.00%
Simulate Cap Rate and NOI
Suggested Prices Based on Cap Rates
Cap Rate 5%
$765,660
Cap Rate 7%
$546,900
Cap Rate 9%
$425,367
Alternative Uses
Best Use
Apartment 5plus
$546.9K
$478.5K – $638.1K
NOI $38,283 @ 7.0% cap · market cap 5.55%
Second Best
Multifamily LT 5
$524.1K
$458.6K – $611.5K
NOI $36,687 @ 7.0% cap · market cap 5.32%
Theoretical Best
Office A
$937.5K
$820.3K – $1.09M
NOI $65,622 @ 7.0% cap · market cap 9.51%
Zoning and permitted uses should be independently verified with authorities.
How Realmo checks its estimates
Property Analytics
Unlock full access to Insights
Subscribe to Realmo Intelligence
Open Analytics
Current Use
Lease Details
2
Residential units
Yes
Highway access
Location Intelligence
Trade Area within ½ mile
146
Businesses Nearby
Explore this area
Business Placement
Demographics for 19067, PA
53,153
Population
21,792
Households
2.4
Avg Household Size
44
Median Age
56%
College-Educated
97%
High-School Grad
31.5 sq mi
ZIP Area
1,687
Density / Sq Mi
$131,604
Median Household Income
$63,454
Median Earnings
$1,599
Median Rent
$483,000
Median Home Value
Check the figures for this property
Cap Rate, Value Estimation, Potential NOI and more
View Realmo Analytics
Market
Vacancy Rate% for Multifamily in Northeast region


Frequently Asked Questions
What type of property is this?
Duplex - Flexible two-level residence with a separate suite, private entrance, updated kitchen, pool, and multigenerational living potential.
Where is this duplex located?
The property is located at 11 WILLIAMS Lane Yardley, PA.
What is the asking price?
The asking price for this property is $689,900.
What are key features of this property?
This property features: 3,092 square feet with five bedrooms in a bi‑level layout; Separate lower‑level suite with kitchenette, full bathroom, laundry, and private backyard entrance; 1.02‑acre lot with fenced yard, Trex deck, fire pit, and private in‑ground pool


