Historic Mixed-Use
For Sale
$1,100,000
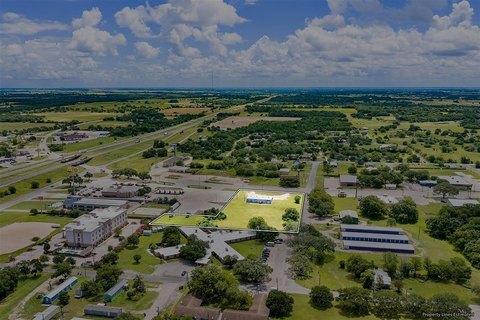
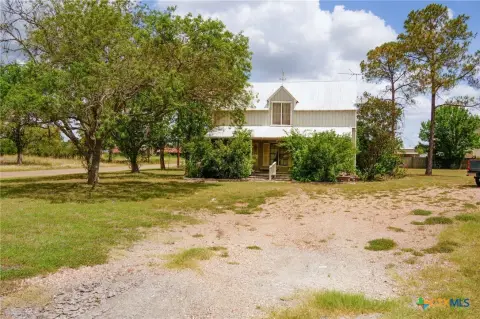
109 South Main St, Flatonia, TX 78941
Downtown landmark combines occupied apartments with storefronts and adaptable commercial space for ownership or leasing strategies.
Property Size8,330 SF
Price / SF$132.05
Days on Market50
Property Features for 109 South Main St
General Information
Standard status
Active
Size
8,330 SF
Property subtype
Commercial
Units
Unit Mix
2 x 2BR/1BA, 2 x 1BR/1BA, 1 x 2BR flex apartment
Multifamily Units
5
Building Details
Year Built
1897
Buildings
1
Tenancy
Multi
Listing Agency:
Bubela & Associates, Inc.
Listed By:
Chip Bubela · License #0566009
(979) 743-4555
Source:
Bubelarealestate
Added: Aug 28
Changed: Oct 15
Last Checked: Oct 14 at 8:03PM
Displayed information is deemed reliable but is not guaranteed and should be independently verified. All listing content including descriptions, pricing, images are the copyrighted material of Bubela & Associates, Inc.

Ask AI about this property
Review the available facts, identify missing information and prepare questions for the agent.
Investment Insights
Based on property information with market context.
Located at 109 South Main St in Flatonia, this 8,330-square-foot mixed-use building is a recorded Texas Historic Landmark with documented roots in the community. Completed in 1897 as a hospital, the property later housed an opera house along with other commercial and civic uses. Its current configuration includes four occupied second-floor apartments: two 2-bedroom/1-bath units and two 1-bedroom/1-bath units. A first-floor east-side 2-bedroom flex apartment adds residential capacity, while two ground-floor storefronts and rear flex space provide adaptable commercial areas.
The storefront and flex components can support retail, office, studio, service, hospitality, or residential concepts subject to applicable approvals. Unit 2 has access to adjacent second-floor office space and may provide an opportunity to evaluate additional residential area, subject to measurement, code, permitting, and buyer verification. The property is reached from Hwy 90 via Hwy 95 south, with access from W South Main St before S Penn St.
The storefront and flex components can support retail, office, studio, service, hospitality, or residential concepts subject to applicable approvals. Unit 2 has access to adjacent second-floor office space and may provide an opportunity to evaluate additional residential area, subject to measurement, code, permitting, and buyer verification. The property is reached from Hwy 90 via Hwy 95 south, with access from W South Main St before S Penn St.
Key Highlights
- 8,330‑square‑foot recorded Texas Historic Landmark completed in 1897
- Four occupied second‑floor apartments: two 2‑bedroom/1‑bath and two 1‑bedroom/1‑bath units
- First‑floor east‑side 2‑bedroom flex apartment with a planned September 2026 move
Financial Insights
Estimated NOI and Cap Rate
NOI / Yr
$42,615
Cap Rate
3.87%
Suggested Prices Based on Cap Rates
Cap Rate 5%
$852,300
$852.3K
Cap Rate 7%
$608,786
$608.8K
Cap Rate 9%
$473,500
$473.5K
Market Conditions
NOI Build-Up for 8,330 SF
Gross rent
$67.0K $8.04/SF
− Vacancy
−$6.1K −$0.73/SF
EGI
$60.9K $7.31/SF
− OpEx
−$18.3K −$2.19/SF
NOI
$42.6K $5.12/SF
Area
Fayette County, TX
Vacancy
9.10%
Lease Rate
$8.04 /SF/Yr
Expense Ratio
30.00%
Simulate Cap Rate and NOI
Suggested Prices Based on Cap Rates
Cap Rate 5%
$852,300
Cap Rate 7%
$608,786
Cap Rate 9%
$473,500
Alternative Uses
Best Use
Apartment 5plus
$81.00M
$70.88M – $94.50M
NOI $5,670,226 @ 7.0% cap · market cap 515.48%
Second Best
Retail
$1.61M
$1.41M – $1.88M
NOI $112,832 @ 7.0% cap · market cap 10.26%
Theoretical Best
Multifamily LT 5
$93.39M
$81.72M – $108.96M
NOI $6,537,414 @ 7.0% cap · market cap 594.31%
Zoning and permitted uses should be independently verified with authorities.
How Realmo checks its estimates
Property Analytics
Unlock full access to Insights
Subscribe to Realmo Intelligence
Open Analytics
Current Use
Lease Details
5
Residential units
Multi-tenant
Tenancy
Location Intelligence
Trade Area within ½ mile
182
Businesses Nearby
Explore this area
Business Placement
Demographics for 78941, TX
3,006
Population
1,749
Households
1.7
Avg Household Size
47
Median Age
17%
College-Educated
88%
High-School Grad
161.8 sq mi
ZIP Area
19
Density / Sq Mi
$75,694
Median Household Income
$36,270
Median Earnings
$882
Median Rent
$171,900
Median Home Value
Check the figures for this property
Cap Rate, Value Estimation, Potential NOI and more
View Realmo Analytics
Market
Vacancy Rate% for Industrial in South region



Frequently Asked Questions
What type of property is this?
Mixed-use property - Downtown landmark combines occupied apartments with storefronts and adaptable commercial space for ownership or leasing strategies.
Where is this mixed-use property located?
The property is located at 109 South Main St Flatonia, TX.
What is the asking price?
The asking price for this property is $1,100,000.
What are key features of this property?
This property features: 8,330‑square‑foot recorded Texas Historic Landmark completed in 1897; Four occupied second‑floor apartments: two 2‑bedroom/1‑bath and two 1‑bedroom/1‑bath units; First‑floor east‑side 2‑bedroom flex apartment with a planned September 2026 move



