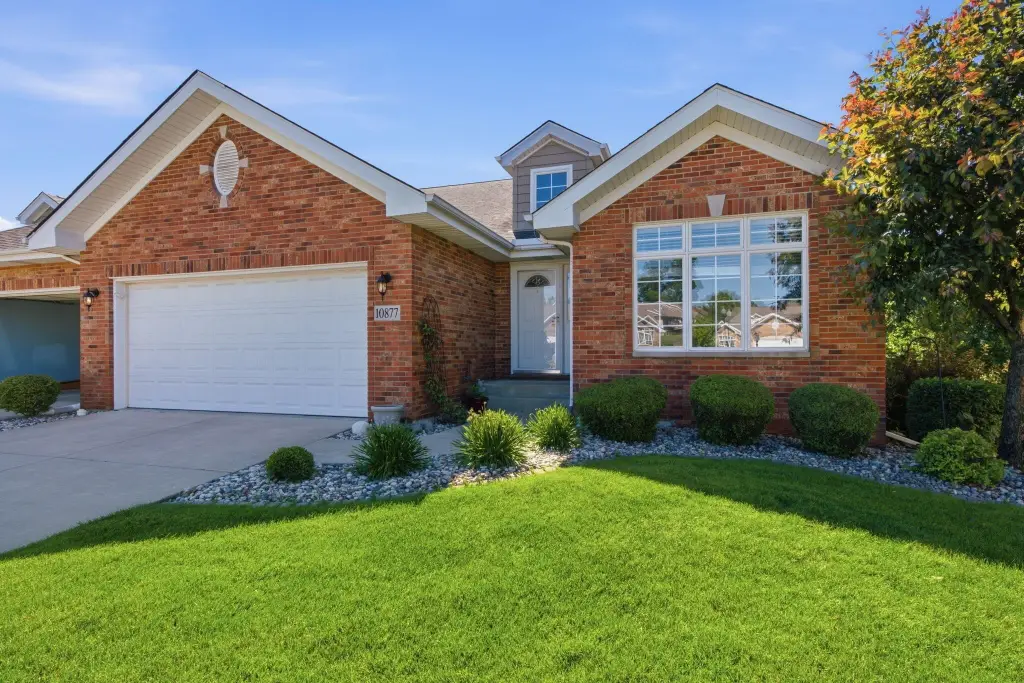
Move-In Ready Townhome with
For Sale
$385,000
Pending
10877 Mathias Drive, St John, IN 46373
Residential, St. John, IN
Property Size1,896 SF
Lot Size0.16 Acres
Days on Market126
Property Features for 10877 Mathias Drive
General Information
Property type
Residential
Property subtype
Duplex
Bedrooms
2
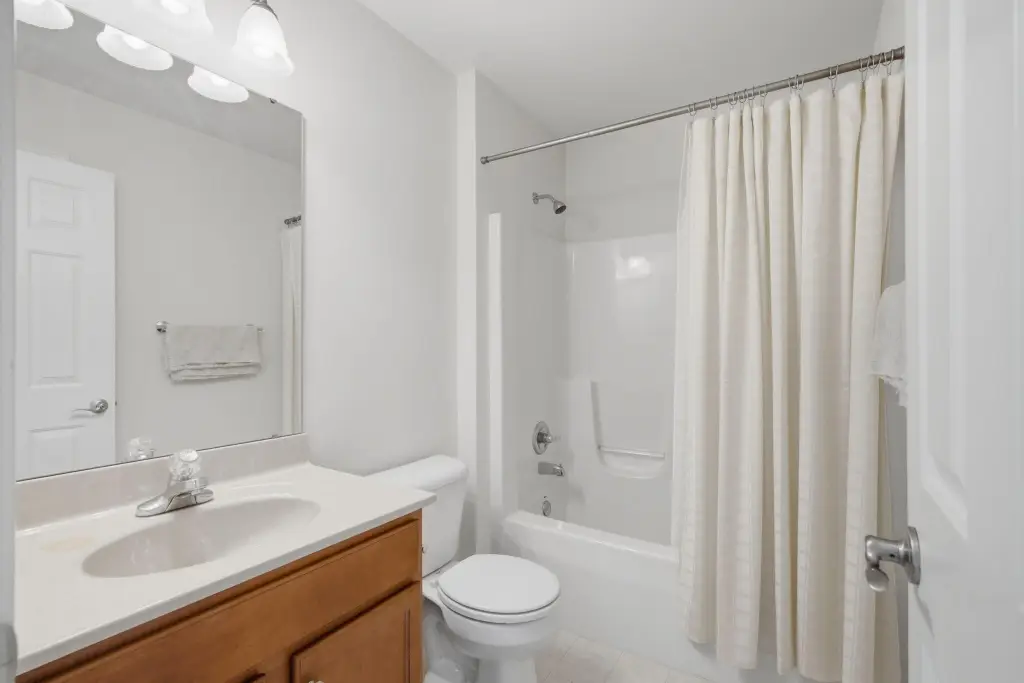
Bathrooms
2
Full bathrooms
1
Rooms
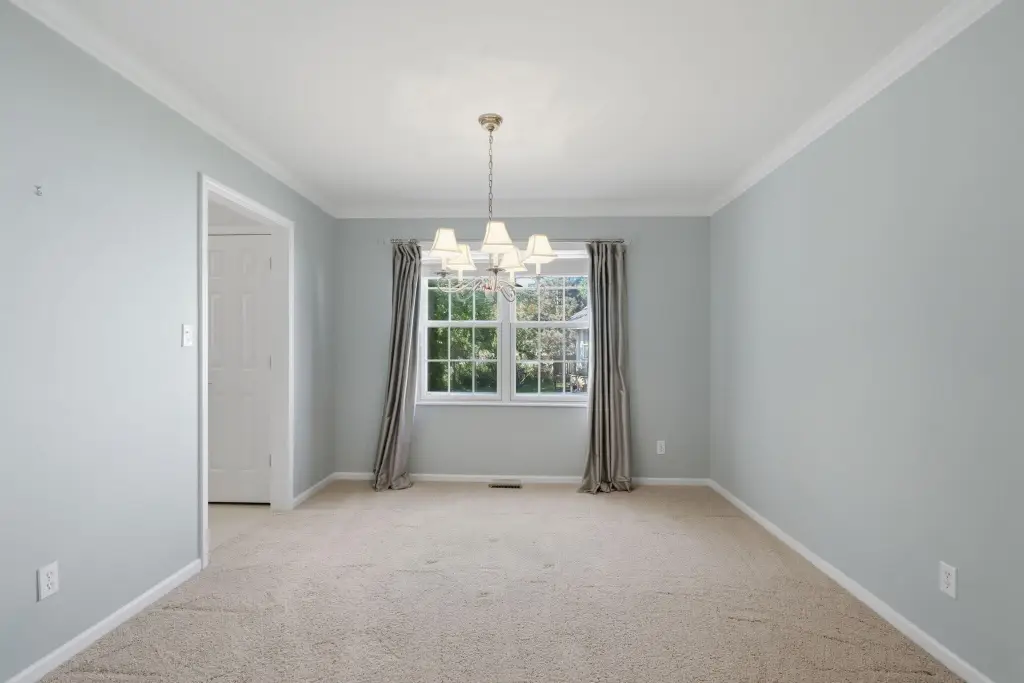
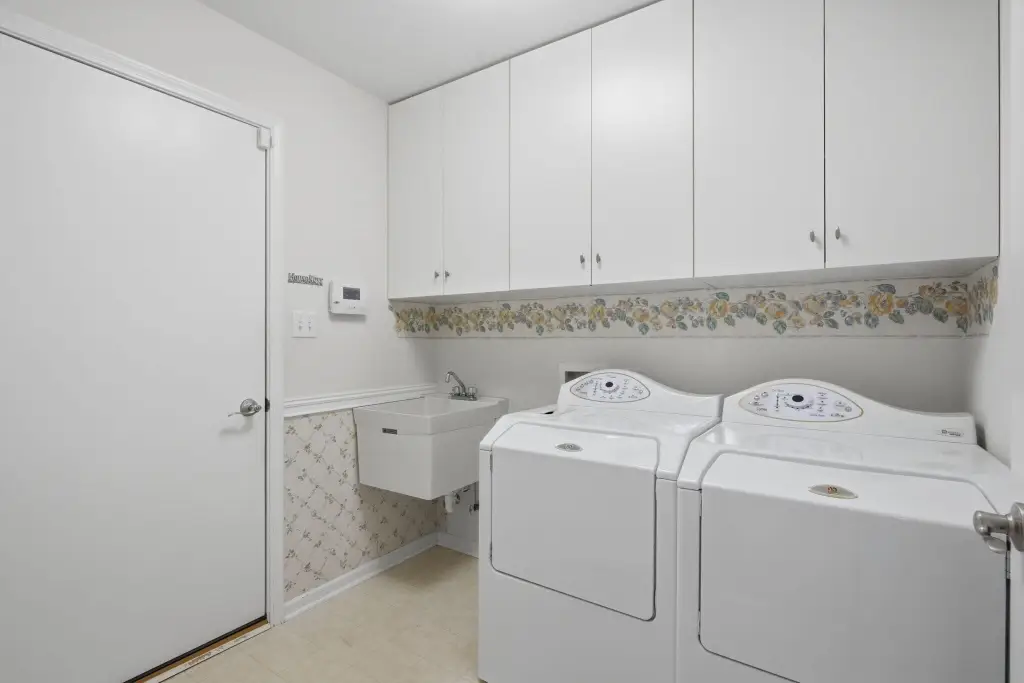
Basement, Bathroom 2, Dining Room, Laundry Room, Bedroom 1, Bedroom 2, Bathroom 1
Parking features
Open
Security features
Security System
Interior features
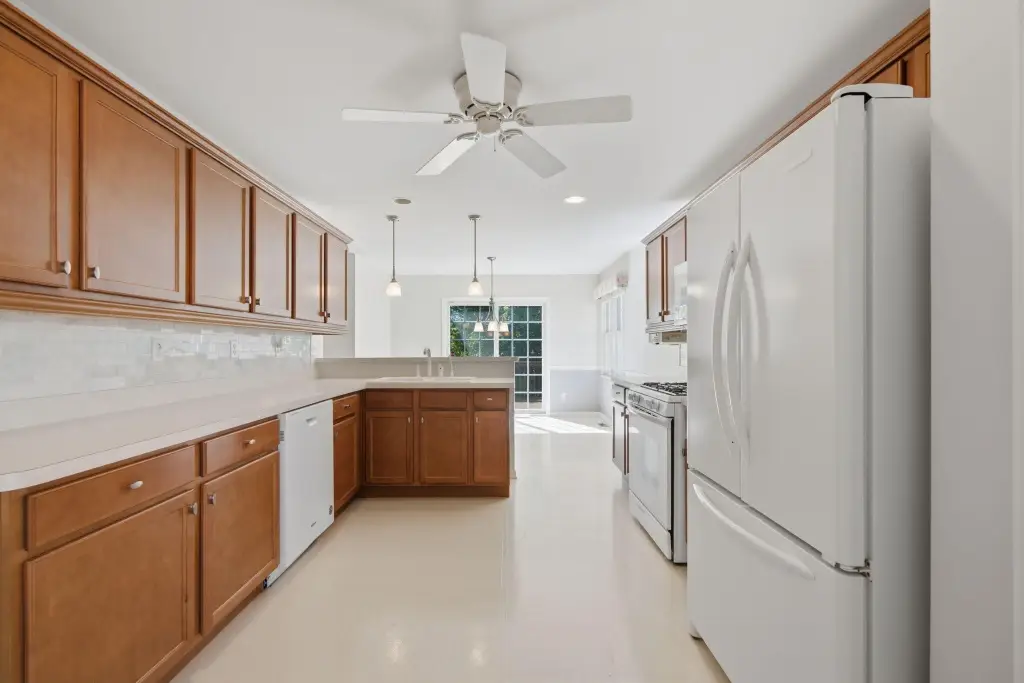
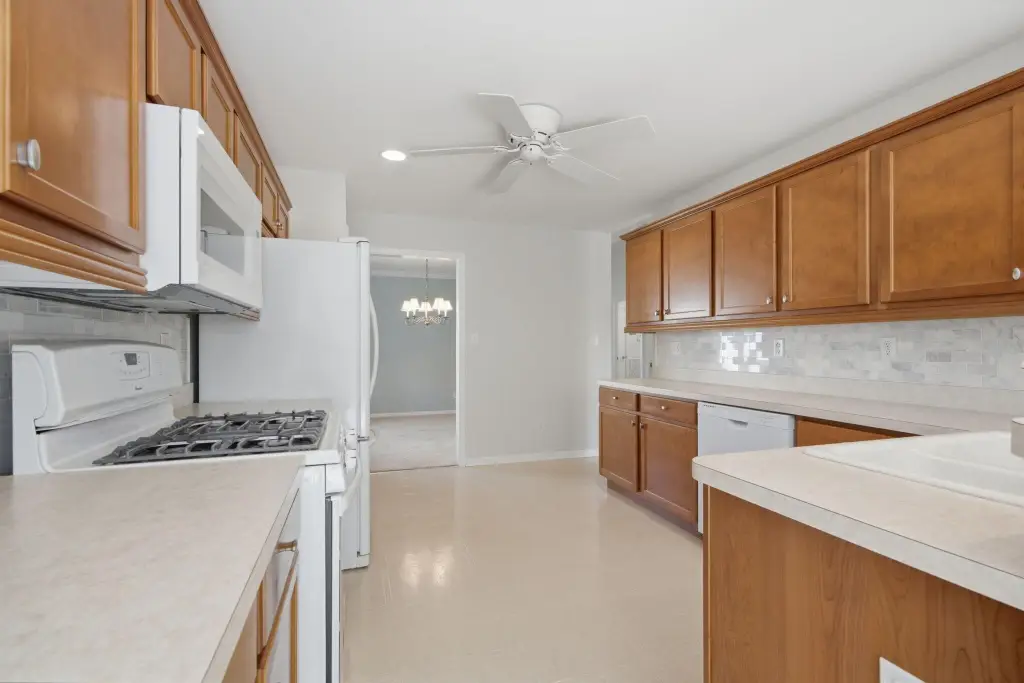
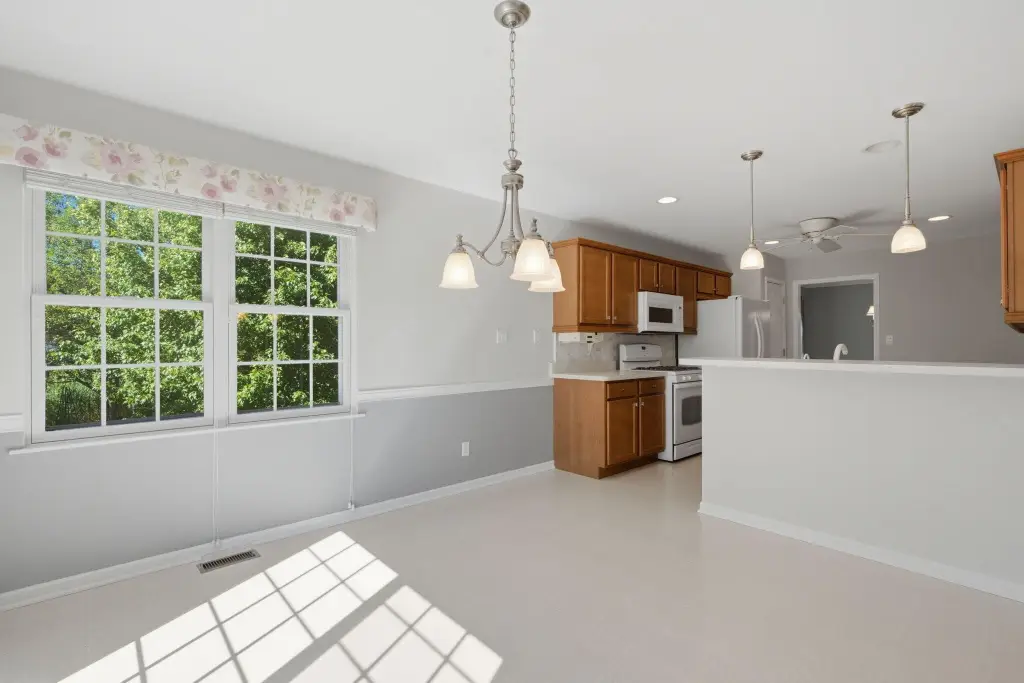
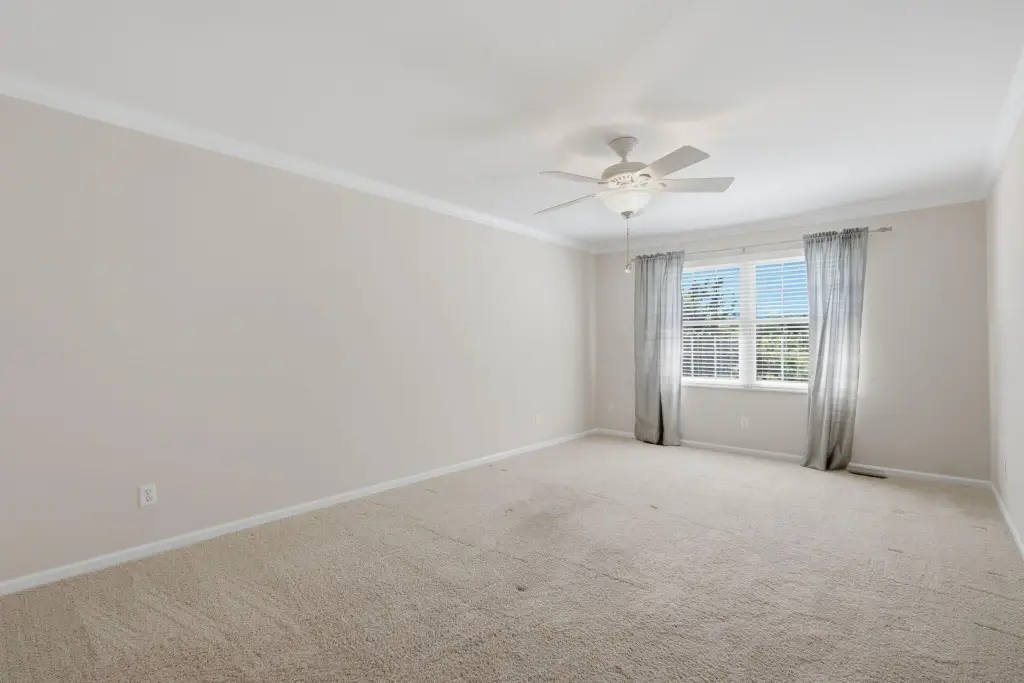
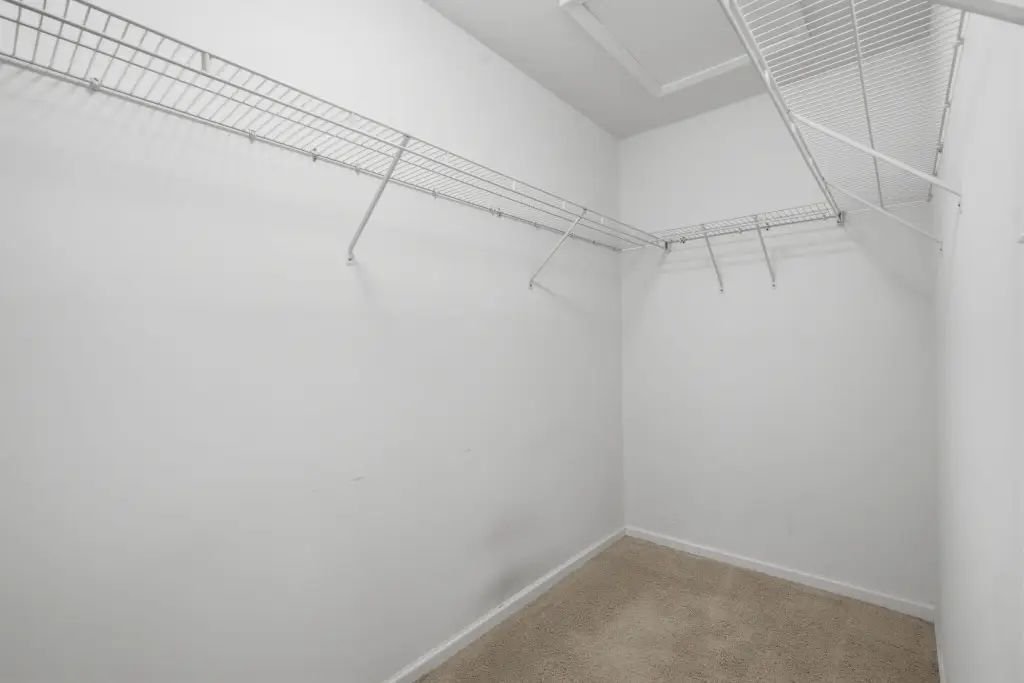
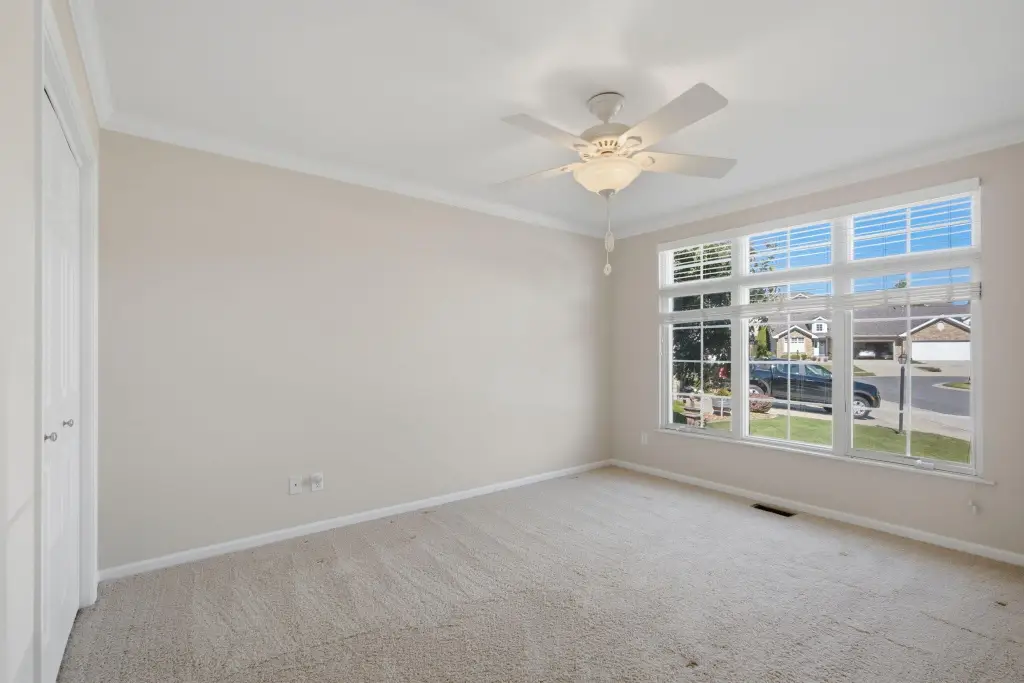
Cathedral Ceiling(s), Walk-In Closet(s), High Ceilings, Eat-in Kitchen, Entrance Foyer, Crown Molding, Ceiling Fan(s)
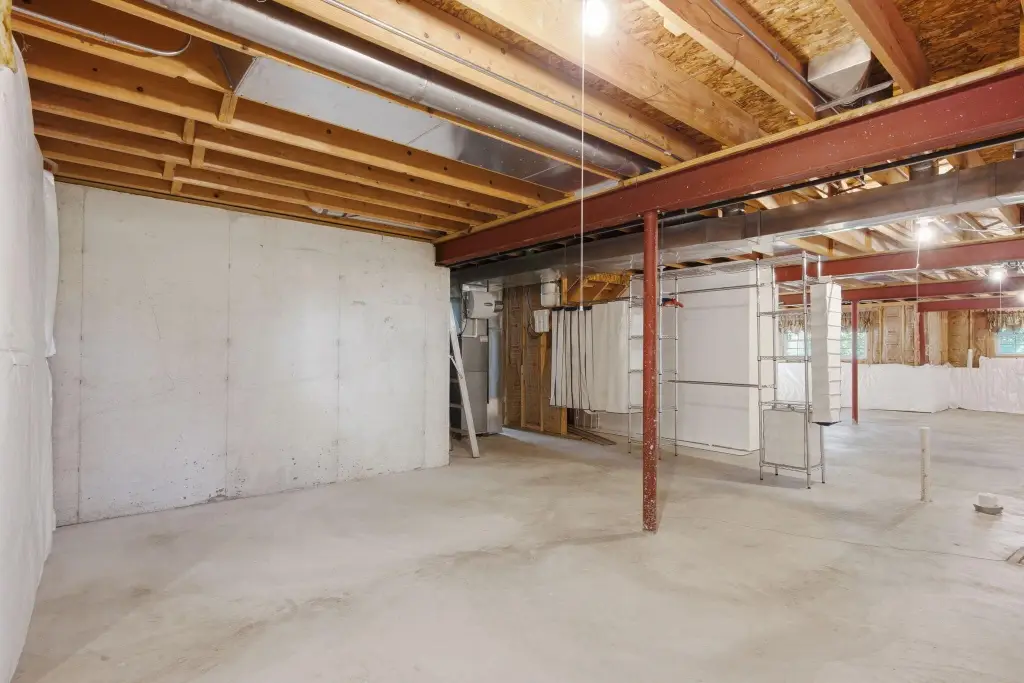
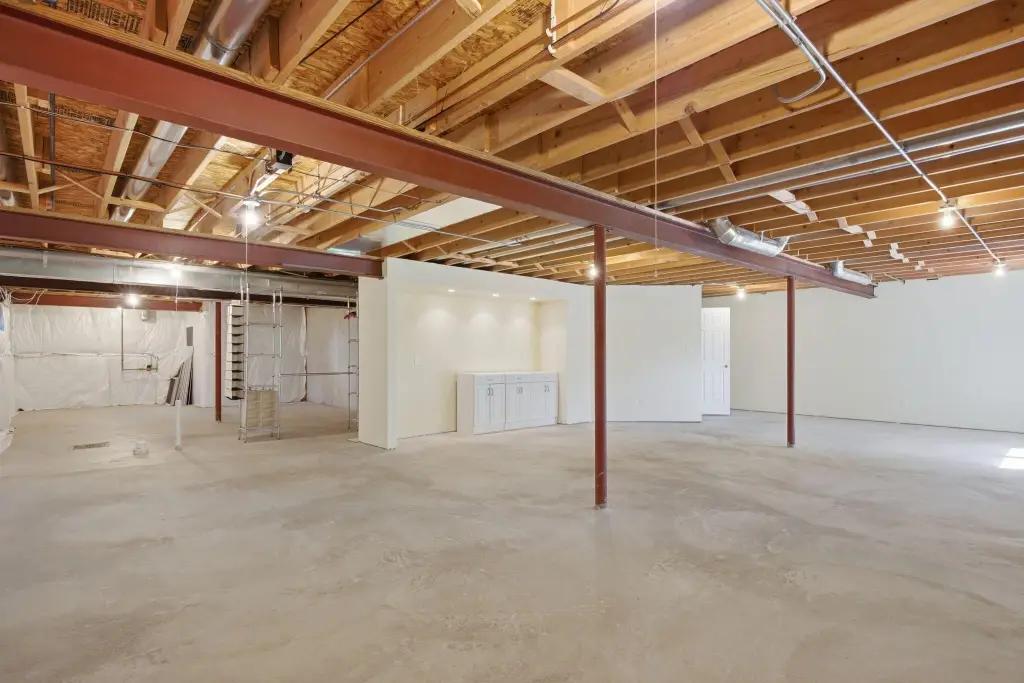
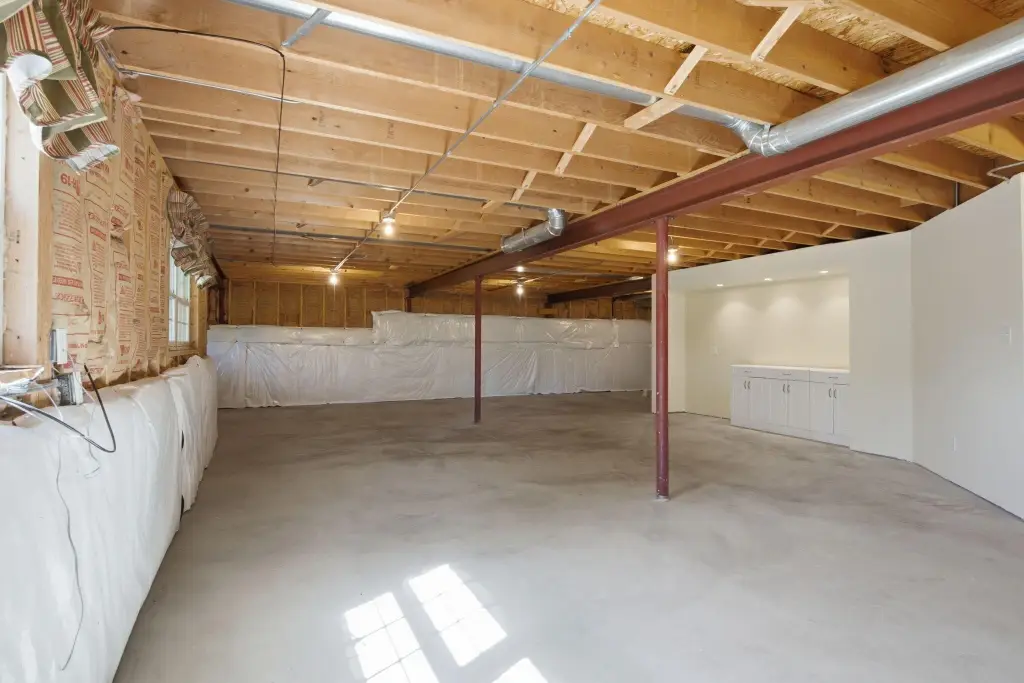
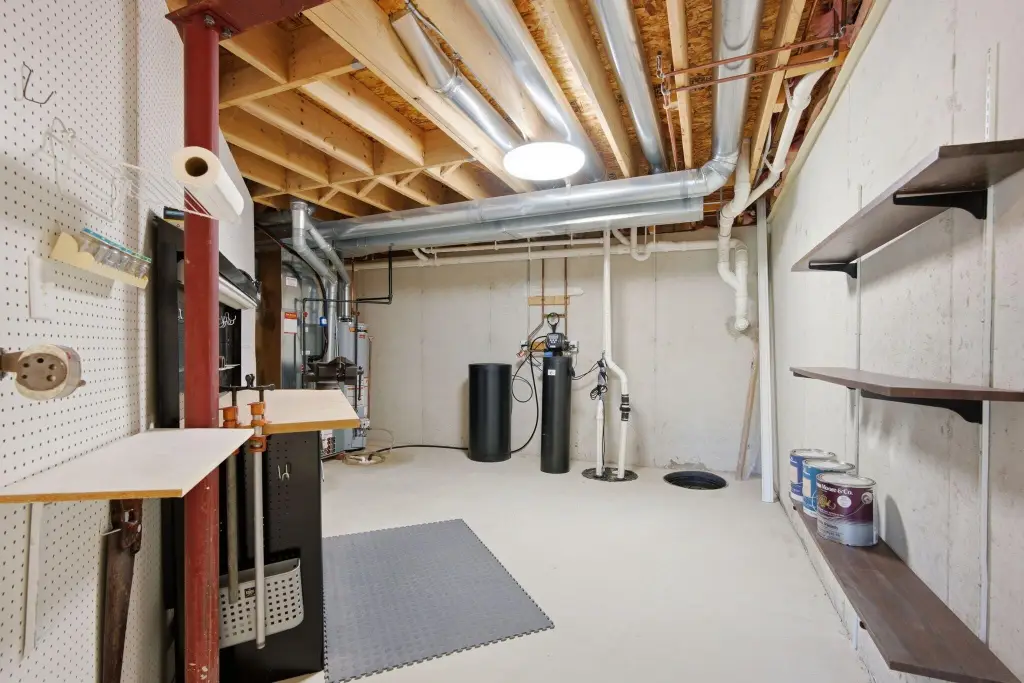
Basement
Storage Space, Daylight
Appliances
Dryer, Water Softener Owned, Washer, Refrigerator, Gas Range, Dishwasher
Subdivision
Woods/Weston Rdg 02
Lot features
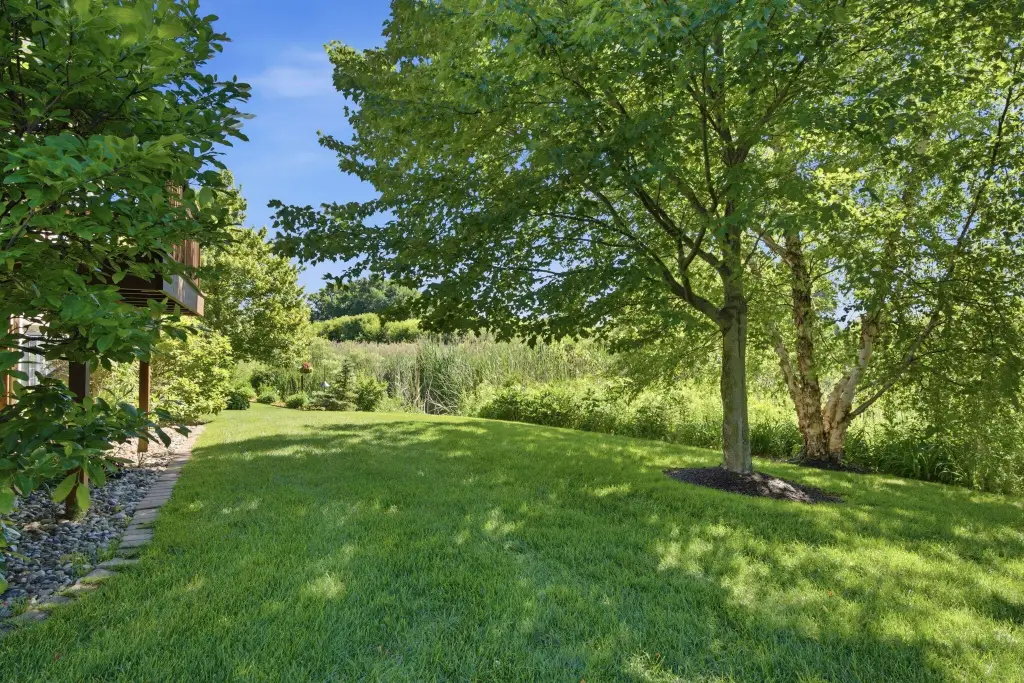
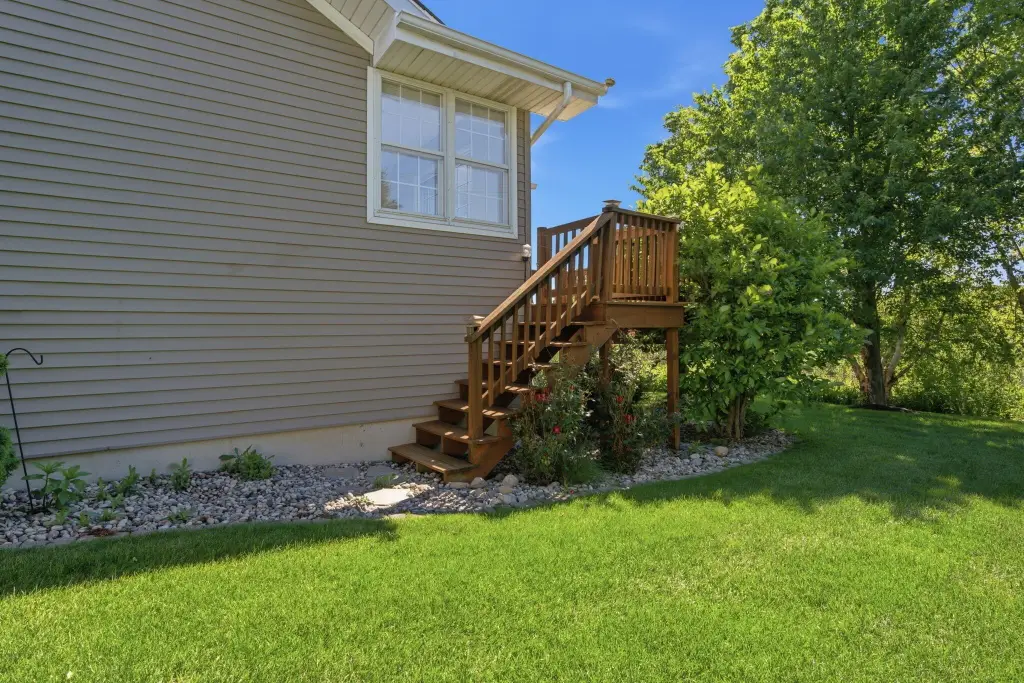
Back Yard, Landscaped, Front Yard, Cul-De-Sac
Directions
US 41 to 231 West. Right on Olcott Ave, right on 108th. Follow bend to Mathias Dr
Standard status
Pending
APN
451505455026000015
Size
1,896 SF
Lot size
0.16 Acres
Taxes and HOA fees
Tax Year
2024
Tax Description
THE WOODS OF WESTON RIDGE UNIT 2 PT. OF SW'LY 28.48FT OF LOT 12
Tax Annual Amount
3432
HOA Fee
$1,680 Semi-Annually
Legal Description
THE WOODS OF WESTON RIDGE UNIT 2 PT. OF SW'LY 28.48FT OF LOT 12
Utilities
Sewer type
Public Sewer
Heating system
Natural Gas, Central
Water source
Public
Building Details
Year built
2006
Floors in Building
1
Listing Agency:
Better Homes and Gardens Real
(219) 365-8000
Listed By:
Jeremy Barzycki
(219) 433-8766
Added: Jun 14
Changed: Sep 16
Last Checked: Oct 17 at 3:06AM
MLS# 840657
Copyright © 2026 Greater Northwest Indiana Association of REALTORS. All rights reserved. All information provided by the listing agent/broker is deemed reliable but is not guaranteed and should be independently verified.

Ask AI about this property
Review the available facts, identify missing information and prepare questions for the agent.
Investment Insights
Based on property information with market context.
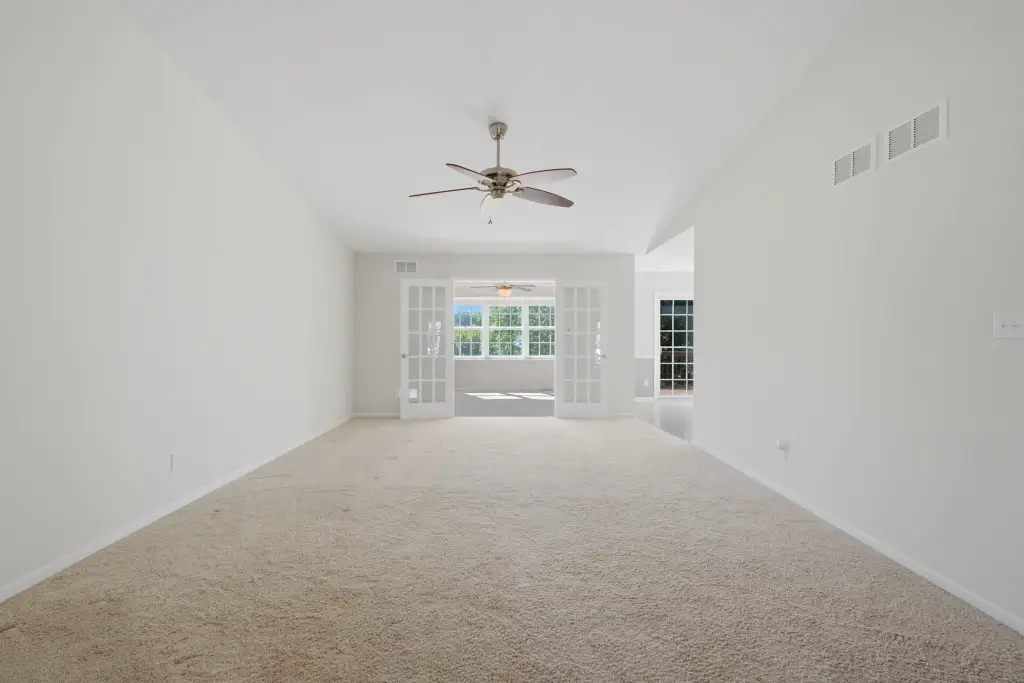
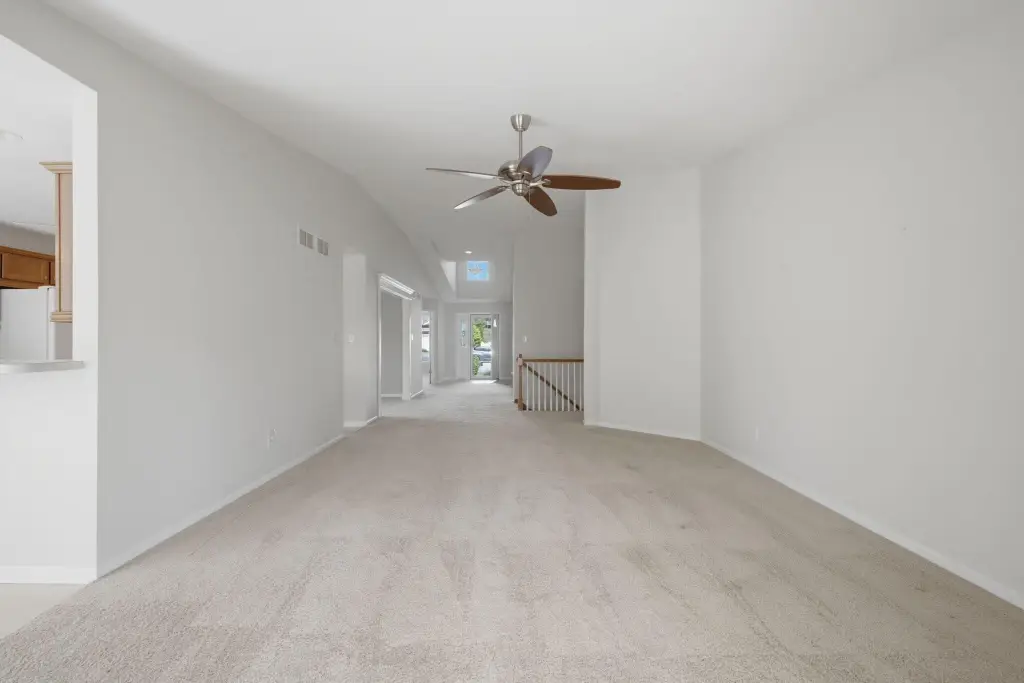
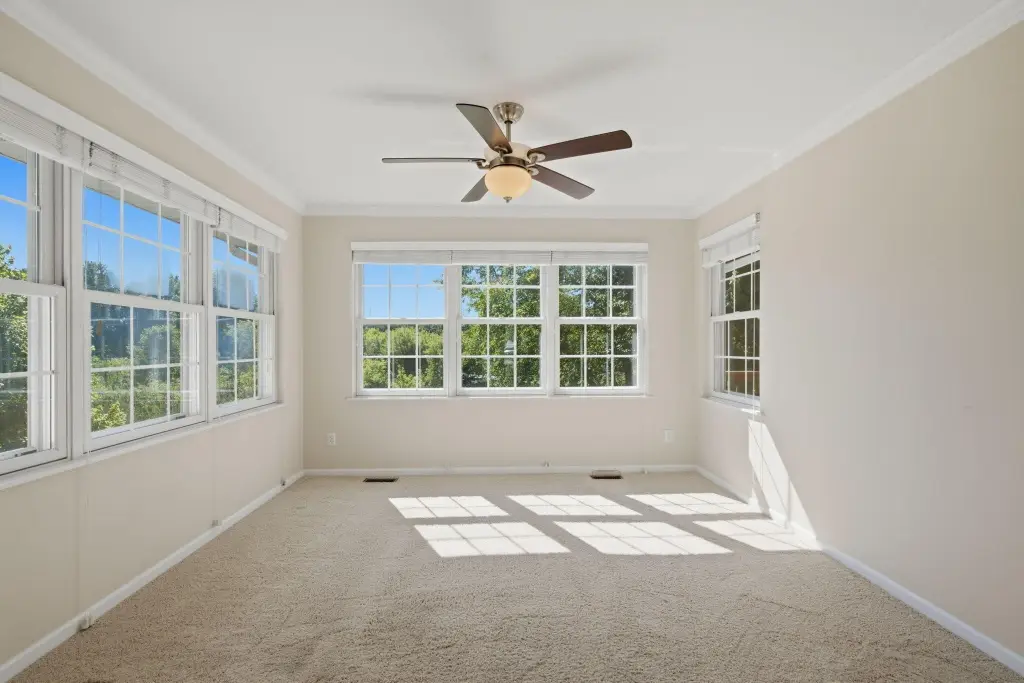
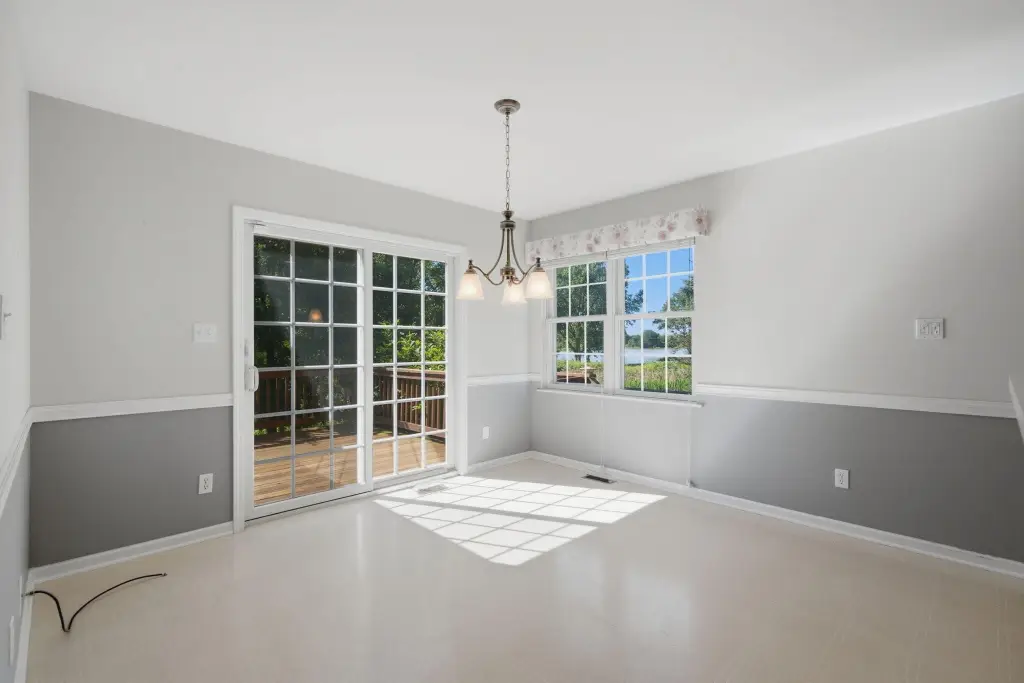
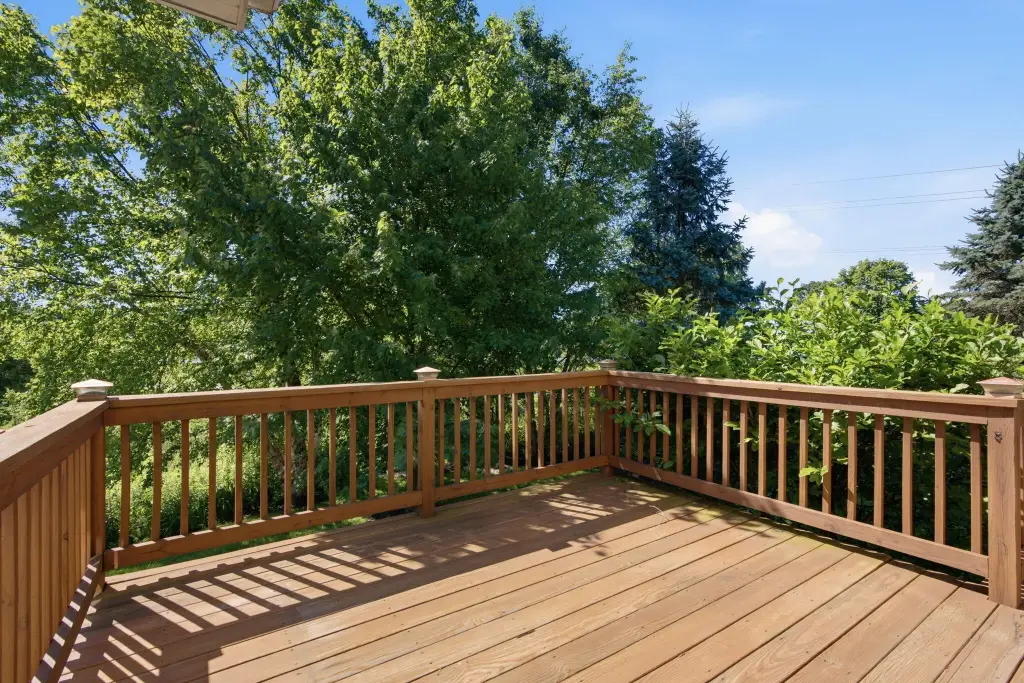
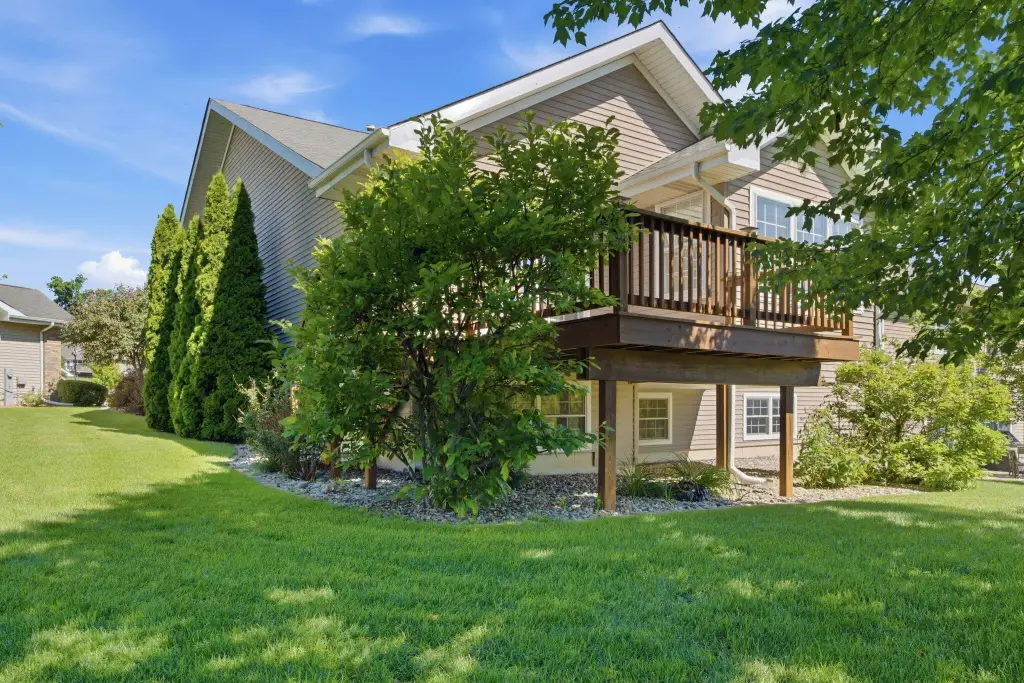
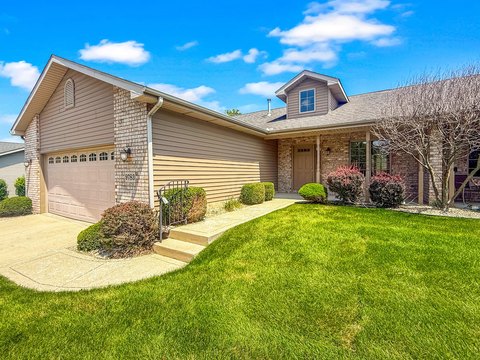
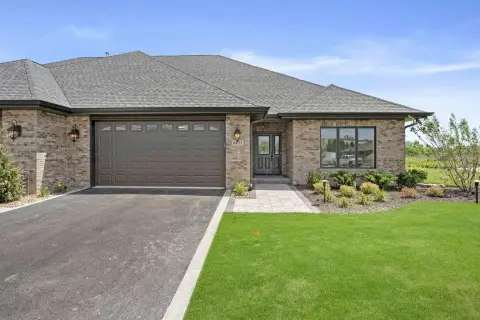
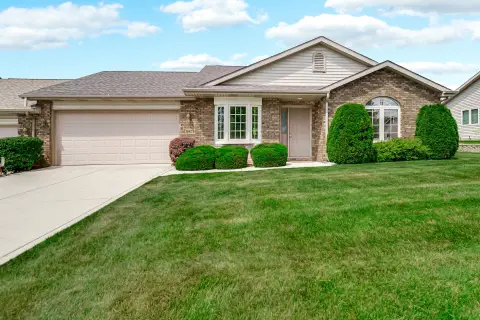
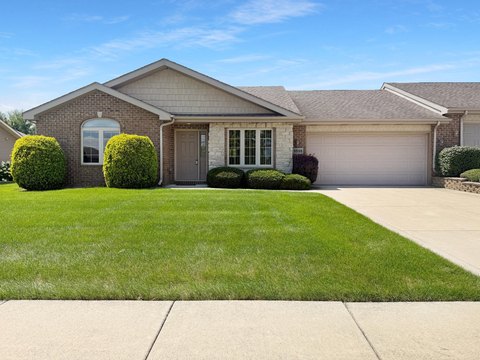
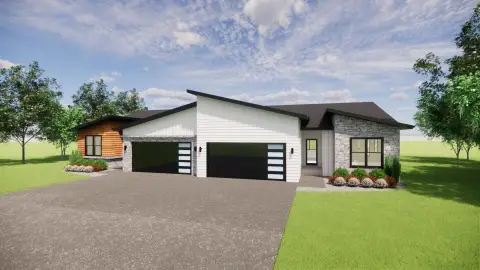
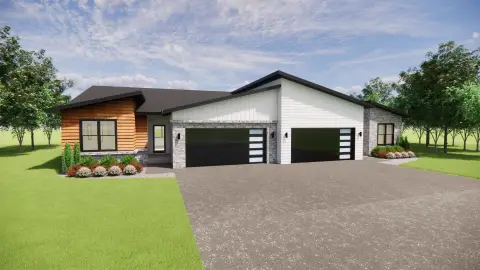
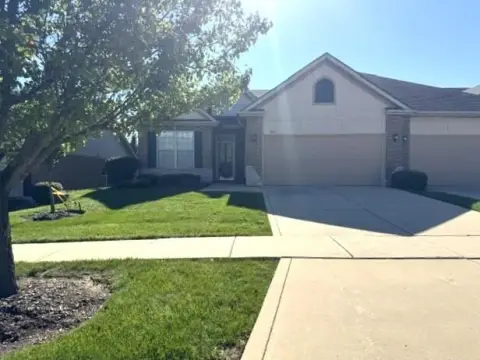
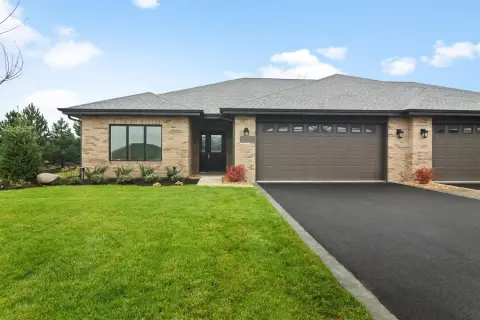
This move-in ready townhome offers a bright, open main living area designed for everyday living, plus an adjoining sunroom for year-round enjoyment. The daylight basement is unfinished and presented as a blank canvas, with rough-in already in place for a future bathroom. An attached 2-car garage adds practical convenience.
Located in St. John, the home places shopping, restaurants, and major roadways within easy reach.
With thoughtful updates and an adaptable lower level, the layout supports comfortable day-to-day use while also providing a practical opportunity to expand living space over time.
Located in St. John, the home places shopping, restaurants, and major roadways within easy reach.
With thoughtful updates and an adaptable lower level, the layout supports comfortable day-to-day use while also providing a practical opportunity to expand living space over time.
Key Highlights
- 2006‑built townhome with cathedral ceilings, high ceilings, and crown molding
- Bright main living area plus sunroom for year‑round use
- Daylight basement is roughed in for a future bathroom, offering expansion options
Financial Insights
Estimated NOI and Cap Rate
NOI / Yr
$16,774
Cap Rate
4.36%
Suggested Prices Based on Cap Rates
Cap Rate 5%
$335,480
$335.5K
Cap Rate 7%
$239,629
$239.6K
Cap Rate 9%
$186,378
$186.4K
Market Conditions
NOI Build-Up for 1,896 SF
Gross rent
$32.3K $17.04/SF
− Vacancy
−$1.8K −$0.95/SF
EGI
$30.5K $16.09/SF
− OpEx
−$13.7K −$7.24/SF
NOI
$16.8K $8.85/SF
Area
Lake County, IN
Vacancy
5.60%
Lease Rate
$17.04 /SF/Yr
Expense Ratio
45.00%
Simulate Cap Rate and NOI
Suggested Prices Based on Cap Rates
Cap Rate 5%
$335,480
Cap Rate 7%
$239,629
Cap Rate 9%
$186,378
Alternative Uses
Best Use
Apartment 5plus
$239.6K
$209.7K – $279.6K
NOI $16,774 @ 7.0% cap · market cap 4.36%
Second Best
—
—
no second resolved use
Theoretical Best
Specialty Retail
$529.3K
$463.1K – $617.5K
NOI $37,050 @ 7.0% cap · market cap 9.62%
Zoning and permitted uses should be independently verified with authorities.
How Realmo checks its estimates
Property Analytics
Unlock full access to Insights
Subscribe to Realmo Intelligence
Open Analytics
Current Use
Location Intelligence
Trade Area within ½ mile
51
Businesses Nearby
Explore this area
Business Placement
Demographics for 46373, IN
17,839
Population
6,616
Households
2.7
Avg Household Size
44
Median Age
42%
College-Educated
94%
High-School Grad
10.9 sq mi
ZIP Area
1,637
Density / Sq Mi
$123,203
Median Household Income
$70,957
Median Earnings
$953
Median Rent
$375,300
Median Home Value
Check the figures for this property
Cap Rate, Value Estimation, Potential NOI and more
View Realmo Analytics


Frequently Asked Questions
What type of property is this?
Single family property - Move-in ready townhome features a sunroom, daylight basement with rough-in for a future bathroom, and an attached 2-car garage.
Where is this single family property located?
The property is located at 10877 Mathias Drive St John, IN.
What is the asking price?
The asking price for this property is $385,000.
What are key features of this property?
This property features: 2006‑built townhome with cathedral ceilings, high ceilings, and crown molding; Bright main living area plus sunroom for year‑round use; Daylight basement is roughed in for a future bathroom, offering expansion options


