Mid-Rise Apartment Building with Commercial
For Sale
$1,892,094
108 South Lincoln Street, Aberdeen, SD 57401
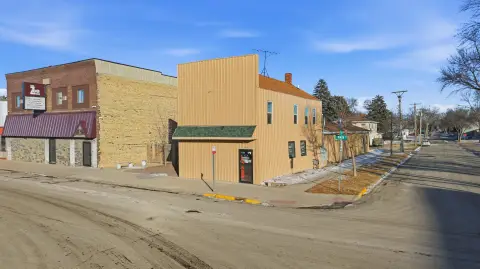
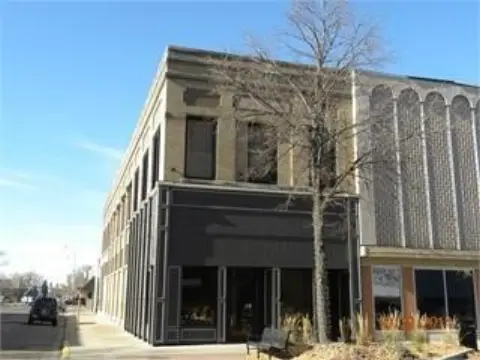
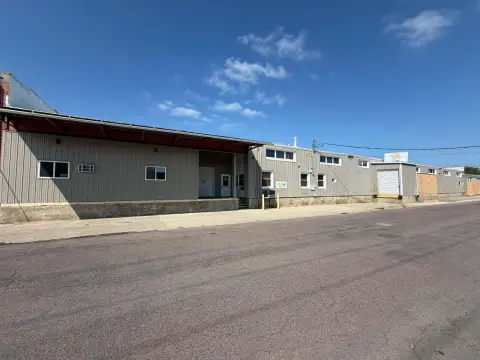
The property combines residential occupancy with two commercial units in a mid-rise configuration.
Property Size19,500 SF
Price / SF$97.03
Days on Market117
Property Features for 108 South Lincoln Street
General Information
Standard status
Active
Size
19,500 SF
Property subtype
Multifamily
Additional Details
Multifamily Units
14
Building Details
Building Size
19,500 SF
Buildings
1
Listing Agency:
eXp Realty
Listed By:
Todd Syhre · License #SD #20428
(605) 880-1575
Source:
7s
Added: Jun 25
Changed: Oct 6
Last Checked: Oct 16 at 7:57AM
Displayed information is deemed reliable but is not guaranteed and should be independently verified. All listing content including descriptions, pricing, images are the copyrighted material of eXp Realty

Ask AI about this property
Review the available facts, identify missing information and prepare questions for the agent.
Investment Insights
Based on property information with market context.
Located at 108 South Lincoln Street in Aberdeen, South Dakota, this 19,500-square-foot mid-rise property contains 14 residential units and two commercial units. The configuration brings multifamily housing and commercial space together within one building, creating a mixed-use income property with a substantial residential component.
The asset is identified as an apartment building and is offered for sale. Its address places the property in Aberdeen, SD, while the combination of residential and commercial units provides the defining physical characteristics of the offering.
The asset is identified as an apartment building and is offered for sale. Its address places the property in Aberdeen, SD, while the combination of residential and commercial units provides the defining physical characteristics of the offering.
Key Highlights
- 19,500 SF mid‑rise apartment building
- 14 residential units
- 2 commercial units
Financial Insights
Estimated NOI and Cap Rate
NOI / Yr
$152,831
Cap Rate
8.08%
Suggested Prices Based on Cap Rates
Cap Rate 5%
$3,056,620
$3.1M
Cap Rate 7%
$2,183,300
$2.2M
Cap Rate 9%
$1,698,122
$1.7M
Market Conditions
NOI Build-Up for 19,500 SF
Gross rent
$257.4K $13.20/SF
− Vacancy
−$12.9K −$0.66/SF
EGI
$244.5K $12.54/SF
− OpEx
−$91.7K −$4.70/SF
NOI
$152.8K $7.84/SF
Area
Brown County, SD
Vacancy
5.00%
Lease Rate
$13.20 /SF/Yr
Expense Ratio
37.50%
Simulate Cap Rate and NOI
Suggested Prices Based on Cap Rates
Cap Rate 5%
$3,056,620
Cap Rate 7%
$2,183,300
Cap Rate 9%
$1,698,122
Alternative Uses
Best Use
Mixed Use
$2.18M
$1.91M – $2.55M
NOI $152,831 @ 7.0% cap · market cap 8.08%
Second Best
Apartment 5plus
$1.34M
$1.17M – $1.56M
NOI $93,676 @ 7.0% cap · market cap 4.95%
Theoretical Best
Healthcare Medical
$3.40M
$2.98M – $3.97M
NOI $238,329 @ 7.0% cap · market cap 12.60%
Zoning and permitted uses should be independently verified with authorities.
How Realmo checks its estimates
Property Analytics
Current Use
Lease Details
14
Residential units
Location Intelligence
Trade Area within ½ mile
1,437
Businesses Nearby
Explore this area
Business Placement
Demographics for 57401, SD
32,275
Population
15,016
Households
2.1
Avg Household Size
37
Median Age
35%
College-Educated
93%
High-School Grad
278.8 sq mi
ZIP Area
116
Density / Sq Mi
$68,183
Median Household Income
$40,562
Median Earnings
$787
Median Rent
$216,300
Median Home Value
Market
Vacancy Rate% for Multifamily in Midwest region




Frequently Asked Questions
What type of property is this?
Apartment building - The property combines residential occupancy with two commercial units in a mid-rise configuration.
Where is this apartment building located?
The property is located at 108 South Lincoln Street Aberdeen, SD.
What is the asking price?
The asking price for this property is $1,892,094.
What are key features of this property?
This property features: 19,500 SF mid‑rise apartment building; 14 residential units; 2 commercial units


