Waterfront Multifamily with
For Sale
$2,500,000
10463 Jonestown Rd, Annville, PA 17003
Waterfront residential income property with multiple buildings, apartments, and an on-site Air B & B log house.
Property Size17,500 SF
Price / SF$142.86
Days on Market151
Property Features for 10463 Jonestown Rd
General Information
Standard status
Active
Size
17,500 SF
Additional Details
Multifamily Units
17
Amenities
coin operated laundry
workout room
beach access
camping pad
look-out house
private fire pit
parking
outdoor wood furnace
Building Details
Year Built
1900
Tenancy
Multi
Listing Agency:
TrueVision, REALTORS
Listed By:
DONALD R WALKER Jr. · License #RS323307
(717) 648-2587
Source:
Riverfoxrealty
Added: May 26
Changed: Oct 16
Last Checked: Oct 5 at 8:50PM
Displayed information is deemed reliable but is not guaranteed and should be independently verified. All listing content including descriptions, pricing, images are the copyrighted material of TrueVision, REALTORS

Ask AI about this property
Review the available facts, identify missing information and prepare questions for the agent.
Investment Insights
Based on property information with market context.
This waterfront property on the Swatara Creek includes four buildings totaling 17 apartments, plus an Air B & B log house and a separate elevated lookout house. Amenities on site include a coin-operated laundry and a workout room. Heating is provided by a large outdoor wood furnace serving three buildings with separately controlled zones, along with hot water for tenants during winter via the furnace and electric hot water during summer months.
The Air B & B log house overlooks the creek and is described as not being in a flood zone. The property also features beach access for boating, a camping pad on the creek with water and electric, and private creek access. Additional site features include plenty of parking and storage, as well as an outdoor fire pit area associated with the lookout house.
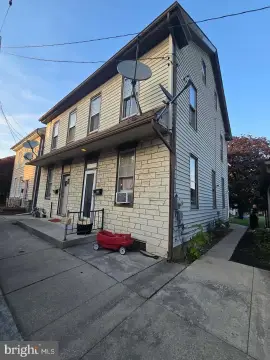
The main building is a Victorian-style structure known as the “Swatara Creek Inn,” converted into apartments with additional buildings added over time. The lookout house is newly built and over 40 feet high, with electricity, wide steps, and a deck.
The Air B & B log house overlooks the creek and is described as not being in a flood zone. The property also features beach access for boating, a camping pad on the creek with water and electric, and private creek access. Additional site features include plenty of parking and storage, as well as an outdoor fire pit area associated with the lookout house.
The main building is a Victorian-style structure known as the “Swatara Creek Inn,” converted into apartments with additional buildings added over time. The lookout house is newly built and over 40 feet high, with electricity, wide steps, and a deck.
Key Highlights
- Waterfront property on Swatara Creek with 4 buildings and 17 apartments plus an on‑site Air B&B log house
- Air B&B log house overlooks the creek and is stated to be not in a flood zone; rents vary by tourism season and are always full
- Large outdoor wood furnace heats 3 buildings with separately controlled zones; also heats hot water for tenants in winter
Financial Insights
Estimated NOI and Cap Rate
NOI / Yr
$145,322
Cap Rate
5.81%
Suggested Prices Based on Cap Rates
Cap Rate 5%
$2,906,440
$2.9M
Cap Rate 7%
$2,076,029
$2.1M
Cap Rate 9%
$1,614,689
$1.6M
Market Conditions
NOI Build-Up for 17,500 SF
Gross rent
$283.5K $16.20/SF
− Vacancy
−$19.3K −$1.10/SF
EGI
$264.2K $15.10/SF
− OpEx
−$118.9K −$6.79/SF
NOI
$145.3K $8.30/SF
Area
Lebanon County, PA
Vacancy
6.80%
Lease Rate
$16.20 /SF/Yr
Expense Ratio
45.00%
Simulate Cap Rate and NOI
Suggested Prices Based on Cap Rates
Cap Rate 5%
$2,906,440
Cap Rate 7%
$2,076,029
Cap Rate 9%
$1,614,689
Alternative Uses
Best Use
Apartment 5plus
$2.08M
$1.82M – $2.42M
NOI $145,322 @ 7.0% cap · market cap 5.81%
Second Best
—
—
no second resolved use
Theoretical Best
Office A
$4.11M
$3.59M – $4.79M
NOI $287,532 @ 7.0% cap · market cap 11.50%
Zoning and permitted uses should be independently verified with authorities.
How Realmo checks its estimates
Property Analytics
Who owns this building?
See the owner, sales and loan history
Open Analytics
Lease Details
17
Residential units
Multi-tenant
Tenancy
Location Intelligence
Trade Area within ½ mile
25
Businesses Nearby
Explore this area
Business Placement
Demographics for 17003, PA
12,329
Population
4,507
Households
2.7
Avg Household Size
40
Median Age
33%
College-Educated
93%
High-School Grad
42.7 sq mi
ZIP Area
289
Density / Sq Mi
$87,350
Median Household Income
$36,394
Median Earnings
$1,088
Median Rent
$242,200
Median Home Value
Check the figures for this property
Cap Rate, Value Estimation, Potential NOI and more
View Realmo Analytics
Market
Vacancy Rate% for Multifamily in Northeast region


Frequently Asked Questions
What type of property is this?
Apartment building - Waterfront residential income property with multiple buildings, apartments, and an on-site Air B & B log house.
Where is this apartment building located?
The property is located at 10463 Jonestown Rd Annville, PA.
What is the asking price?
The asking price for this property is $2,500,000.
What are key features of this property?
This property features: Waterfront property on Swatara Creek with 4 buildings and 17 apartments plus an on‑site Air B&B log house; Air B&B log house overlooks the creek and is stated to be not in a flood zone; rents vary by tourism season and are always full; Large outdoor wood furnace heats 3 buildings with separately controlled zones; also heats hot water for tenants in winter


