First-Floor Medical Office
For Sale
$189,000
103b-2138 Mendon Rd, Cumberland, RI 02864
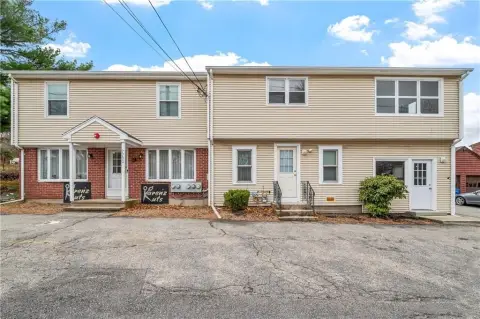
Vacant, move-in ready space within a fully occupied Class B medical building.
Property Size907 SF
Price / SF$208.38
Days on Market136
Property Features for 103b-2138 Mendon Rd
General Information
Standard status
Active
Size
907 SF
Class
Class B
Total Parking Spaces
120
Site & Location
Highway Access
Yes
Road Access
Yes
Additional Details
Floor
First Floor
HOA Fee
$397
Taxes and HOA fees
Annual Taxes
$3,036
Building Details
Buildings
1
Owner Occupied
No
Abandoned
No
Listing Agency:
Engel & Volkers Oceanside
(401) 638-0010
Listed By:
Sam Baldelli Hunt
(401) 500-6065
Source:
Exprealty
Added: Jun 1
Changed: Oct 14
Last Checked: Oct 12 at 11:35PM
Displayed information is deemed reliable but is not guaranteed and should be independently verified. All listing content including descriptions, pricing, images are the copyrighted material of Engel & Volkers Oceanside
Investment Insights
Based on property information with market context.
Suite 103B is a 907-square-foot medical office condominium on the first floor of Cumberland Medical Center. The space is vacant, configured for medical use, and available for immediate occupancy. The surrounding building is a fully occupied Class B medical property, providing an established professional setting for a practice or medical office user.
The property fronts Mendon Road, also designated Route 122, and has direct access from I-295. On-site parking includes 120 surface spaces, supporting convenient arrival for patients, staff, and visitors. The suite is located at 103B-2138 Mendon Rd in Cumberland, Rhode Island.
The property fronts Mendon Road, also designated Route 122, and has direct access from I-295. On-site parking includes 120 surface spaces, supporting convenient arrival for patients, staff, and visitors. The suite is located at 103B-2138 Mendon Rd in Cumberland, Rhode Island.
Key Highlights
- 907‑square‑foot first‑floor medical suite
- Vacant and available for immediate occupancy
- Located within a fully occupied Class B medical building
Financial Insights
Estimated NOI and Cap Rate
NOI / Yr
$11,724
Cap Rate
6.20%
Suggested Prices Based on Cap Rates
Cap Rate 5%
$234,480
$234.5K
Cap Rate 7%
$167,486
$167.5K
Cap Rate 9%
$130,267
$130.3K
Market Conditions
NOI Build-Up for 907 SF
Gross rent
$18.2K $20.04/SF
− Vacancy
−$2.5K −$2.81/SF
EGI
$15.6K $17.23/SF
− OpEx
−$3.9K −$4.31/SF
NOI
$11.7K $12.93/SF
Area
Providence County, RI
Vacancy
14.00%
Lease Rate
$20.04 /SF/Yr
Expense Ratio
25.00%
Simulate Cap Rate and NOI
Suggested Prices Based on Cap Rates
Cap Rate 5%
$234,480
Cap Rate 7%
$167,486
Cap Rate 9%
$130,267
Alternative Uses
Best Use
Office B
$167.5K
$146.6K – $195.4K
NOI $11,724 @ 7.0% cap · market cap 6.20%
Second Best
Healthcare Medical
$125.6K
$109.9K – $146.5K
NOI $8,789 @ 7.0% cap · market cap 4.65%
Theoretical Best
Multifamily LT 5
$215.7K
$188.8K – $251.7K
NOI $15,102 @ 7.0% cap · market cap 7.99%
Zoning and permitted uses should be independently verified with authorities.
How Realmo checks its estimates
Property Analytics
Current Use
Lease Details
Yes
Highway access
Yes
Paved road access
Location Intelligence
Trade Area within ½ mile
261
Businesses Nearby
Under-served
Demand for This Use
Explore this area
Business Placement
Demographics for 02864, RI
36,376
Population
14,735
Households
2.5
Avg Household Size
43
Median Age
43%
College-Educated
92%
High-School Grad
26.5 sq mi
ZIP Area
1,373
Density / Sq Mi
$118,737
Median Household Income
$62,041
Median Earnings
$1,251
Median Rent
$394,800
Median Home Value
Market
Vacancy Rate% for Office in Northeast region

Questions? Ask Rey
Realmo’s AI knows this listing — price, zoning, demand, history. Ask anything.




Frequently Asked Questions
What type of property is this?
Medical Office Space - Vacant, move-in ready space within a fully occupied Class B medical building.
Where is this medical office space located?
The property is located at 103b-2138 Mendon Rd Cumberland, RI.
What is the asking price?
The asking price for this property is $189,000.
What are key features of this property?
This property features: 907‑square‑foot first‑floor medical suite; Vacant and available for immediate occupancy; Located within a fully occupied Class B medical building


