Renovated Two-Story Mixed-Use
For Sale
$1,350,000
1028 Broadway, Bethlehem, PA 18015
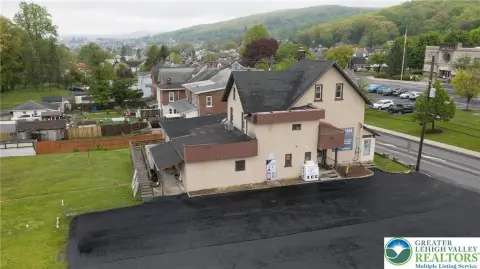
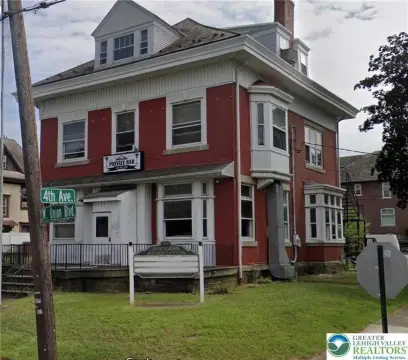
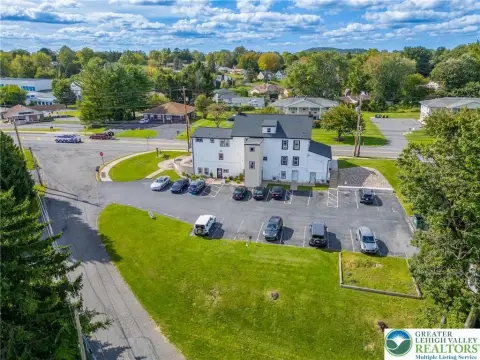
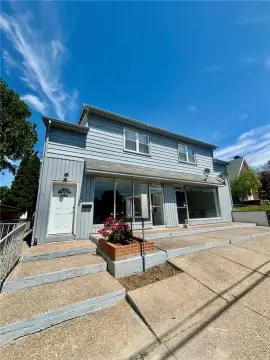
Includes a commercial kitchen, bar areas, and an upper-level deck.
Property Size4,130 SF
Days on Market52
Property Features for 1028 Broadway
General Information
Standard status
Active
Size
4,130 SF
Property subtype
Mixed Use
Additional Details
Patio
Yes
Taxes and HOA fees
Annual Taxes
$9,746
Building Details
Building Size
4,130 SF
Year Built
1900
Buildings
1
Stories
2
Listing Agency:
I-Do Real Estate
Listed By:
Mario Peralta
(484) 633-8028
Source:
Bhhspaulfordrealtors
Added: Aug 23
Changed: Oct 3
Last Checked: Oct 13 at 1:17AM
Displayed information is deemed reliable but is not guaranteed and should be independently verified. All listing content including descriptions, pricing, images are the copyrighted material of I-Do Real Estate
Investment Insights
Based on property information with market context.
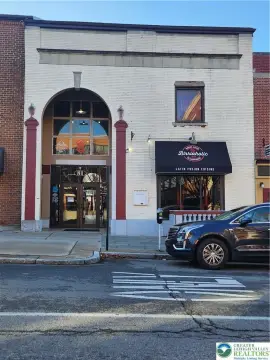
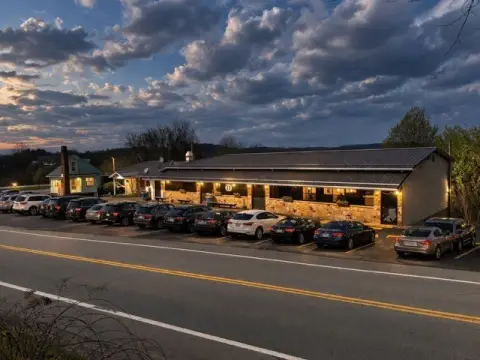
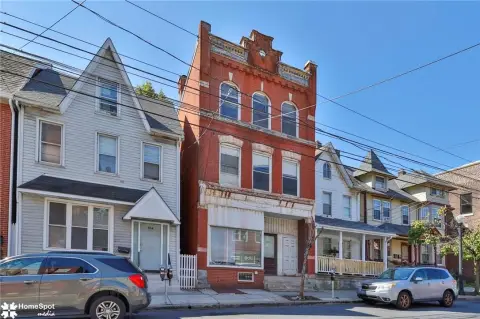
Built in 1900 and renovated, this two-story mixed-use commercial building combines historic materials with specialized hospitality improvements. Interior features include stone walls, hardwood floors, custom bar areas, and a commercial kitchen. An upper-level deck adds outdoor space for seating and entertainment.
The property is located at 1028 Broadway in Fountain Hill Boro, Pennsylvania. Its existing configuration may accommodate a restaurant, upscale lounge, event venue, banquet hall, or another creative commercial concept, subject to zoning and municipal approval.
The property is located at 1028 Broadway in Fountain Hill Boro, Pennsylvania. Its existing configuration may accommodate a restaurant, upscale lounge, event venue, banquet hall, or another creative commercial concept, subject to zoning and municipal approval.
Key Highlights
- Renovated two‑story commercial building built in 1900
- Commercial kitchen with custom bar areas
- Upper‑level deck for outdoor seating and entertainment
Financial Insights
Estimated NOI and Cap Rate
NOI / Yr
$42,838
Cap Rate
3.17%
Suggested Prices Based on Cap Rates
Cap Rate 5%
$856,760
$856.8K
Cap Rate 7%
$611,971
$612.0K
Cap Rate 9%
$475,978
$476.0K
Market Conditions
NOI Build-Up for 4,130 SF
Gross rent
$62.0K $15.00/SF
− Vacancy
−$4.8K −$1.17/SF
EGI
$57.1K $13.83/SF
− OpEx
−$14.3K −$3.46/SF
NOI
$42.8K $10.37/SF
Area
Northampton County, PA
Vacancy
7.80%
Lease Rate
$15.00 /SF/Yr
Expense Ratio
25.00%
Simulate Cap Rate and NOI
Suggested Prices Based on Cap Rates
Cap Rate 5%
$856,760
Cap Rate 7%
$611,971
Cap Rate 9%
$475,978
Alternative Uses
Best Use
Specialty Retail
$612.0K
$535.5K – $714.0K
NOI $42,838 @ 7.0% cap · market cap 3.17%
Second Best
Mixed Use
$597.4K
$522.7K – $696.9K
NOI $41,816 @ 7.0% cap · market cap 3.10%
Theoretical Best
Office A
$783.3K
$685.4K – $913.9K
NOI $54,833 @ 7.0% cap · market cap 4.06%
Zoning and permitted uses should be independently verified with authorities.
How Realmo checks its estimates
Property Analytics
Current Use
Location Intelligence
Trade Area within ½ mile
1,579
Businesses Nearby
33k
Monthly Visits Nearby
Explore this area
Business Placement
Foot Traffic Nearby
Dining 72%
Shops & Services 28%
McDonald's
Dining
23,780 visits/mo
0.5 miles
TD Bank
Shops & Services
6,181 visits/mo
0.4 miles
AutoZone
Shops & Services
2,935 visits/mo
0.4 miles
Demographics for 18015, PA
33,286
Population
12,867
Households
2.6
Avg Household Size
32
Median Age
31%
College-Educated
87%
High-School Grad
23.2 sq mi
ZIP Area
1,435
Density / Sq Mi
$58,470
Median Household Income
$32,703
Median Earnings
$1,310
Median Rent
$243,100
Median Home Value
Market
Vacancy Rate% for Retail in Northeast region

Questions? Ask Rey
Realmo’s AI knows this listing — price, zoning, demand, history. Ask anything.




Frequently Asked Questions
What type of property is this?
Mixed-use property - Includes a commercial kitchen, bar areas, and an upper-level deck.
Where is this mixed-use property located?
The property is located at 1028 Broadway Bethlehem, PA.
What is the asking price?
The asking price for this property is $1,350,000.
What are key features of this property?
This property features: Renovated two‑story commercial building built in 1900; Commercial kitchen with custom bar areas; Upper‑level deck for outdoor seating and entertainment


