Two-Level Residential Income
For Sale
$599,000
1024 MASSACHUSETTS AVENUE NE Unit 3, Washington, DC 20002
Two-bedroom condominium with private access, flexible living space, and townhouse-style outdoor entry.
Property Size1,180 SF
Price / SF$507.63
Days on Market129
Property Features for 1024 MASSACHUSETTS AVENUE NE Unit 3
General Information
Standard status
Active
Size
1,180 SF
Property subtype
Unit/Flat/Apartment
Additional Details
Road Access
Yes
Multifamily Units
1
Taxes and HOA fees
Annual Taxes
$5,227
Building Details
Building Size
1,180 SF
Year Built
1908
Listing Agency:
Keller Williams Capital Properties
Listed By:
David F Thomas · License #BR98374505
(202) 486-5918
Source:
Kerishull
Added: Jun 12
Changed: Oct 10
Last Checked: Oct 16 at 5:37PM
Displayed information is deemed reliable but is not guaranteed and should be independently verified. All listing content including descriptions, pricing, images are the copyrighted material of Keller Williams Capital Properties

Ask AI about this property
Review the available facts, identify missing information and prepare questions for the agent.
Investment Insights
Based on property information with market context.
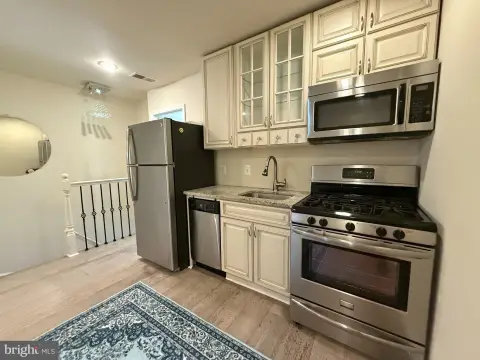
This 1,180 SF residential income property is a two-level condominium within The Chatham, a nine-unit boutique building constructed in 1908. The main level includes refinished hardwood flooring, a living room with a wood-burning fireplace, bay window, built-in bookcase, and recessed lighting. The kitchen features upgraded countertops, newer stainless steel appliances, a built-in banquette, and a walk-in closet, with a powder room nearby.
Upstairs are two bedrooms, including a primary bedroom with a bay window, along with a hall bath, storage, additional built-ins, and a utility closet containing a stacked front-loading washer and dryer. The property also offers split-unit HVAC, recent electrical upgrades, a brick patio, and a separate entrance from 11th Street. The building is less than a block from Lincoln Park and is near Stanton Park and Eastern Market. Pets are permitted.
Upstairs are two bedrooms, including a primary bedroom with a bay window, along with a hall bath, storage, additional built-ins, and a utility closet containing a stacked front-loading washer and dryer. The property also offers split-unit HVAC, recent electrical upgrades, a brick patio, and a separate entrance from 11th Street. The building is less than a block from Lincoln Park and is near Stanton Park and Eastern Market. Pets are permitted.
Key Highlights
- 1,180 SF two‑level condominium in The Chatham, a nine‑unit building
- Two bedrooms with two bathrooms, built‑ins, and walk‑in closets
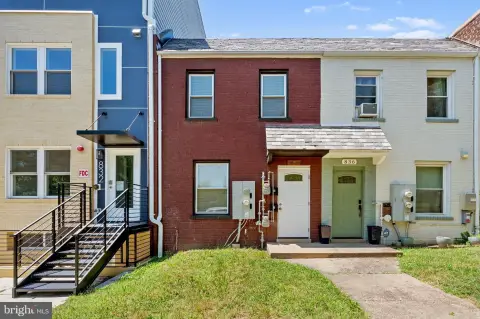
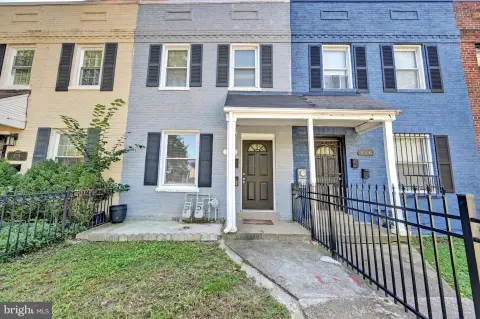
- Private 11th Street entrance with brick patio and townhouse‑style access
Financial Insights
Estimated NOI and Cap Rate
NOI / Yr
$20,089
Cap Rate
3.35%
Suggested Prices Based on Cap Rates
Cap Rate 5%
$401,780
$401.8K
Cap Rate 7%
$286,986
$287.0K
Cap Rate 9%
$223,211
$223.2K
Market Conditions
NOI Build-Up for 1,180 SF
Gross rent
$38.9K $33.00/SF
− Vacancy
−$2.4K −$2.05/SF
EGI
$36.5K $30.95/SF
− OpEx
−$16.4K −$13.93/SF
NOI
$20.1K $17.02/SF
Area
ZIP 20002
Vacancy
6.20%
Lease Rate
$33.00 /SF/Yr
Expense Ratio
45.00%
Simulate Cap Rate and NOI
Suggested Prices Based on Cap Rates
Cap Rate 5%
$401,780
Cap Rate 7%
$286,986
Cap Rate 9%
$223,211
Alternative Uses
Best Use
Apartment 5plus
$287.0K
$251.1K – $334.8K
NOI $20,089 @ 7.0% cap · market cap 3.35%
Second Best
—
—
no second resolved use
Theoretical Best
Office A
$609.2K
$533.1K – $710.8K
NOI $42,647 @ 7.0% cap · market cap 7.12%
Zoning and permitted uses should be independently verified with authorities.
How Realmo checks its estimates
Property Analytics
Unlock full access to Insights
Subscribe to Realmo Intelligence
Open Analytics
Current Use
Lease Details
1
Residential units
Yes
Paved road access
Location Intelligence
Trade Area within ½ mile
3,392
Businesses Nearby
Explore this area
Business Placement
Demographics for 20002, DC
69,422
Population
38,459
Households
1.8
Avg Household Size
33
Median Age
70%
College-Educated
95%
High-School Grad
5.1 sq mi
ZIP Area
13,612
Density / Sq Mi
$114,482
Median Household Income
$82,909
Median Earnings
$2,140
Median Rent
$813,700
Median Home Value
Check the figures for this property
Cap Rate, Value Estimation, Potential NOI and more
View Realmo Analytics




Frequently Asked Questions
What type of property is this?
Residential income property - Two-bedroom condominium with private access, flexible living space, and townhouse-style outdoor entry.
Where is this residential income property located?
The property is located at 1024 MASSACHUSETTS AVENUE NE Unit 3 Washington, DC.
What is the asking price?
The asking price for this property is $599,000.
What are key features of this property?
This property features: 1,180 SF two‑level condominium in The Chatham, a nine‑unit building; Two bedrooms with two bathrooms, built‑ins, and walk‑in closets; Private 11th Street entrance with brick patio and townhouse‑style access


