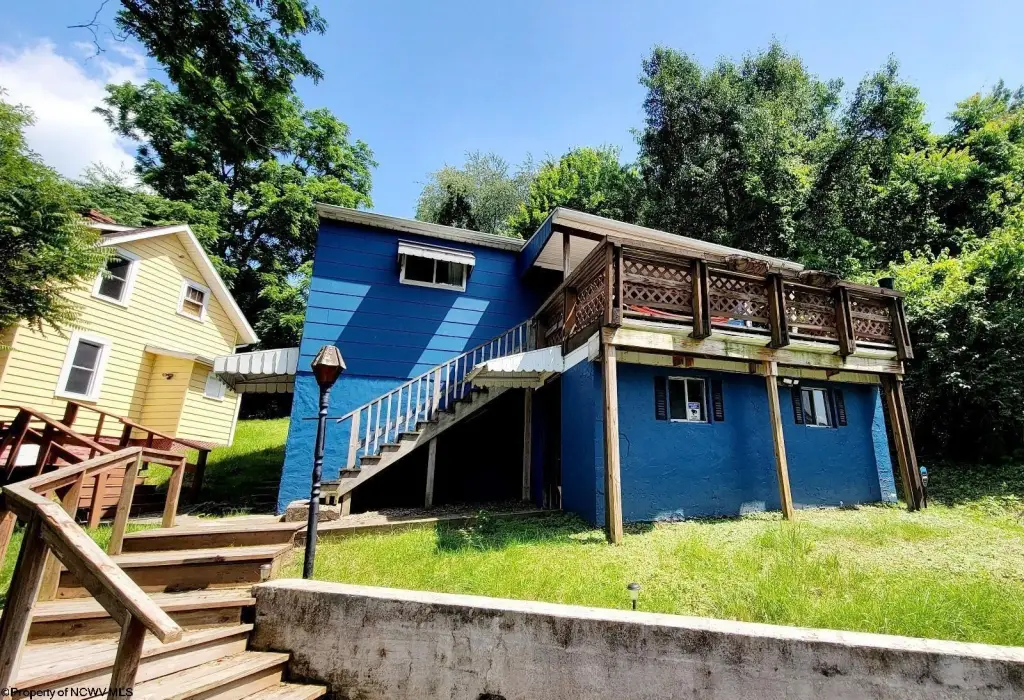
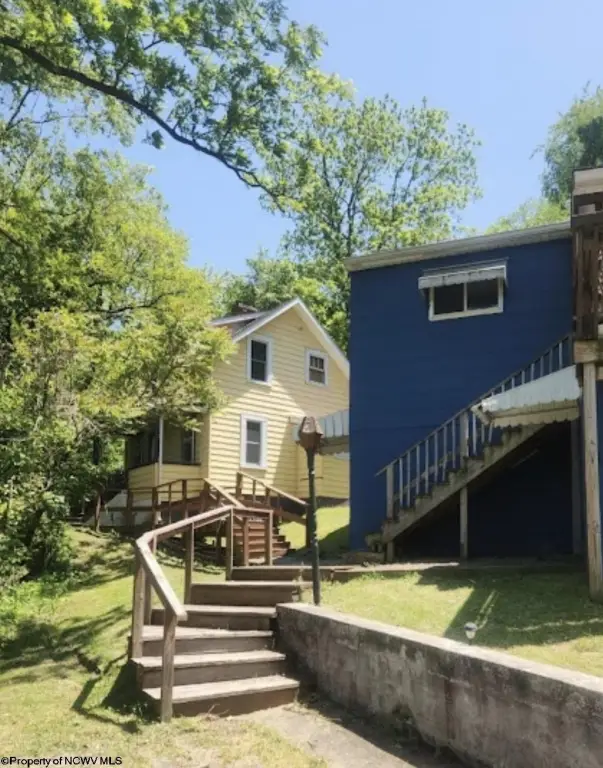
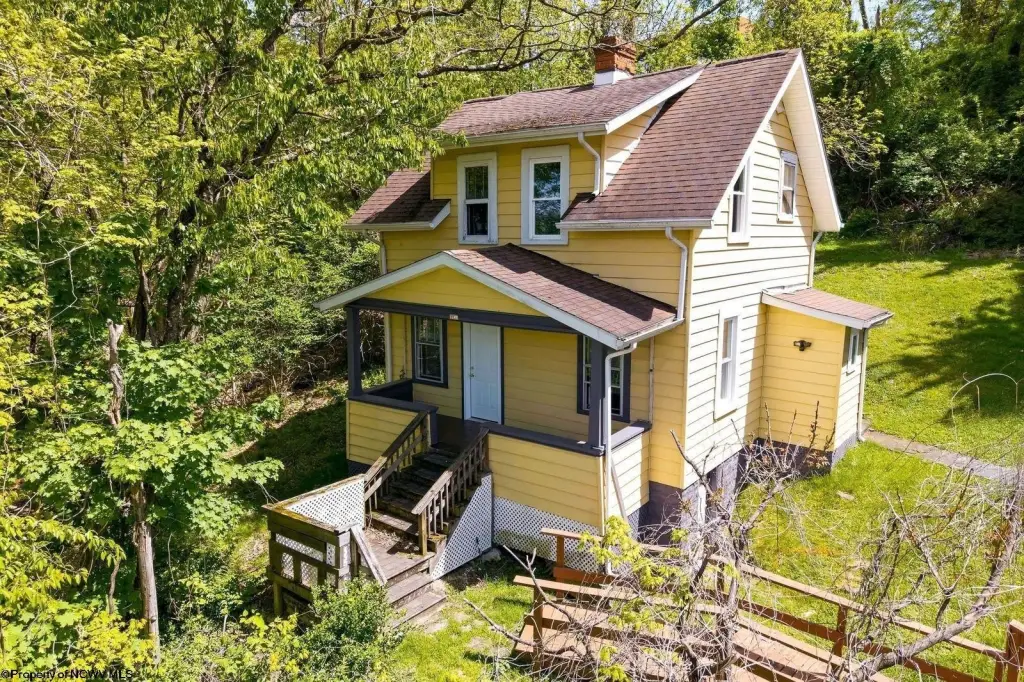
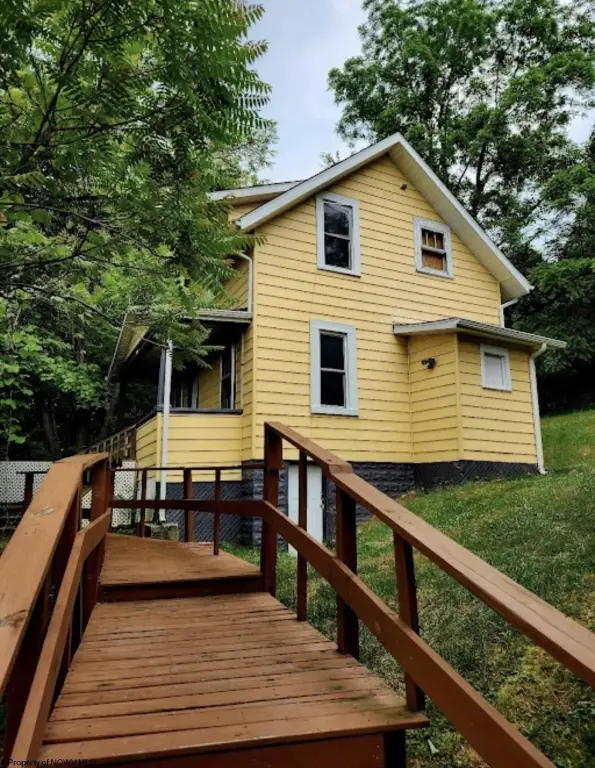
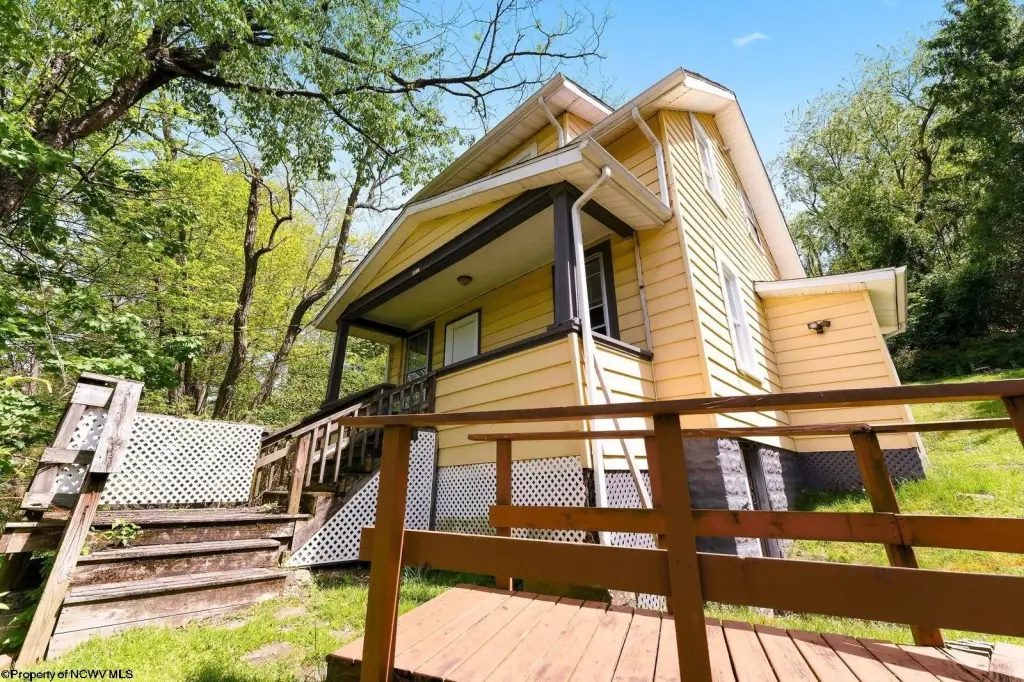
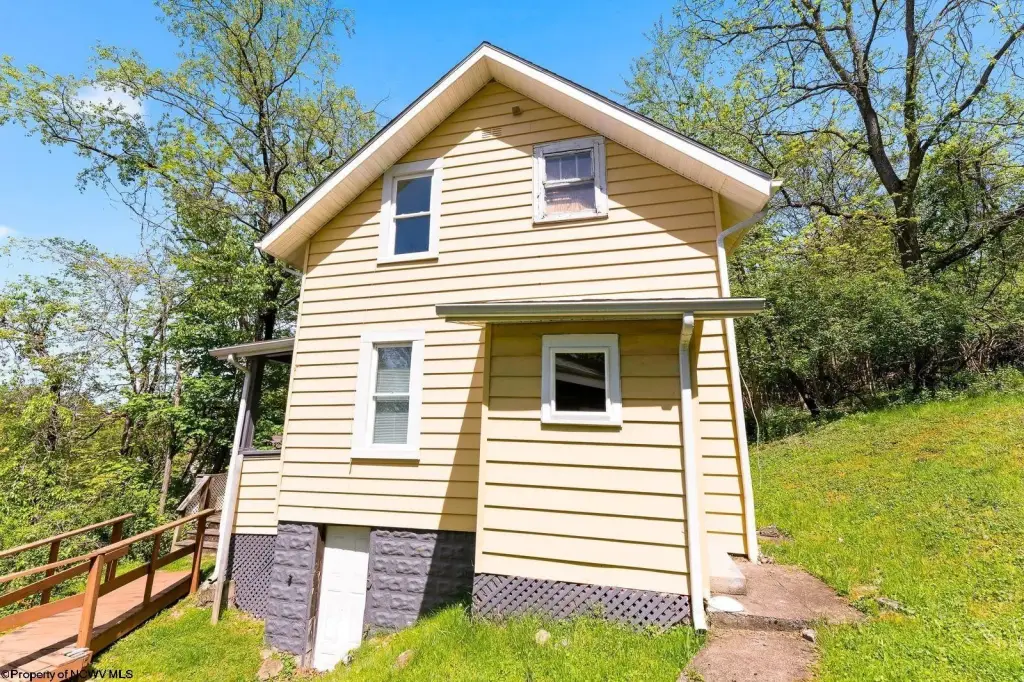
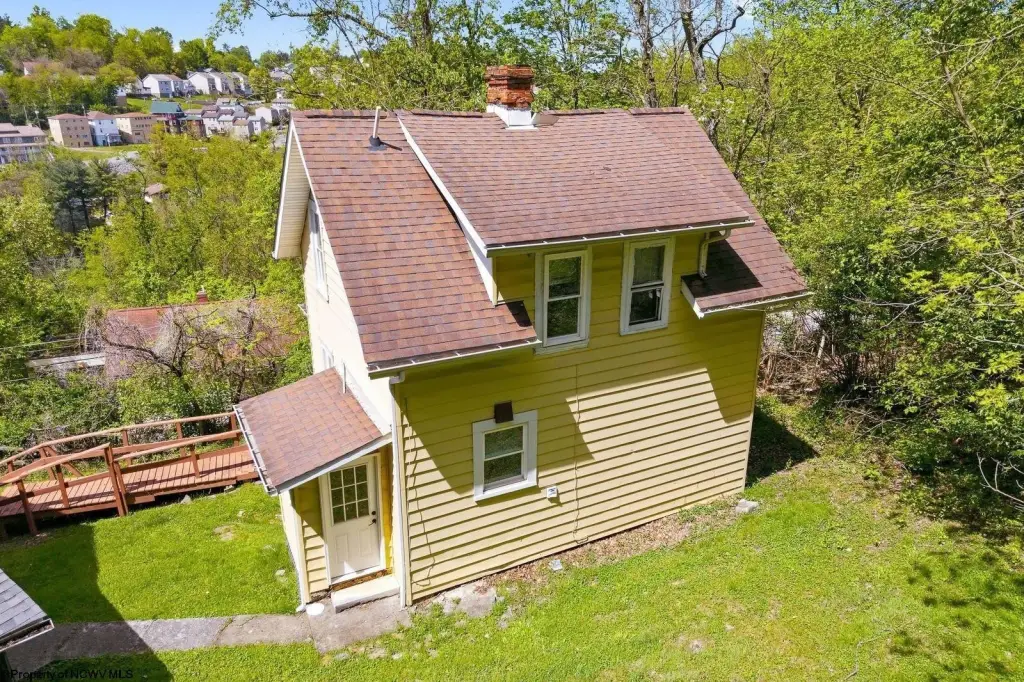
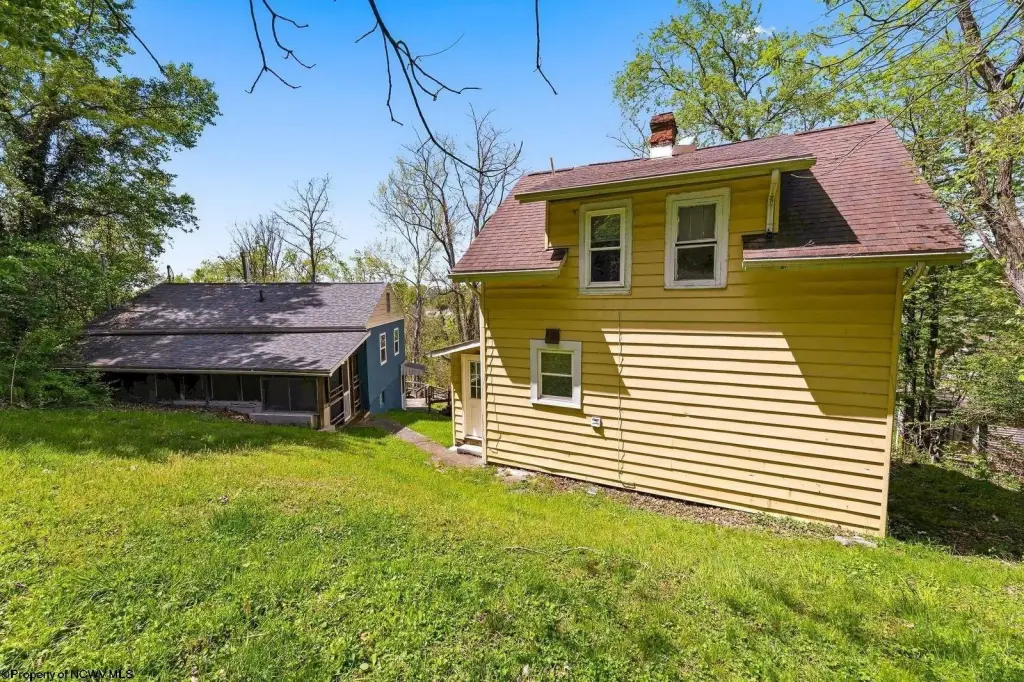
Fully Leased Duplex
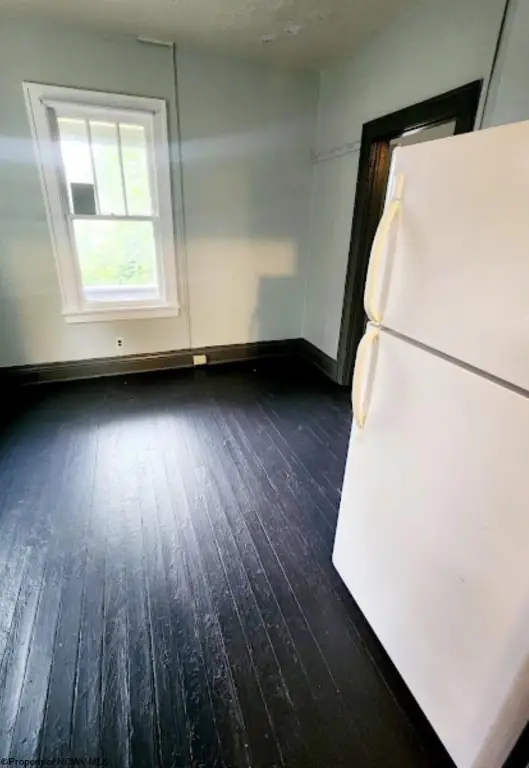
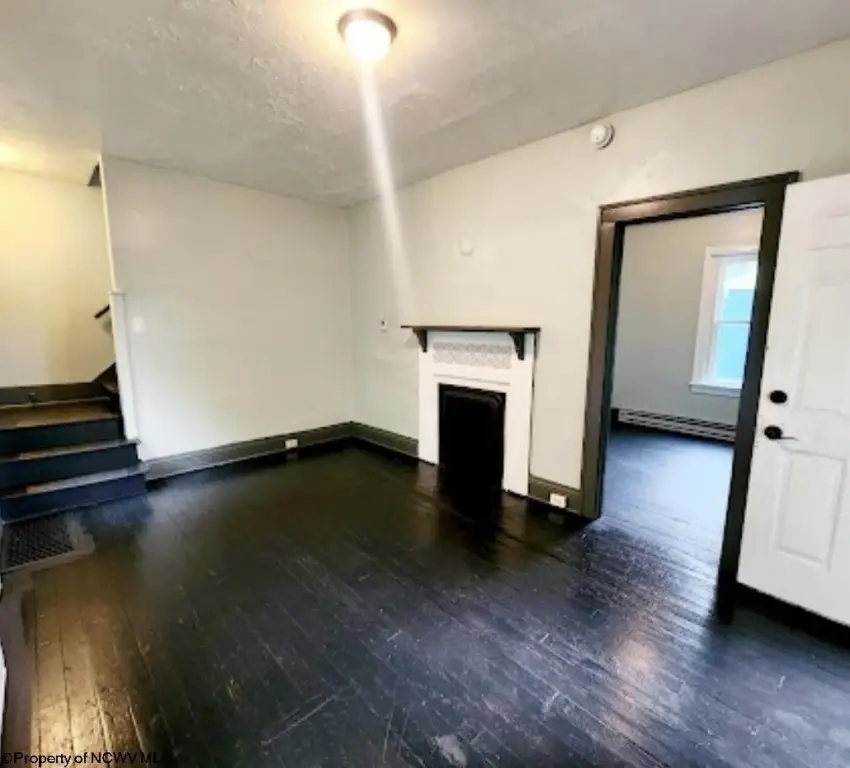
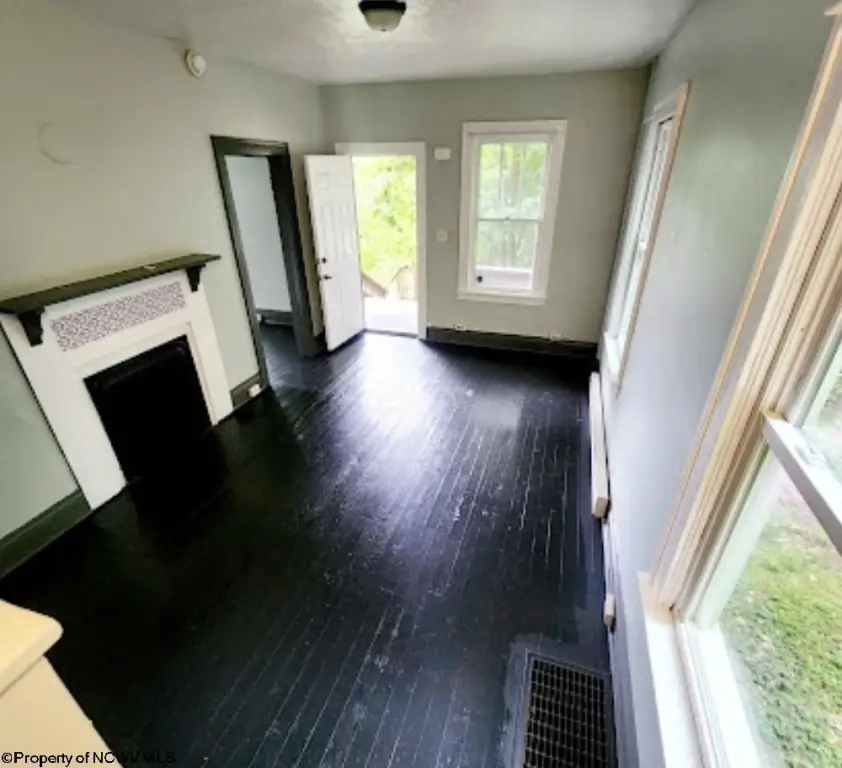
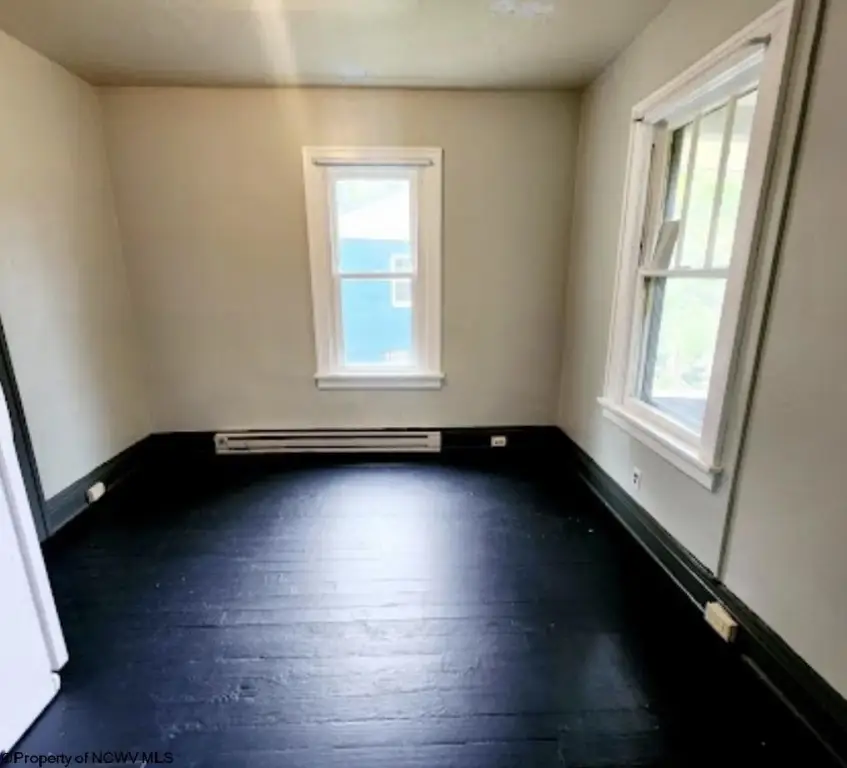
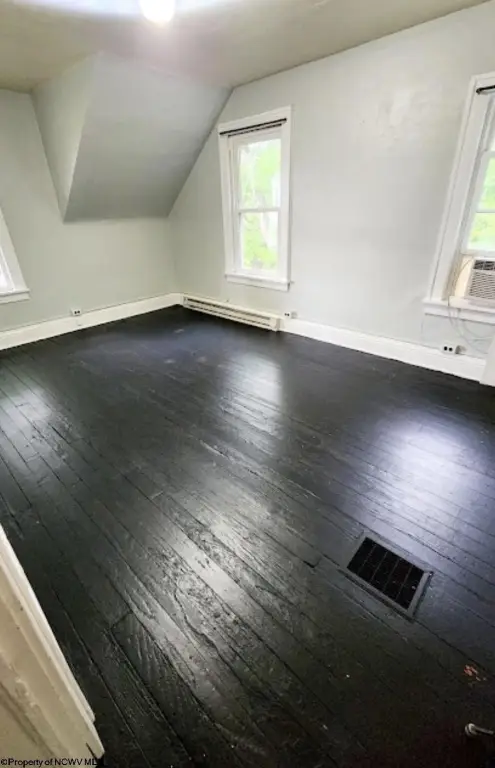
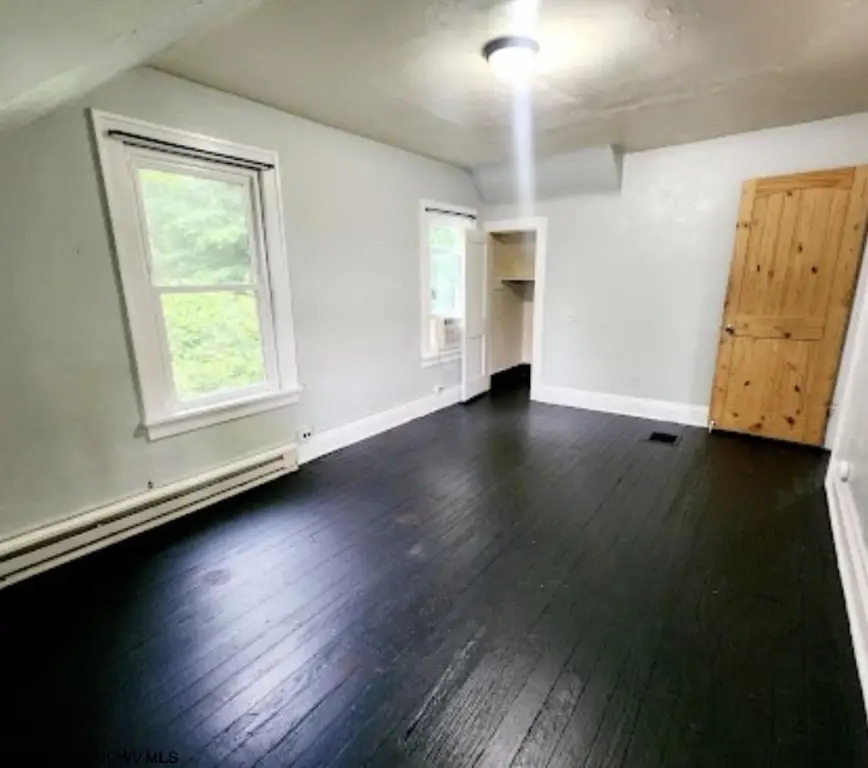
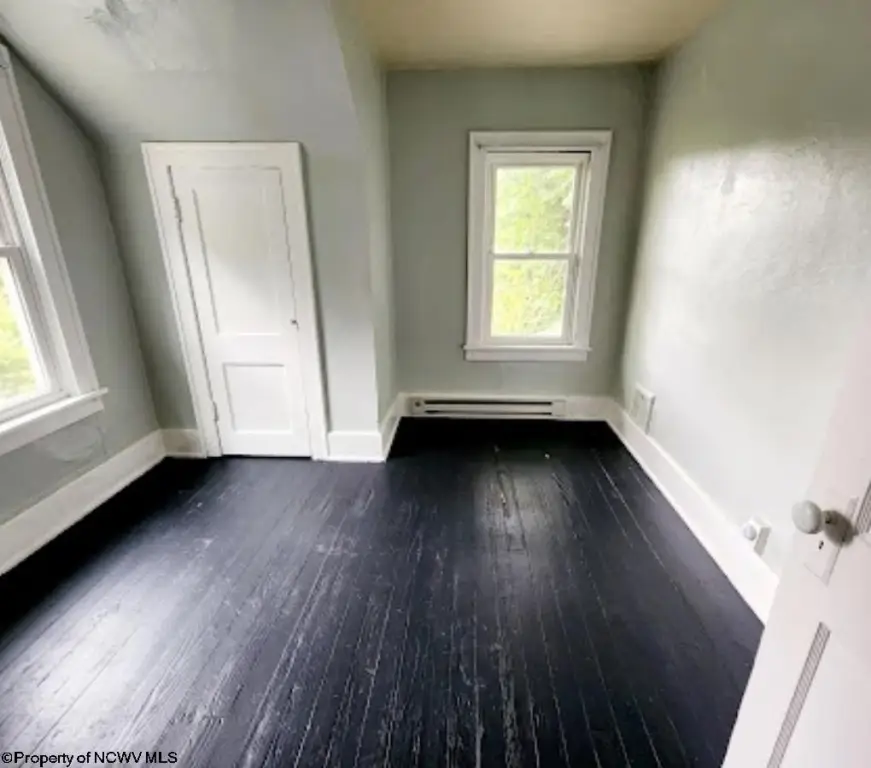
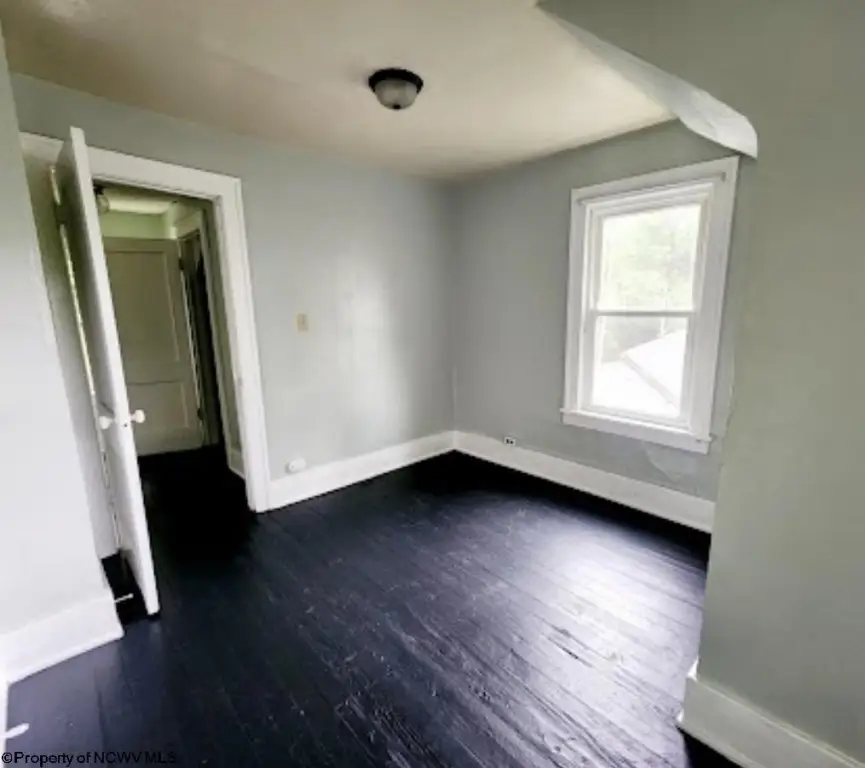
For Sale
Under Contract
$215,000
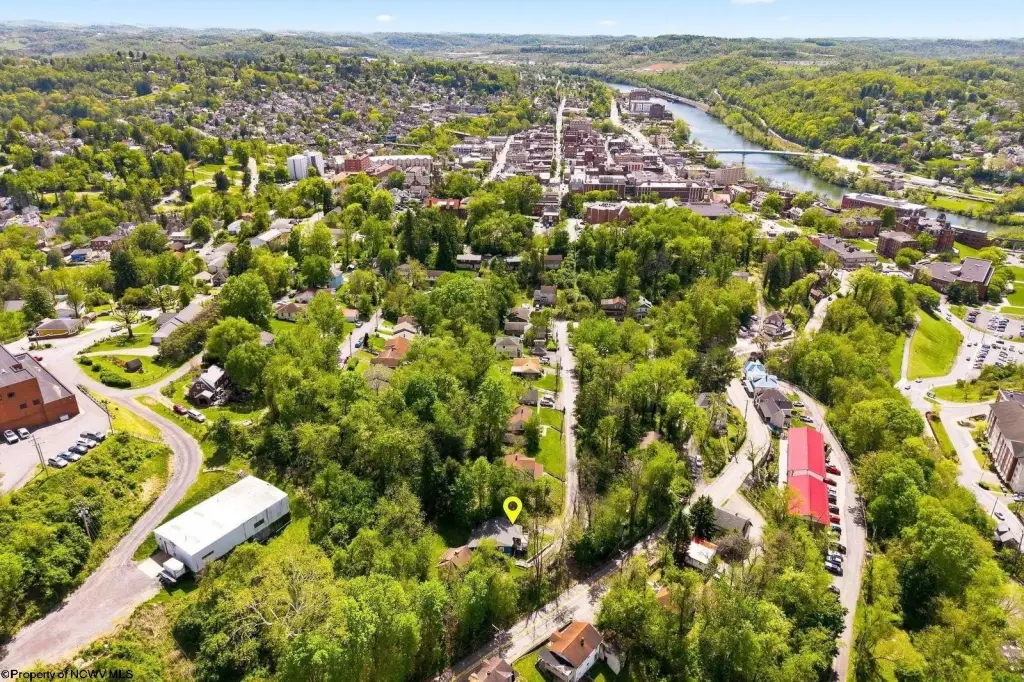
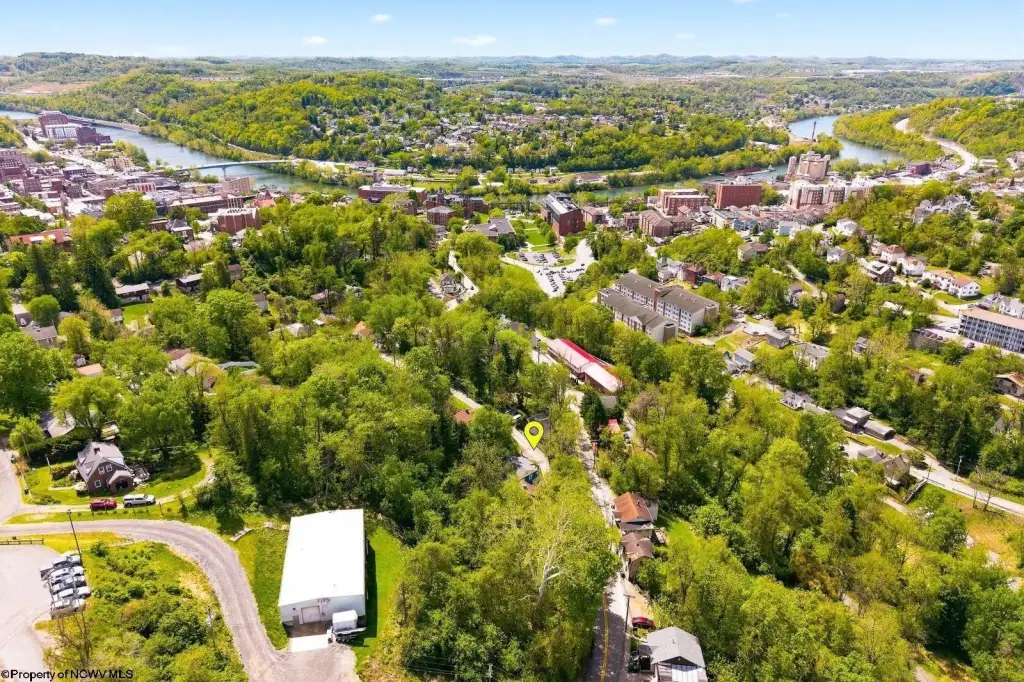
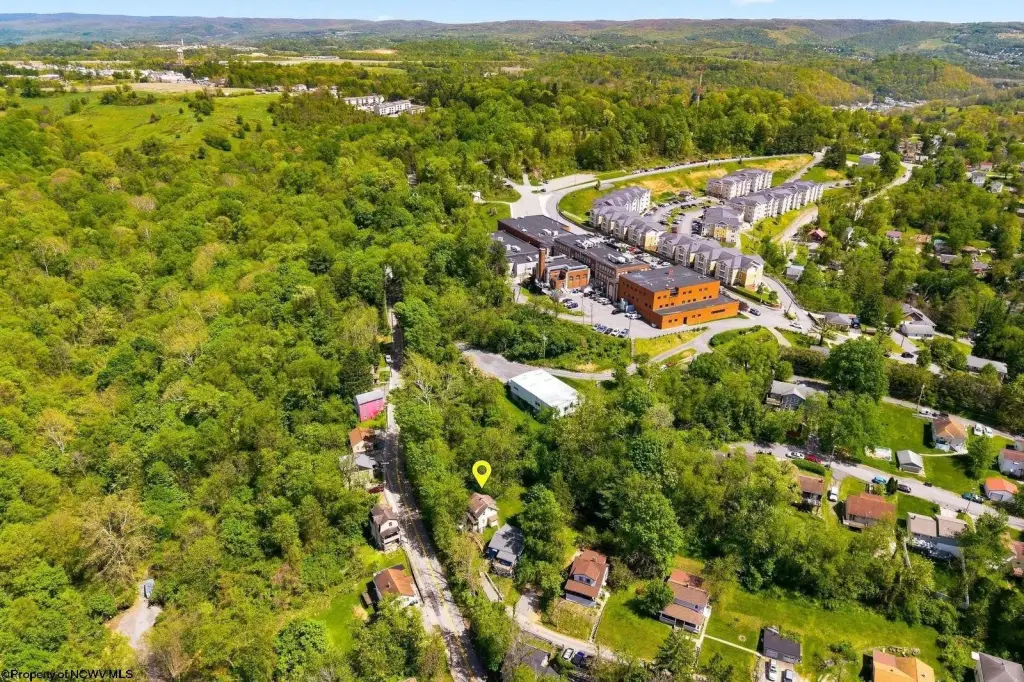
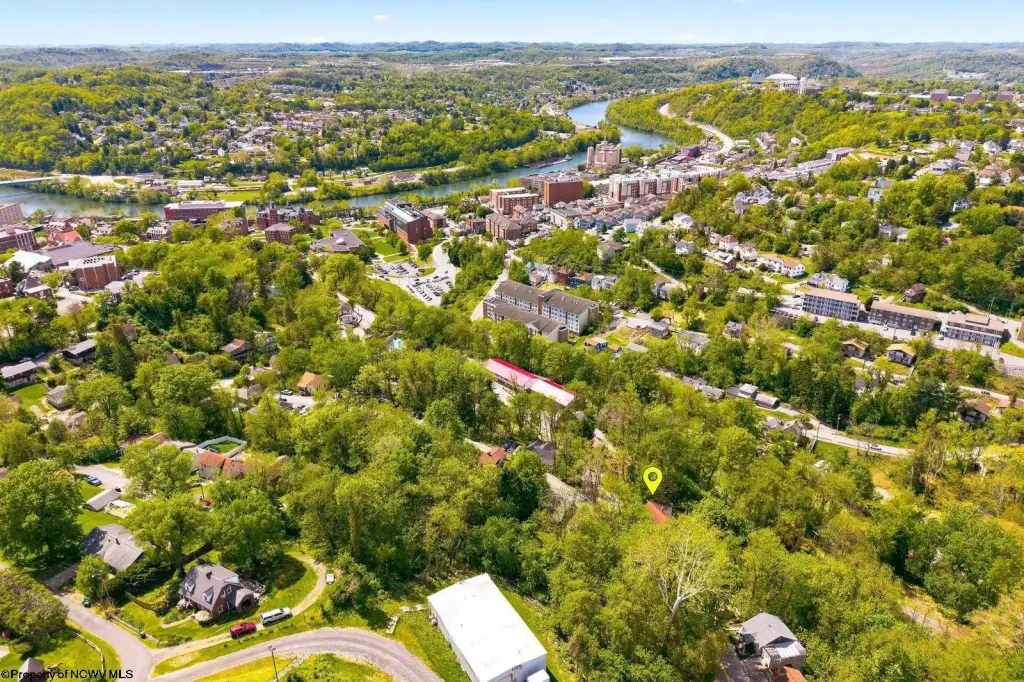
1024 Cayton Street, Morgantown, WV 26505
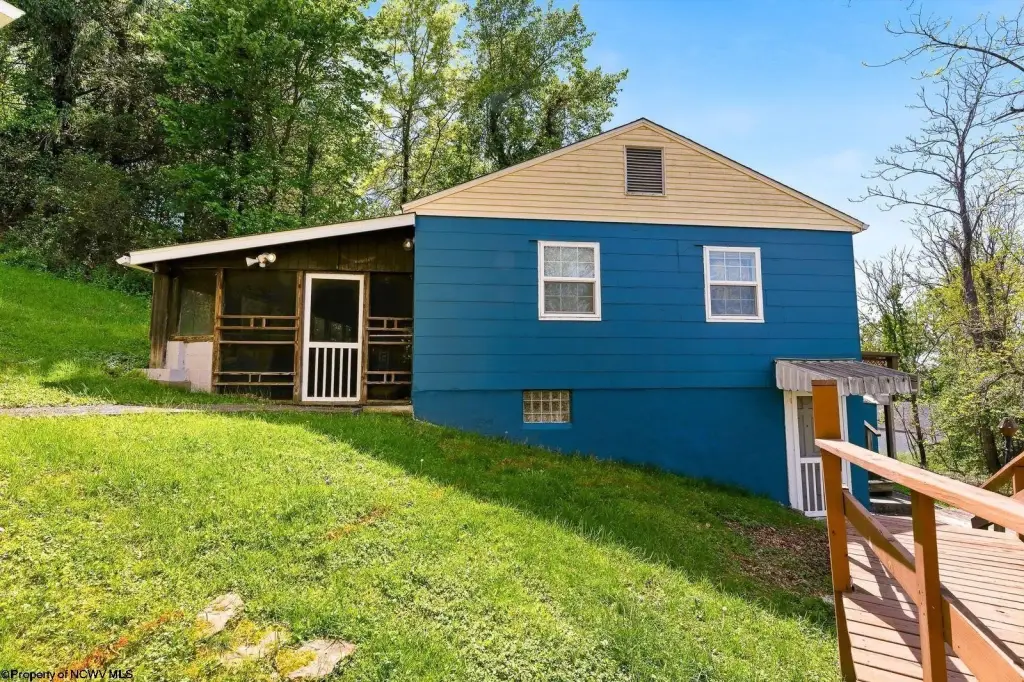
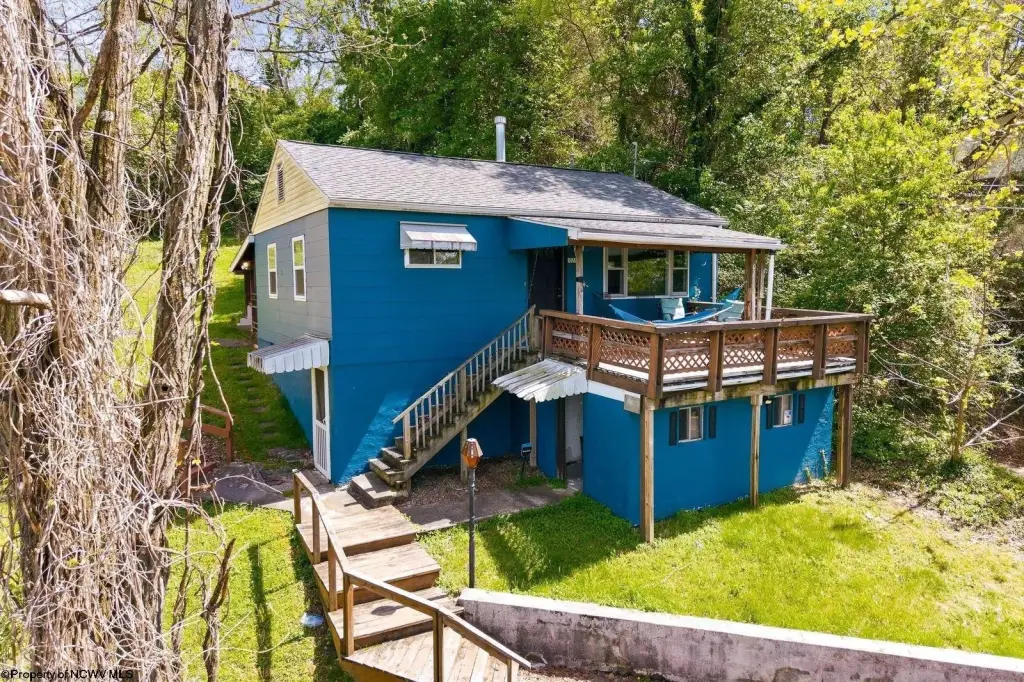
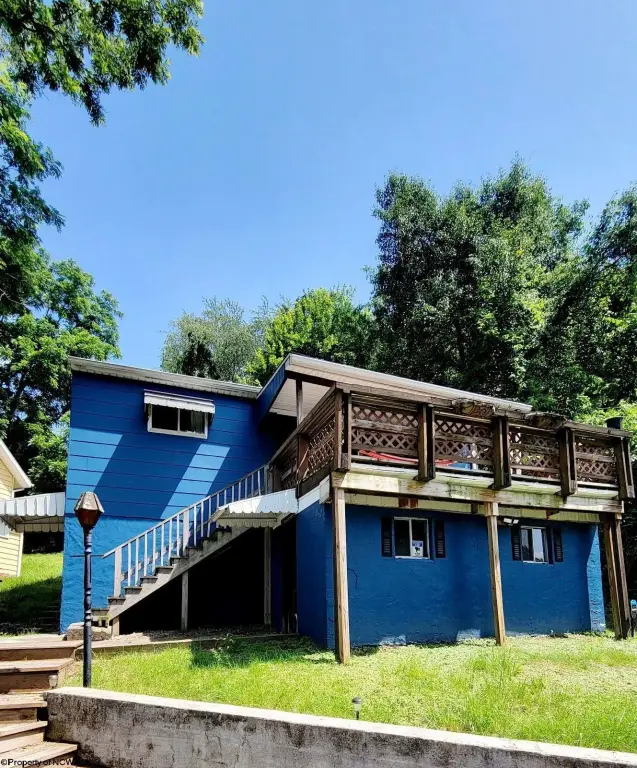
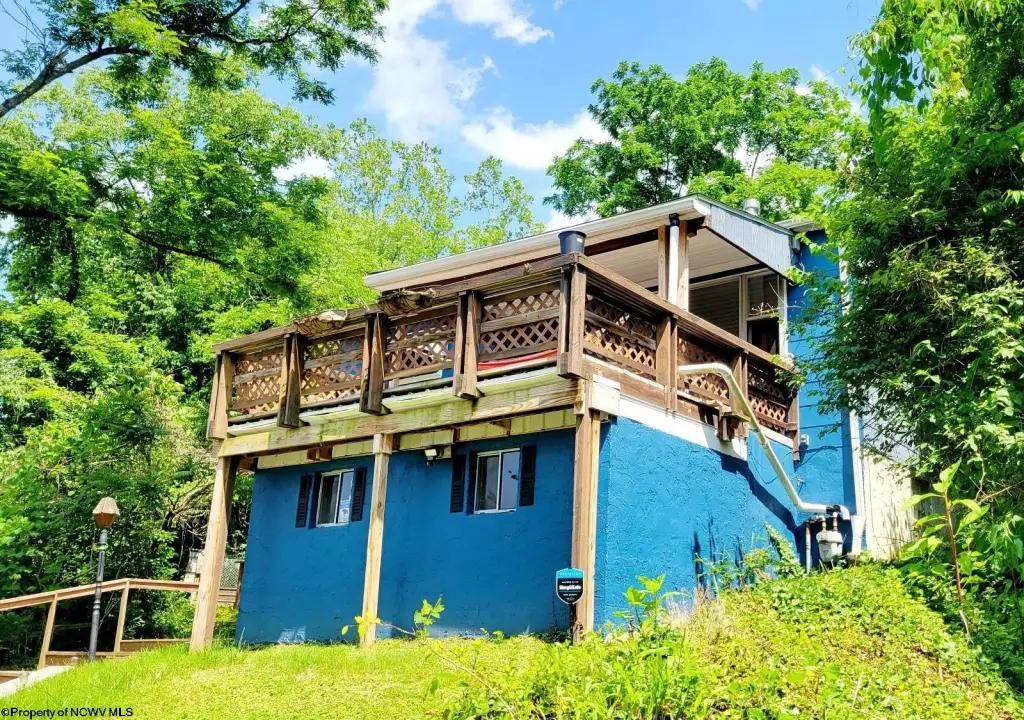
Multi-Unit/Income, Raised Ranch, Two Story, Morgantown, WV
Property Size1,580 SF
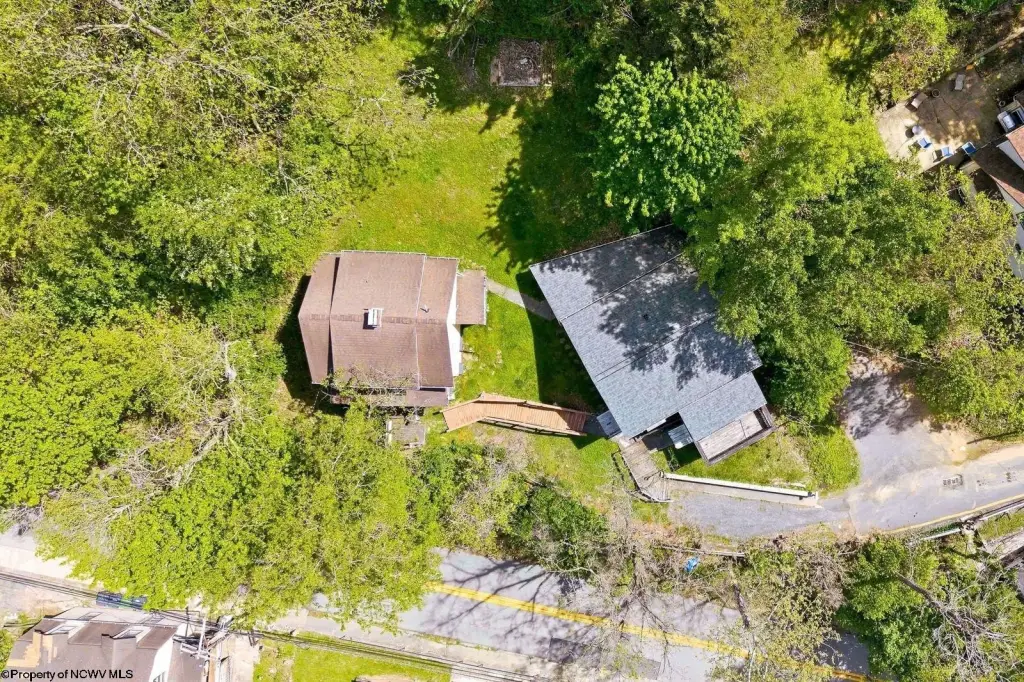
Lot Size0.29 Acres
Price / SF$136.08
Days on Market146
Property Features for 1024 Cayton Street
General Information
Property type
Residential Multi Family
Property subtype
Other
Zoning
Neighborhood Residential
Bedrooms
4
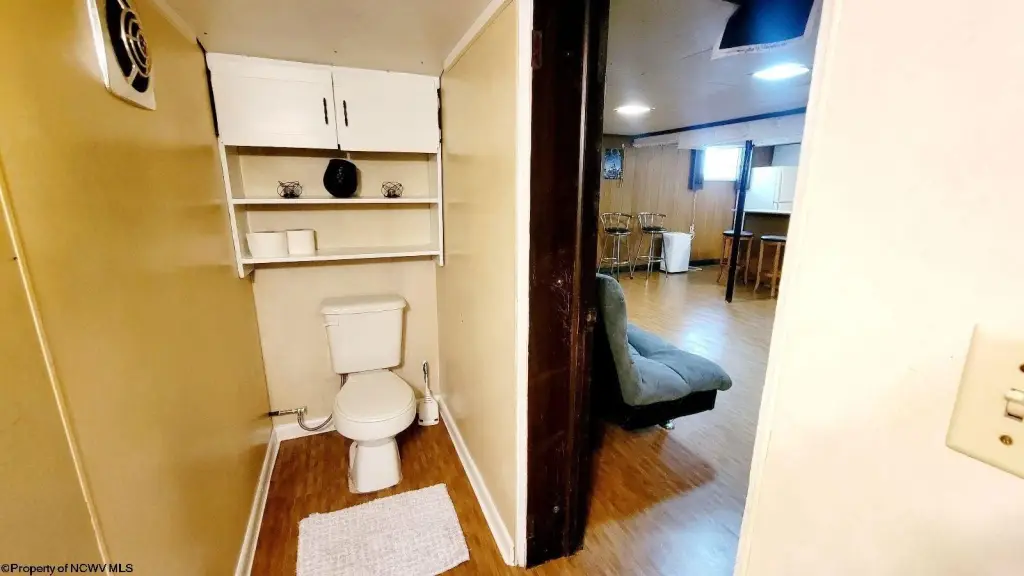
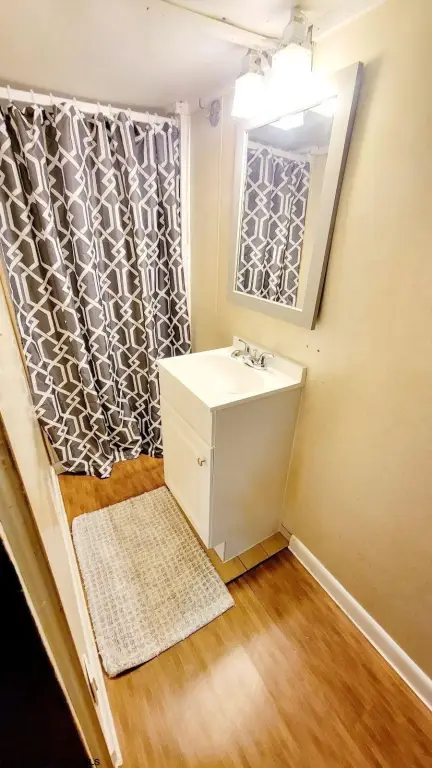
Bathrooms
3
Full bathrooms
3
Rooms
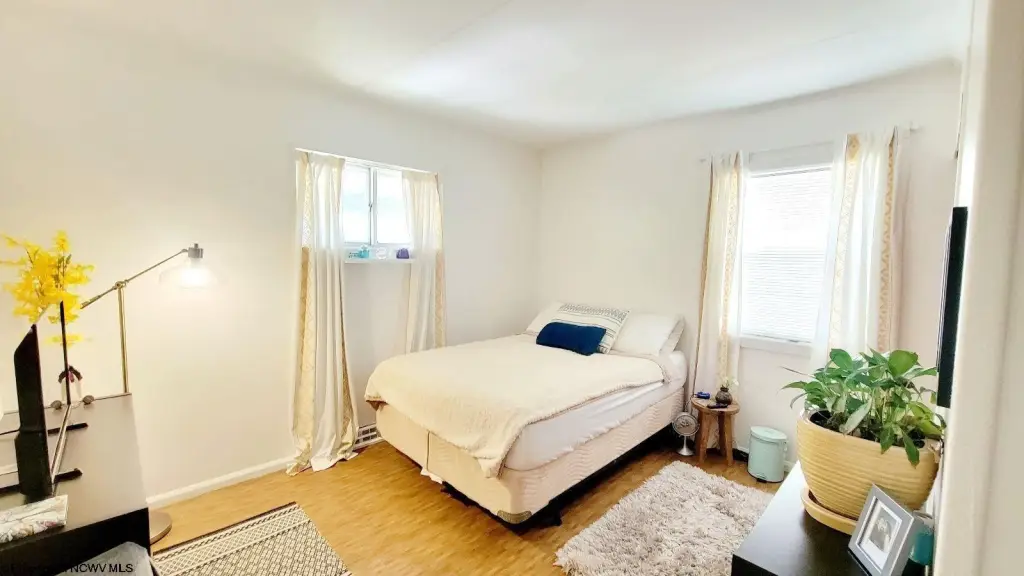
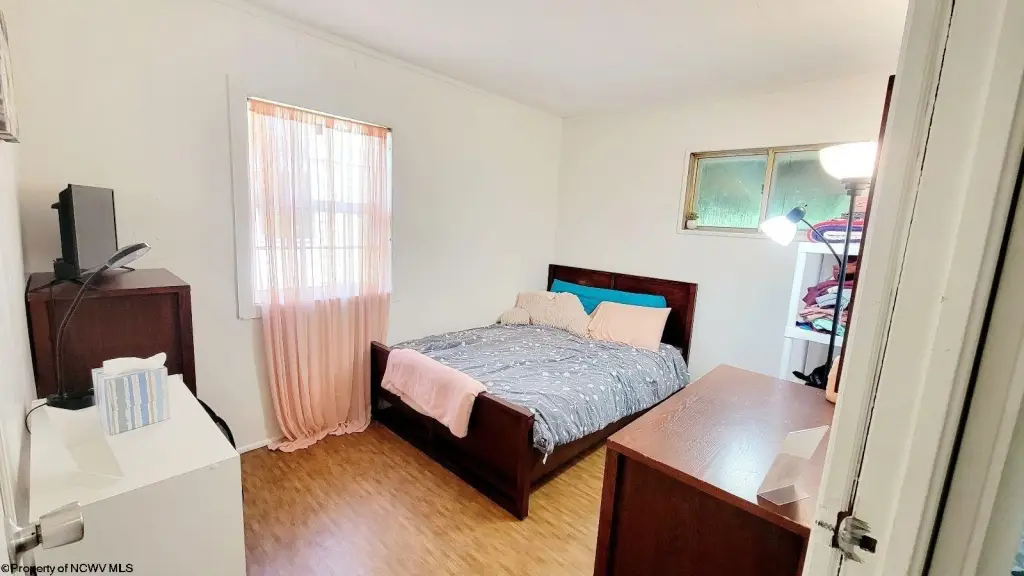
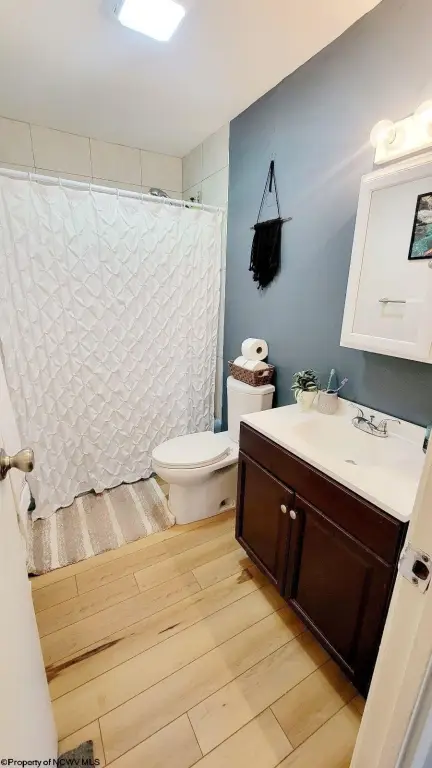
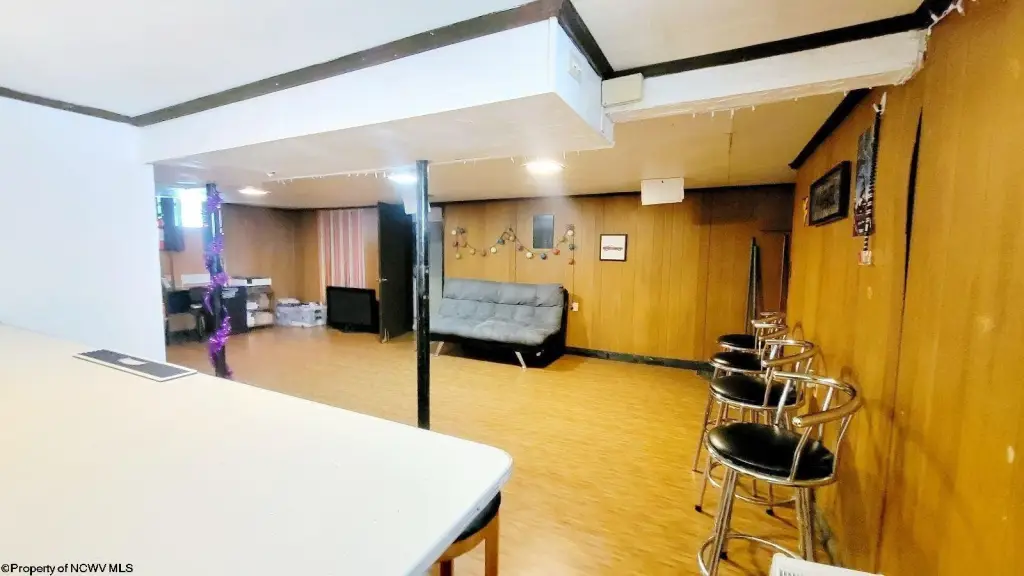
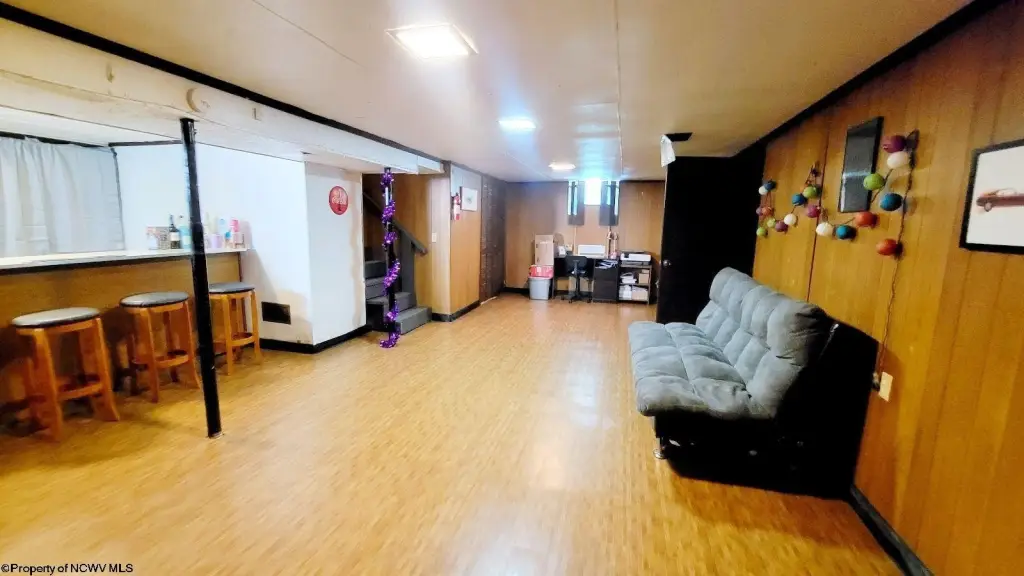
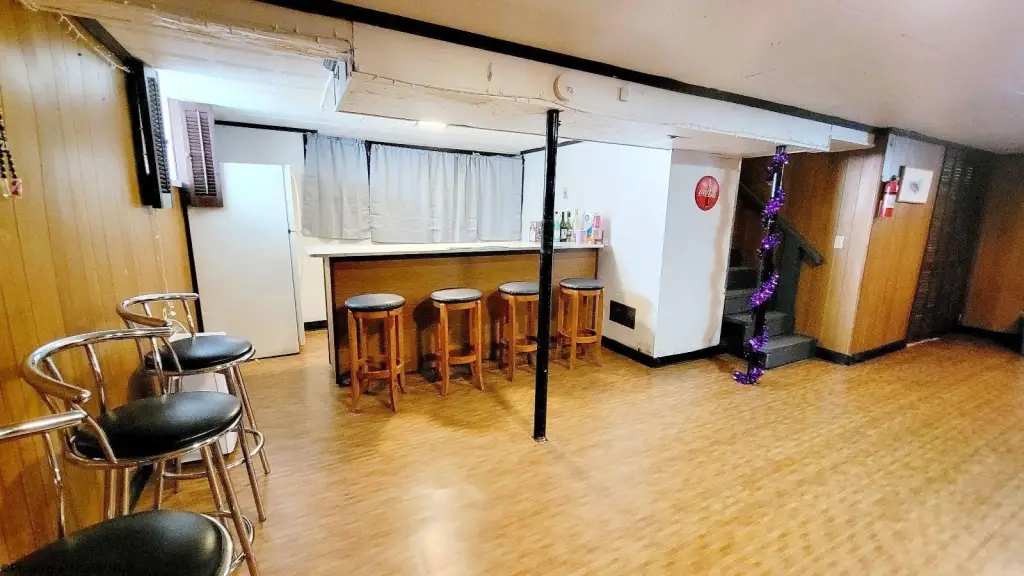
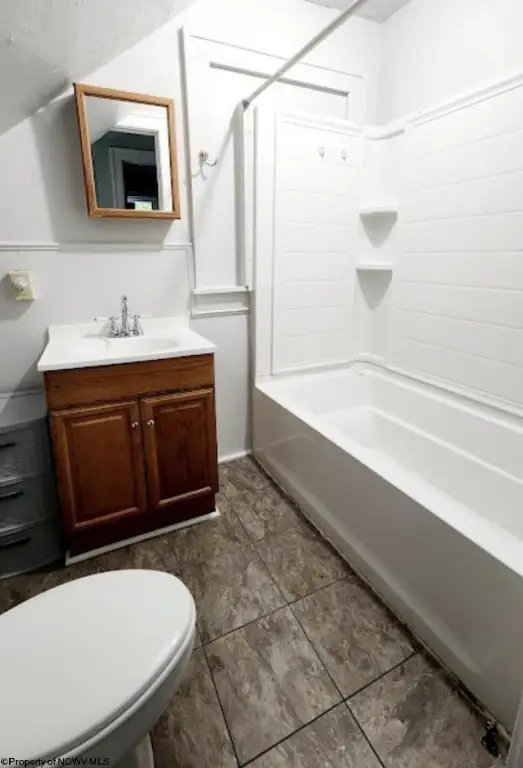
Bedroom 3, Bedroom 1, Bedroom 2, Bathroom 1, Bedroom 4, Basement, Bathroom 2, Bathroom 3
Patio and Porch features
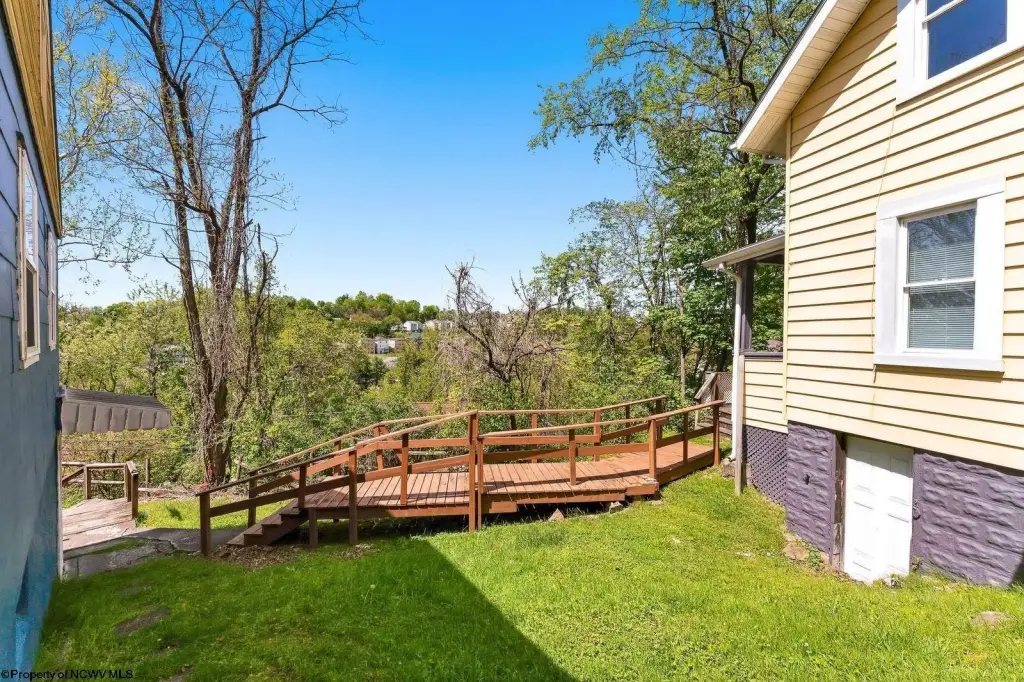
Deck, Patio, Porch
Interior features
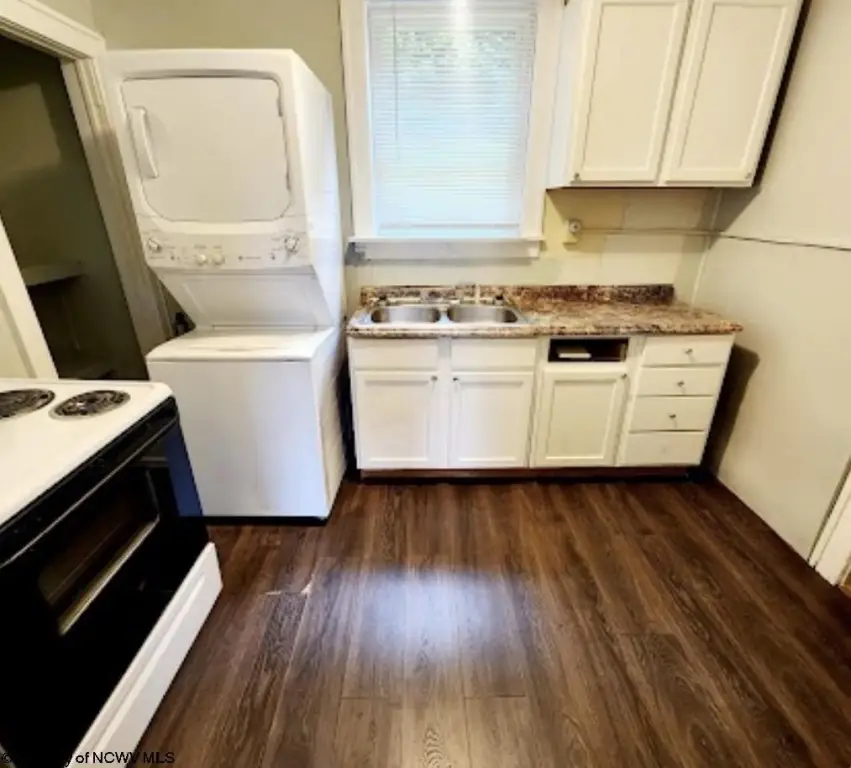
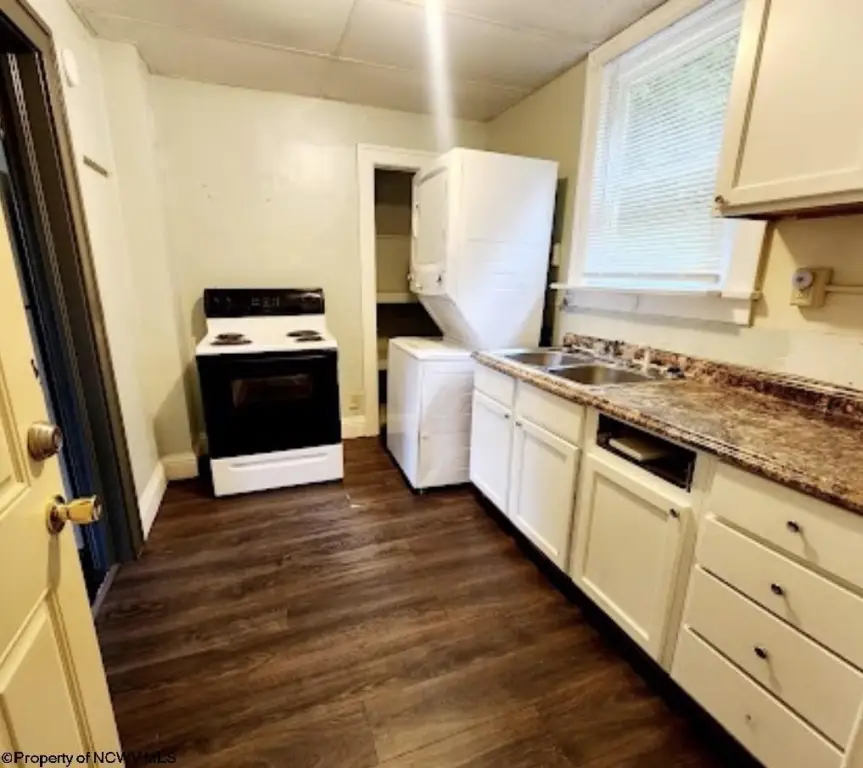
Electric Stove Connection, Washer Connection, Electric Dryer Connection, Wet Bar, Beamed Ceilings
Exterior features
Porch, Patio, Deck, Screen Porch
Appliances
Range, Dishwasher, Refrigerator
Lot features
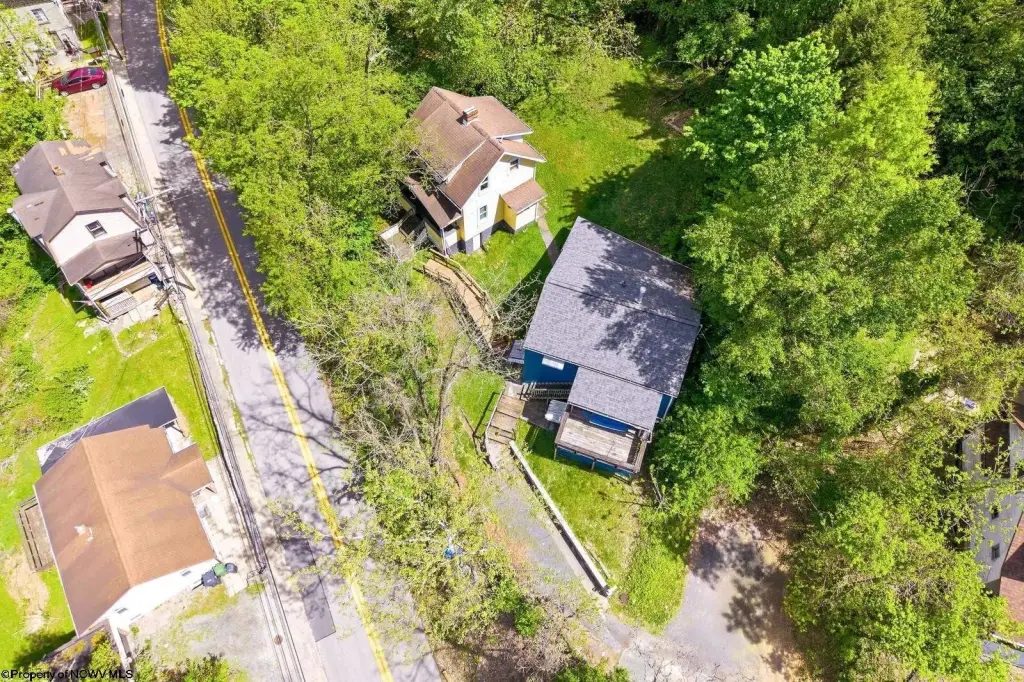
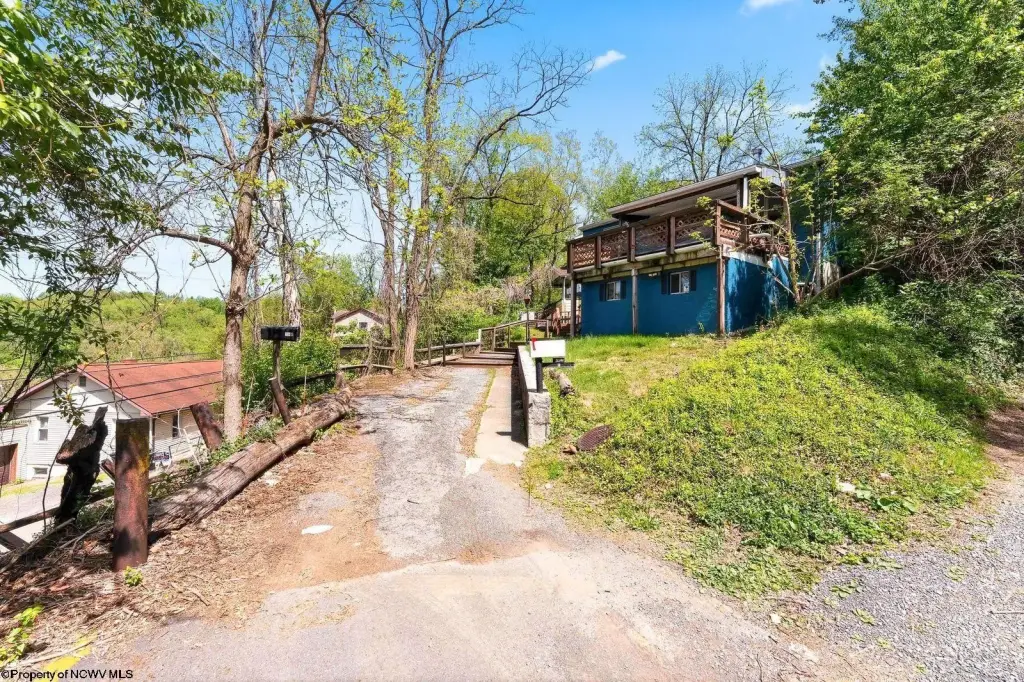
Sloping, No Outlet Street
Elementary school
Eastwood Elementary
Middle school
Mountaineer Middle
High school
University High
Elementary school district
Monongalia
Middle school district
Monongalia
High school district
Monongalia
Directions
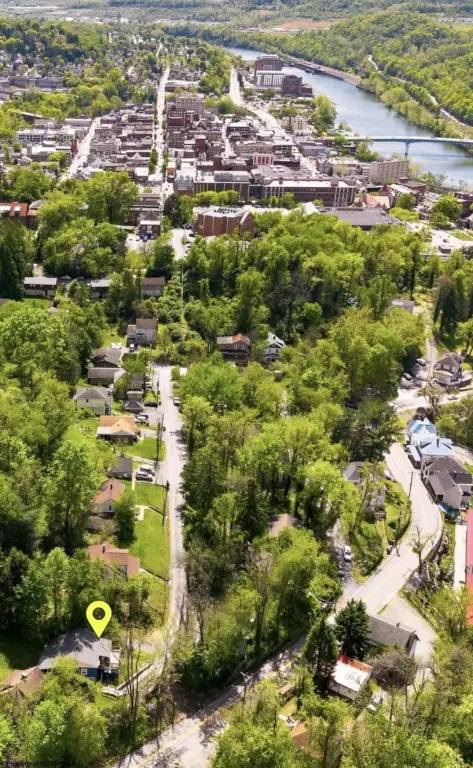
0.4 miles from WVU Mountainlair, Once at the Mountainlair head up College Ave, then turn right onto Cornell Ave, make the second left onto Cayton. The property is at the end of Cayton St.
Subdivision
Monongalia/Morgantown
Standard status
Active Under Contract
Size
1,580 SF
Lot size
0.29 Acres
Taxes and HOA fees
Tax Year
2025
Tax Description
BL C, LOT 2 & 17-1/2 STRIP 1024 CAYTON ST, BL C, LOT 1& 17-1/2 STRIP 1048 COLLEGE AVE
Tax Annual Amount
2958
Legal Description
BL C, LOT 2 & 17-1/2 STRIP 1024 CAYTON ST, BL C, LOT 1& 17-1/2 STRIP 1048 COLLEGE AVE
Utilities
Heating system
Natural Gas, Forced Air
Cooling system
Central Air, Electric, Ceiling Fan(s)
Building Details
Year built
1920
Floors in Building
2
Number of units
2
Flooring type
Wood, Vinyl, Laminate
Building materials
Frame, Block
Roof type
Shingle
Architectural style
Ranch, Other
Listing Agency:
BEL-CROSS PROPERTIES, LLC
(304) 296-7930
Listed By:
DESTINY SYLVESTER
(304) 685-9287
Added: May 28
Changed: Oct 16
Last Checked: Oct 20 at 2:06PM
MLS# 10164543
Copyright © 2026 North Central West Virginia Real Estate Information Network. All rights reserved. All information provided by the listing agent/broker is deemed reliable but is not guaranteed and should be independently verified.

Ask AI about this property
Review the available facts, identify missing information and prepare questions for the agent.
Investment Insights
Based on property information with market context.
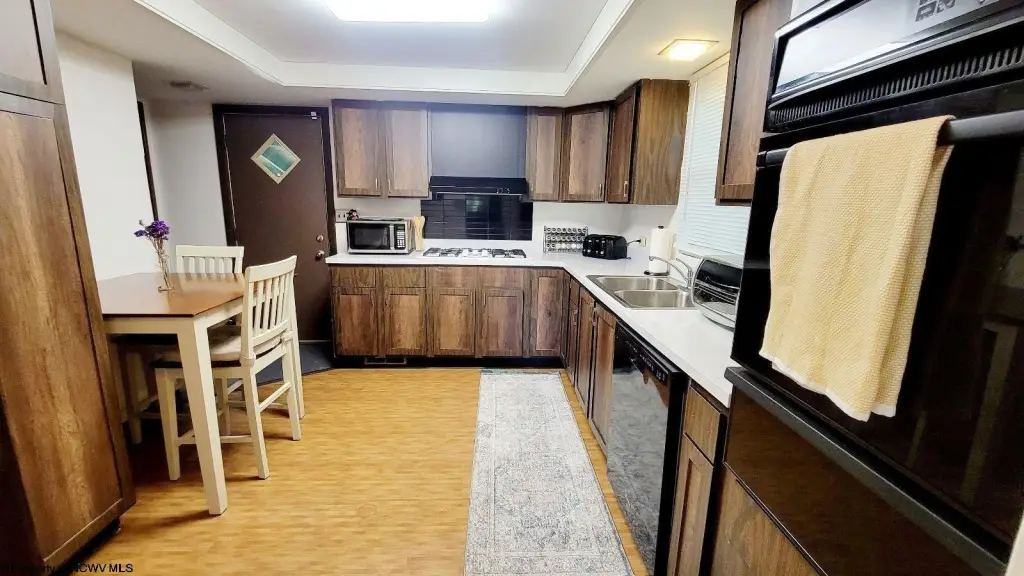
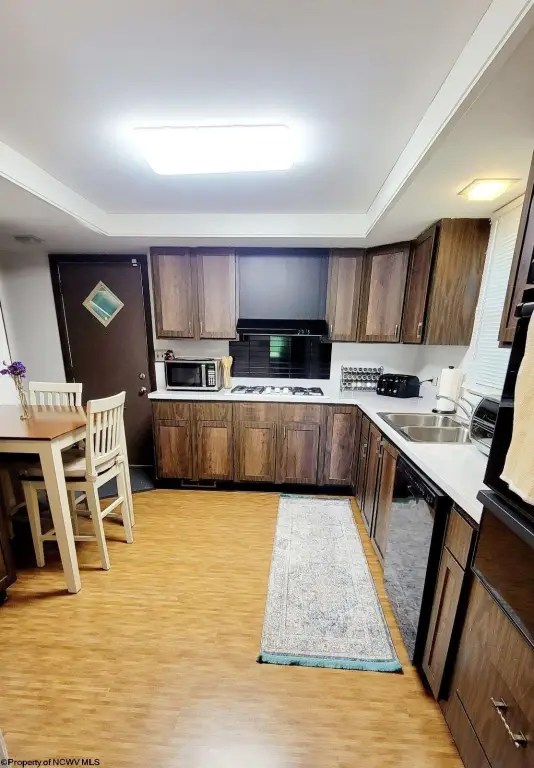
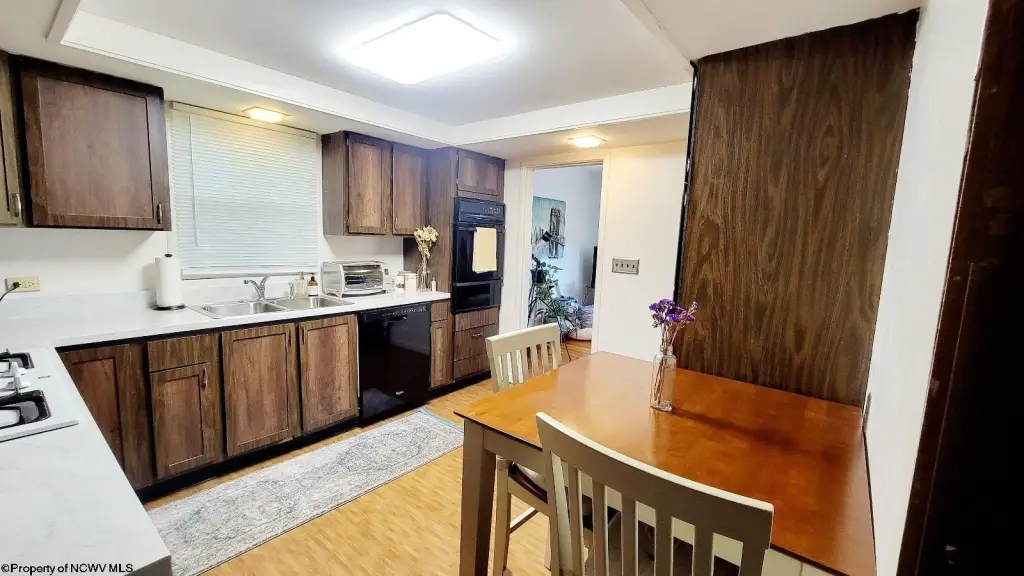
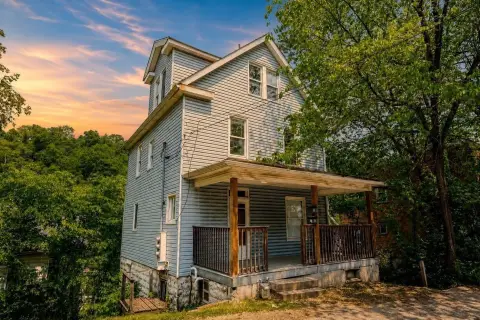
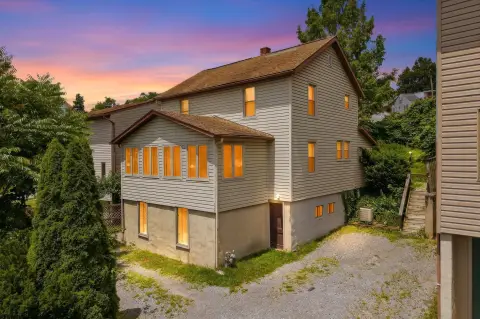
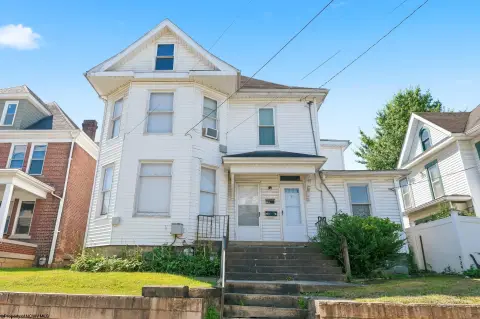
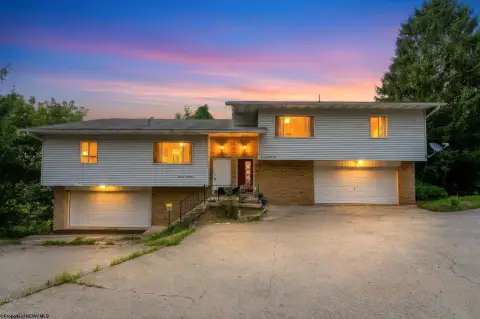
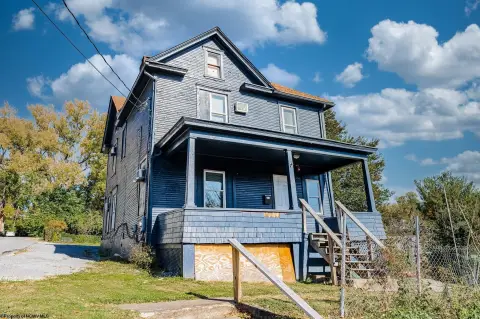
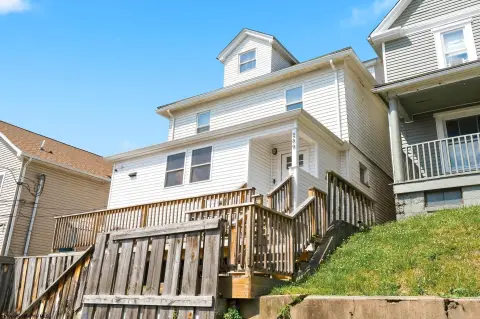
This offering combines two adjacent residential properties at 1024 Cayton Street and 1048 College Avenue in Morgantown. Each residence has two bedrooms; the Cayton Street home includes two bathrooms, while the College Avenue home has one. Interior features include kitchens with ranges, dishwashers, and refrigerators, along with washer and dryer connections. Outdoor improvements include porches, patios, decks, and a screened porch. The homes were built in 1920 and feature frame and block construction, natural-gas forced-air heat, central air, and ceiling fans.
The properties are approximately 0.5 miles from West Virginia University's Downtown Campus and the WVU Mountainlair. Both residences are leased through May 20, 2027, with tenants responsible for utilities and lawn care. The package is situated on 0.29 acres and is zoned Neighborhood Residential. Showings require at least 24 hours' notice.
The properties are approximately 0.5 miles from West Virginia University's Downtown Campus and the WVU Mountainlair. Both residences are leased through May 20, 2027, with tenants responsible for utilities and lawn care. The package is situated on 0.29 acres and is zoned Neighborhood Residential. Showings require at least 24 hours' notice.
Key Highlights
- Two adjacent residential properties at 1024 Cayton Street and 1048 College Avenue
- Both residences leased through May 20, 2027
- Approximately 0.5 miles from West Virginia University's Downtown Campus and WVU Mountainlair
Financial Insights
Estimated NOI and Cap Rate
NOI / Yr
$9,784
Cap Rate
4.55%
Suggested Prices Based on Cap Rates
Cap Rate 5%
$195,680
$195.7K
Cap Rate 7%
$139,771
$139.8K
Cap Rate 9%
$108,711
$108.7K
Market Conditions
NOI Build-Up for 1,580 SF
Gross rent
$14.2K $9.00/SF
− Vacancy
−$243 −$0.15/SF
EGI
$14.0K $8.85/SF
− OpEx
−$4.2K −$2.65/SF
NOI
$9.8K $6.19/SF
Area
Monongalia County, WV
Vacancy
1.71%
Lease Rate
$9.00 /SF/Yr
Expense Ratio
30.00%
Simulate Cap Rate and NOI
Suggested Prices Based on Cap Rates
Cap Rate 5%
$195,680
Cap Rate 7%
$139,771
Cap Rate 9%
$108,711
Alternative Uses
Best Use
Multifamily LT 5
$139.8K
$122.3K – $163.1K
NOI $9,784 @ 7.0% cap · market cap 4.55%
Second Best
Apartment 5plus
$128.7K
$112.6K – $150.2K
NOI $9,011 @ 7.0% cap · market cap 4.19%
Theoretical Best
Office A
$455.5K
$398.6K – $531.4K
NOI $31,885 @ 7.0% cap · market cap 14.83%
Zoning and permitted uses should be independently verified with authorities.
How Realmo checks its estimates
Property Analytics
Unlock full access to Insights
Subscribe to Realmo Intelligence
Open Analytics
Lease Details
2
Residential units
Multi-tenant
Tenancy
Location Intelligence
Trade Area within ½ mile
1,259
Businesses Nearby
Explore this area
Business Placement
Demographics for 26505, WV
39,057
Population
19,220
Households
2
Avg Household Size
27
Median Age
55%
College-Educated
93%
High-School Grad
12.6 sq mi
ZIP Area
3,100
Density / Sq Mi
$42,275
Median Household Income
$24,042
Median Earnings
$942
Median Rent
$265,100
Median Home Value
Check the figures for this property
Cap Rate, Value Estimation, Potential NOI and more
View Realmo Analytics
Market
Vacancy Rate% for Multifamily in South region





Frequently Asked Questions
What type of property is this?
Duplex - Two neighboring residences near West Virginia University offer established occupancy and convenient oversight for a multifamily owner.
Where is this duplex located?
The property is located at 1024 Cayton Street Morgantown, WV.
What is the asking price?
The asking price for this property is $215,000.
What are key features of this property?
This property features: Two adjacent residential properties at 1024 Cayton Street and 1048 College Avenue; Both residences leased through May 20, 2027; Approximately 0.5 miles from West Virginia University's Downtown Campus and WVU Mountainlair


