Fully Occupied Mixed-Use
For Sale
$1,798,000
10228 Jamaica Ave, Richmond Hill, NY 11418
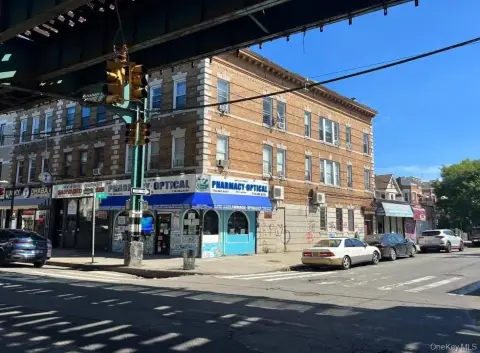
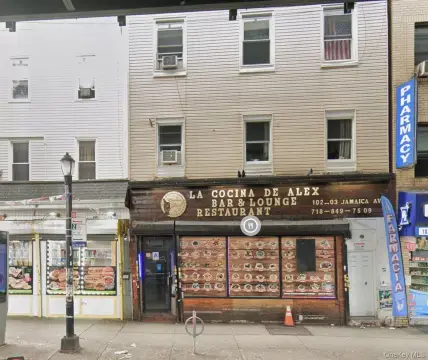
Income-producing commercial and residential building with a medical office, four apartments, and transit access along Jamaica Avenue.
Property Size6,270 SF
Price / SF$424.86
Days on Market59
Property Features for 10228 Jamaica Ave
General Information
Standard status
Active
Size
6,270 SF
Property subtype
Commercial
Occupancy
100%
Additional Details
Public Transit
Yes
Sprinkler System
Yes
Office Units
1
Building Details
Year Built
2007
Buildings
1
Building Size
6,270 SF
Construction
concrete, brick, steel
Tenancy
Multi
Abandoned
No
Listing Agency:
Prime America Real Estate Inc
Listed By:
Gobinda K. Lama info@primeamericany.com
Source:
Searchhomesinlongisland
Added: Aug 29
Changed: Oct 25
Last Checked: Oct 24 at 5:20PM
Displayed information is deemed reliable but is not guaranteed and should be independently verified. All listing content including descriptions, pricing, images are the copyrighted material of Prime America Real Estate Inc

Ask AI about this property
Review the available facts, identify missing information and prepare questions for the agent.
Investment Insights
Based on property information with market context.
Built in 2007, this mixed-use property combines a street-level medical office with four one-bedroom apartments. The commercial portion occupies approximately 2,040 square feet, while a finished basement of approximately 2,040 square feet adds usable support space and includes a dedicated utility area. The residential units are each approximately 500 square feet and have independent heating and boiler systems. The building uses fireproof concrete, brick, and steel construction and includes an advanced sprinkler system.
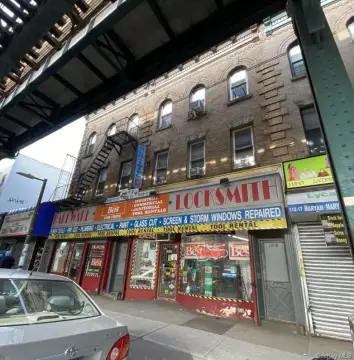
The property is fully occupied and positioned along Jamaica Avenue in Richmond Hill. Access to the J and Z subway lines and the Q56 bus route supports connectivity for both commercial and residential occupants. The surrounding corridor includes established businesses, services, and regular commuter activity, while the building's mixed-use configuration provides distinct commercial and residential components within one asset.
The property is fully occupied and positioned along Jamaica Avenue in Richmond Hill. Access to the J and Z subway lines and the Q56 bus route supports connectivity for both commercial and residential occupants. The surrounding corridor includes established businesses, services, and regular commuter activity, while the building's mixed-use configuration provides distinct commercial and residential components within one asset.
Key Highlights
- Fully occupied mixed‑use building with medical office and four one‑bedroom apartments
- Built in 2007 with fireproof concrete, brick, and steel construction
- Approximately 2,040 SF ground‑floor medical office
Financial Insights
Estimated NOI and Cap Rate
NOI / Yr
$139,334
Cap Rate
7.75%
Suggested Prices Based on Cap Rates
Cap Rate 5%
$2,786,680
$2.8M
Cap Rate 7%
$1,990,486
$2.0M
Cap Rate 9%
$1,548,156
$1.5M
Market Conditions
NOI Build-Up for 4,232 SF
Gross rent
$213.3K $50.40/SF
− Vacancy
−$27.5K −$6.50/SF
EGI
$185.8K $43.90/SF
− OpEx
−$46.4K −$10.97/SF
NOI
$139.3K $32.92/SF
Area
Queens County, NY
Vacancy
12.90%
Lease Rate
$50.40 /SF/Yr
Expense Ratio
25.00%
Simulate Cap Rate and NOI
Suggested Prices Based on Cap Rates
Cap Rate 5%
$2,786,680
Cap Rate 7%
$1,990,486
Cap Rate 9%
$1,548,156
Alternative Uses
Best Use
Office B
$1.99M
$1.74M – $2.32M
NOI $139,334 @ 7.0% cap · market cap 7.75%
Second Best
Apartment 5plus
$1.48M
$1.29M – $1.72M
NOI $103,449 @ 7.0% cap · market cap 5.75%
Theoretical Best
Office A
$3.12M
$2.73M – $3.64M
NOI $218,392 @ 7.0% cap · market cap 12.15%
Zoning and permitted uses should be independently verified with authorities.
How Realmo checks its estimates
Property Analytics
Who owns this building?
See the owner, sales and loan history
Open Analytics
Current Use
Lease Details
1
Office units
100%
Occupancy
Multi-tenant
Tenancy
Yes
Sprinkler system
Location Intelligence
Trade Area within ½ mile
2,620
Businesses Nearby
Explore this area
Business Placement
Demographics for 11418, NY
37,596
Population
12,072
Households
3.1
Avg Household Size
37
Median Age
32%
College-Educated
81%
High-School Grad
1.7 sq mi
ZIP Area
22,115
Density / Sq Mi
$84,927
Median Household Income
$44,818
Median Earnings
$1,788
Median Rent
$772,800
Median Home Value
Check the figures for this property
Cap Rate, Value Estimation, Potential NOI and more
View Realmo Analytics
Market
Vacancy Rate% for Office in Northeast region



Frequently Asked Questions
What type of property is this?
Mixed-use property - Income-producing commercial and residential building with a medical office, four apartments, and transit access along Jamaica Avenue.
Where is this mixed-use property located?
The property is located at 10228 Jamaica Ave Richmond Hill, NY.
What is the asking price?
The asking price for this property is $1,798,000.
What are key features of this property?
This property features: Fully occupied mixed‑use building with medical office and four one‑bedroom apartments; Built in 2007 with fireproof concrete, brick, and steel construction; Approximately 2,040 SF ground‑floor medical office



