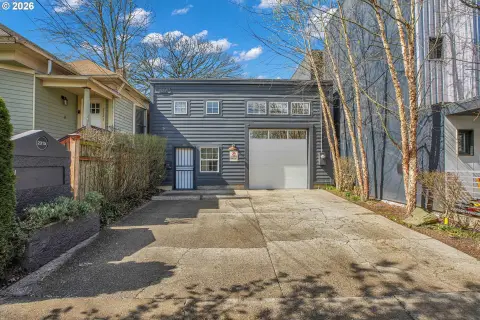
Warehouse/Office Building with Rooftop
For Sale
$1,063,748
1020 Southeast Harrison Street, Portland, OR 97214
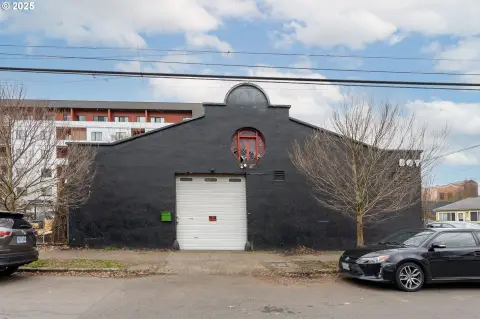
4,000 SF warehouse/office building with a rooftop garden.
Property Size4,000 SF
Price / SF$265.94
Days on Market215
Property Features for 1020 Southeast Harrison Street
General Information
Standard status
Active
Size
4,000 SF
Property subtype
FlexIndustrial
Site & Location
Neighborhood
Hosford-Abernethy Neighborhood District (Hand)
Listing Agency:
CBRE - Portland
Listed By:
Eleanor Aschoff · License #971000188
(503) 221-4868
Source:
Cbre
Added: Mar 25
Changed: Oct 24
Last Checked: Oct 24 at 3:16PM
Displayed information is deemed reliable but is not guaranteed and should be independently verified. All listing content including descriptions, pricing, images are the copyrighted material of CBRE - Portland

Ask AI about this property
Review the available facts, identify missing information and prepare questions for the agent.
Investment Insights
Based on property information with market context.
This is a 4,000 square foot, two-story building suitable for warehouse and office use. The layout includes 2,000 square feet of office space and 2,000 square feet of warehouse space, complemented by a rooftop garden. The building features a sawtooth roof designed to maximize natural light into the second-floor office area. It is equipped with one 10x8 grade-level door for loading. The warehouse area has a clear height of 11 feet and provides 240V 3-phase power. The building was remodeled in 2016 and is located in the Southeast Close-In area. The property is zoned IG1.
Key Highlights
- 2,000 SF Office / 2,000 SF Warehouse + Rooftop Garden
- SE Close‑In location
- Sawtooth roof for maximum light into 2nd floor office
Financial Insights
Estimated NOI and Cap Rate
NOI / Yr
$40,622
Cap Rate
3.82%
Suggested Prices Based on Cap Rates
Cap Rate 5%
$812,440
$812.4K
Cap Rate 7%
$580,314
$580.3K
Cap Rate 9%
$451,356
$451.4K
Market Conditions
NOI Build-Up for 4,000 SF
Gross rent
$67.2K $16.80/SF
− Vacancy
−$4.7K −$1.18/SF
EGI
$62.5K $15.62/SF
− OpEx
−$21.9K −$5.47/SF
NOI
$40.6K $10.16/SF
Area
Portland, OR
Vacancy
7.00%
Lease Rate
$16.80 /SF/Yr
Expense Ratio
35.00%
Simulate Cap Rate and NOI
Suggested Prices Based on Cap Rates
Cap Rate 5%
$812,440
Cap Rate 7%
$580,314
Cap Rate 9%
$451,356
Alternative Uses
Best Use
Flex RnD
$580.3K
$507.8K – $677.0K
NOI $40,622 @ 7.0% cap · market cap 3.82%
Second Best
Industrial
$358.7K
$313.8K – $418.4K
NOI $25,106 @ 7.0% cap · market cap 2.36%
Theoretical Best
Office A
$1.12M
$982.9K – $1.31M
NOI $78,631 @ 7.0% cap · market cap 7.39%
Zoning and permitted uses should be independently verified with authorities.
How Realmo checks its estimates
Property Analytics
Contact the owner directly
Get the owner's phone numbers and email
Open Analytics
Current Use
Location Intelligence
Trade Area within ½ mile
3,594
Businesses Nearby
Well-served
Demand for This Use
Explore this area
Business Placement
Demographics for 97214, OR
28,403
Population
15,948
Households
1.8
Avg Household Size
36
Median Age
67%
College-Educated
98%
High-School Grad
2.9 sq mi
ZIP Area
9,794
Density / Sq Mi
$86,879
Median Household Income
$55,643
Median Earnings
$1,628
Median Rent
$733,200
Median Home Value
Check the figures for this property
Cap Rate, Value Estimation, Potential NOI and more
View Realmo Analytics
Market
Vacancy Rate% for Industrial in Portland, OR







Similar Off Market Nearby
- Ingallina's Box Lunch — 2833 SE 15th Ave, Portland, OR 97202
- ChefStable Catering — 2136 SE 8th Ave, Portland, OR 97214, United States
- Trailhead Coffee Roasters — 350 SE Mill St, Portland, OR 97214
- Accent Party Planning — Portland, OR 97214
- Sugar Street Catering — 3334, 1430 SE Water Ave #102, Portland, OR 97214
Frequently Asked Questions
What type of property is this?
Flex space - 4,000 SF warehouse/office building with a rooftop garden.
Where is this flex space located?
The property is located at 1020 Southeast Harrison Street Portland, OR.
What is the asking price?
The asking price for this property is $1,063,748.
What are key features of this property?
This property features: 2,000 SF Office / 2,000 SF Warehouse + Rooftop Garden; SE Close‑In location; Sawtooth roof for maximum light into 2nd floor office


