Daytona Beach Remodeled Mixed-Use
For Sale
Contact for pricing
1020 S Ridgewood Avenue, Daytona Beach, FL 32114
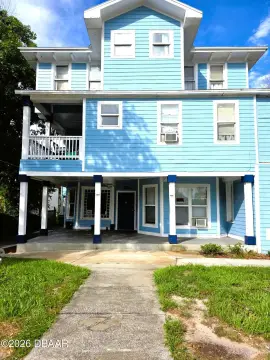
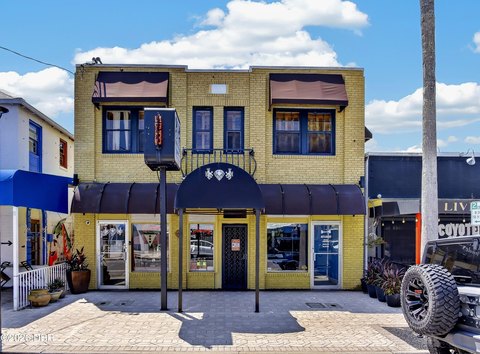
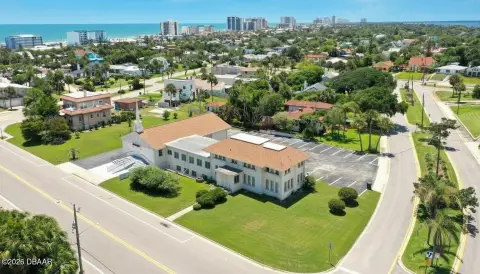
Remodeled mixed-use property in Daytona Beach, close to amenities.
Property Size6,210 SF
Price / SF$370.37
Days on Market1591
Property Features for 1020 S Ridgewood Avenue
General Information
Standard status
Active
Size
6,210 SF
Property subtype
Hospitality, Mixed Use, Special Purpose
Building Details
Year Built
1953
Listing Agency:
Realty Pros Commercial Division
Listed By:
Terry Sitaram · License #3092297
(386) 237-4444
Source:
Crexi
Added: Jun 8, 2022
Changed: Oct 3
Last Checked: Oct 14 at 9:08PM
Displayed information is deemed reliable but is not guaranteed and should be independently verified. All listing content including descriptions, pricing, images are the copyrighted material of Realty Pros Commercial Division

Ask AI about this property
Review the available facts, identify missing information and prepare questions for the agent.
Investment Insights
Based on property information with market context.
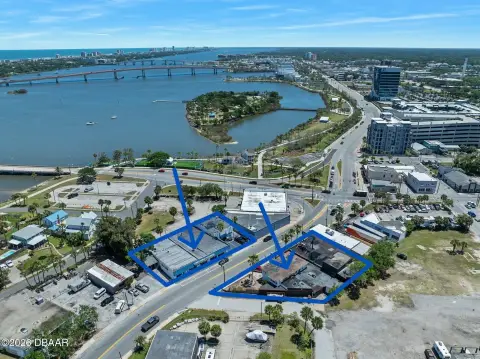
This remodeled mixed-use property is located in Daytona Beach, Florida. The property has undergone significant upgrades, including over $100,000 in renovations to the manager's living quarters. The property features 17 upgraded bedrooms. Situated in an opportunity zone, this property offers potential tax savings. It is located steps away from the river and close to the ocean. The property is near public transportation, doctor's offices, shopping, and downtown Daytona. The building has a total size of 6,210 square feet. According to the Volusia property appraiser website, all measurements are approximate. The property is rented almost full all year around.
Key Highlights
- Fully remodeled and upgraded manager's living space with over $100k in upgrades.
- 17 upgraded bedrooms.
- Located in an opportunity zone, offering potential tax savings.
Financial Insights
Estimated NOI and Cap Rate
NOI / Yr
$76,709
Cap Rate
3.34%
Suggested Prices Based on Cap Rates
Cap Rate 5%
$1,534,180
$1.5M
Cap Rate 7%
$1,095,843
$1.1M
Cap Rate 9%
$852,322
$852.3K
Market Conditions
NOI Build-Up for 6,210 SF
Gross rent
$134.1K $21.60/SF
− Vacancy
−$11.4K −$1.84/SF
EGI
$122.7K $19.76/SF
− OpEx
−$46.0K −$7.41/SF
NOI
$76.7K $12.35/SF
Area
Volusia County, FL
Vacancy
8.50%
Lease Rate
$21.60 /SF/Yr
Expense Ratio
37.50%
Simulate Cap Rate and NOI
Suggested Prices Based on Cap Rates
Cap Rate 5%
$1,534,180
Cap Rate 7%
$1,095,843
Cap Rate 9%
$852,322
Alternative Uses
Best Use
Mixed Use
$1.10M
$958.9K – $1.28M
NOI $76,709 @ 7.0% cap · market cap 3.34%
Second Best
Hotel Hospitality
$318.6K
$278.8K – $371.7K
NOI $22,300 @ 7.0% cap · market cap 0.97%
Theoretical Best
Office A
$1.83M
$1.60M – $2.14M
NOI $128,174 @ 7.0% cap · market cap 5.57%
Zoning and permitted uses should be independently verified with authorities.
How Realmo checks its estimates
Property Analytics
Unlock full access to Insights
Subscribe to Realmo Intelligence
Open Analytics
Current Use
Location Intelligence
Trade Area within ½ mile
726
Businesses Nearby
Explore this area
Business Placement
Demographics for 32114, FL
34,943
Population
17,118
Households
2
Avg Household Size
33
Median Age
19%
College-Educated
89%
High-School Grad
16.0 sq mi
ZIP Area
2,184
Density / Sq Mi
$39,906
Median Household Income
$31,220
Median Earnings
$1,171
Median Rent
$174,900
Median Home Value
Check the figures for this property
Cap Rate, Value Estimation, Potential NOI and more
View Realmo Analytics




Frequently Asked Questions
What type of property is this?
Hospitality property - Remodeled mixed-use property in Daytona Beach, close to amenities.
Where is this hospitality property located?
The property is located at 1020 S Ridgewood Avenue Daytona Beach, FL.
What is the asking price?
The asking price for this property is $2,300,000.
What are key features of this property?
This property features: Fully remodeled and upgraded manager's living space with over $100k in upgrades.; 17 upgraded bedrooms.; Located in an opportunity zone, offering potential tax savings.


