Duplex with Fenced
For Sale
$334,000
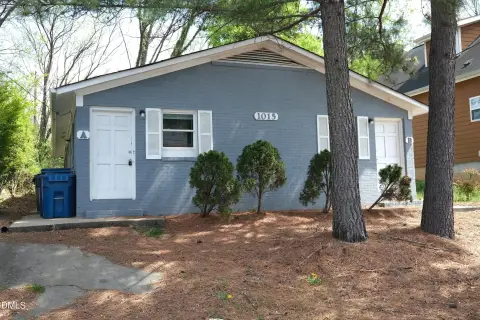
1019 Sedgefield St, Durham, NC 27705
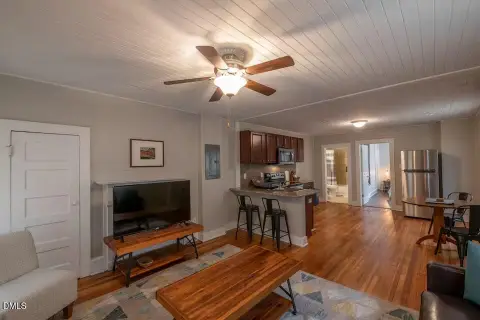
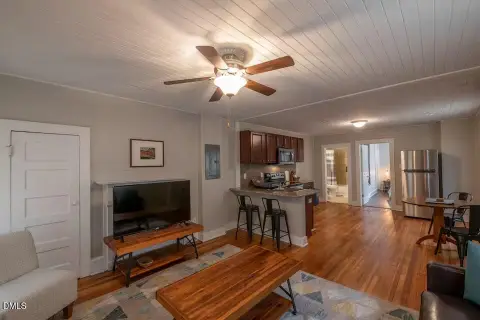
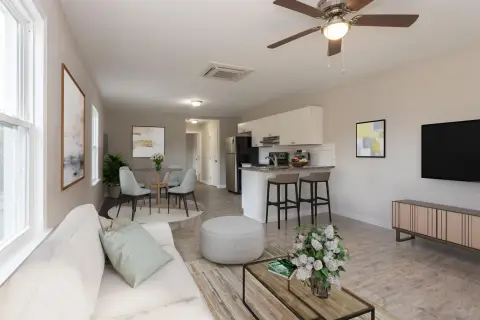
Both residences are leased through 2027 and include hardwood floors, central HVAC, and a full appliance package.
Property Size1,170 SF
Price / SF$285.47
Days on Market66
Property Features for 1019 Sedgefield St
General Information
Standard status
Active
Size
1,170 SF
Property subtype
Multi-Family
Occupancy
100%
Additional Details
Multifamily Units
2
Amenities
hardwood floors
central HVAC
front porch
fenced-in back yard
washer/dryer
refrigerator
stove
Building Details
Year Built
1920
Listing Agency:
Frasher Whaley Realty Group
Listed By:
John Whaley · License #262351
(919) 475-3891
Source:
Tcrnc
Added: Aug 11
Changed: Oct 3
Last Checked: Oct 7 at 2:15PM
Displayed information is deemed reliable but is not guaranteed and should be independently verified. All listing content including descriptions, pricing, images are the copyrighted material of Frasher Whaley Realty Group
Investment Insights
Based on property information with market context.
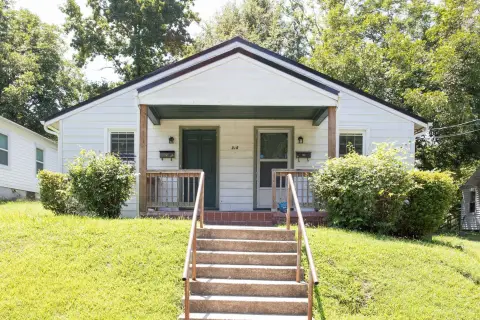
This 1,170 SF duplex was built in 1920 and offers two leased residences with hardwood flooring, central HVAC, and all-electric systems. Each unit includes a washer, dryer, refrigerator, and stove. Exterior features include a covered front porch and a fenced rear yard.
The property is located at 1019 Sedgefield St in Durham’s Walltown area, a few blocks from Duke and Broad and 9th streets. Downtown Durham is less than two miles away. Both units are leased until 2027, and access is available by appointment only.
The property is located at 1019 Sedgefield St in Durham’s Walltown area, a few blocks from Duke and Broad and 9th streets. Downtown Durham is less than two miles away. Both units are leased until 2027, and access is available by appointment only.
Key Highlights
- Two units leased until 2027
- 1170 SF duplex built in 1920
- Hardwood floors and central HVAC
Financial Insights
Estimated NOI and Cap Rate
NOI / Yr
$10,047
Cap Rate
3.01%
Suggested Prices Based on Cap Rates
Cap Rate 5%
$200,940
$200.9K
Cap Rate 7%
$143,529
$143.5K
Cap Rate 9%
$111,633
$111.6K
Market Conditions
NOI Build-Up for 1,170 SF
Gross rent
$16.1K $13.80/SF
− Vacancy
−$1.8K −$1.53/SF
EGI
$14.4K $12.27/SF
− OpEx
−$4.3K −$3.68/SF
NOI
$10.0K $8.59/SF
Area
Durham, NC
Vacancy
11.11%
Lease Rate
$13.80 /SF/Yr
Expense Ratio
30.00%
Simulate Cap Rate and NOI
Suggested Prices Based on Cap Rates
Cap Rate 5%
$200,940
Cap Rate 7%
$143,529
Cap Rate 9%
$111,633
Alternative Uses
Best Use
Multifamily LT 5
$143.5K
$125.6K – $167.5K
NOI $10,047 @ 7.0% cap · market cap 3.01%
Second Best
Apartment 5plus
$125.7K
$110.0K – $146.6K
NOI $8,796 @ 7.0% cap · market cap 2.63%
Theoretical Best
Office A
$377.8K
$330.6K – $440.8K
NOI $26,446 @ 7.0% cap · market cap 7.92%
Zoning and permitted uses should be independently verified with authorities.
How Realmo checks its estimates
Property Analytics
Unlock full access to Insights
Subscribe to Realmo Intelligence
Open Analytics
Current Use
Lease Details
2
Residential units
100%
Occupancy
Location Intelligence
Trade Area within ½ mile
1,228
Businesses Nearby
Explore this area
Business Placement
Demographics for 27705, NC
50,472
Population
24,108
Households
2.1
Avg Household Size
34
Median Age
62%
College-Educated
91%
High-School Grad
42.1 sq mi
ZIP Area
1,199
Density / Sq Mi
$71,153
Median Household Income
$43,138
Median Earnings
$1,422
Median Rent
$398,500
Median Home Value
Check the figures for this property
Cap Rate, Value Estimation, Potential NOI and more
View Realmo Analytics
Market
Vacancy Rate% for Multifamily in South region

Questions? Ask Rey
Realmo’s AI knows this listing — price, zoning, demand, history. Ask anything.




Frequently Asked Questions
What type of property is this?
Duplex - Both residences are leased through 2027 and include hardwood floors, central HVAC, and a full appliance package.
Where is this duplex located?
The property is located at 1019 Sedgefield St Durham, NC.
What is the asking price?
The asking price for this property is $334,000.
What are key features of this property?
This property features: Two units leased until 2027; 1170 SF duplex built in 1920; Hardwood floors and central HVAC


