Creative Live-Work
For Sale
$350,000
Pending
1019 10TH W, Bradenton, FL 34205
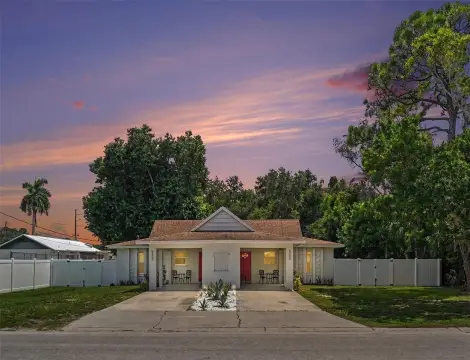
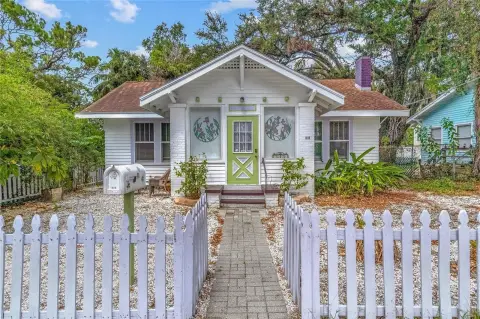
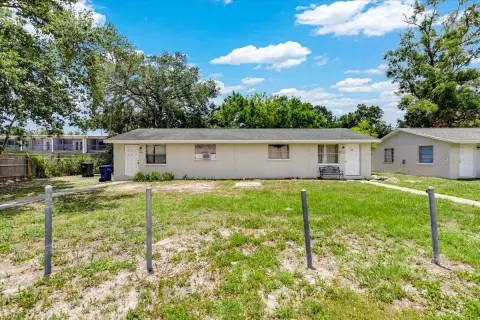
Two commercial lots include a residence, multiple creative areas, and a detached studio with a half bath.
Property Size1,970 SF
Days on Market56
Property Features for 1019 10TH W
General Information
Standard status
Pending
Size
1,970 SF
Property subtype
Commercial
Zoning
RB-3/VAOD
Additional Details
Public Transit
Yes
Taxes and HOA fees
Annual Taxes
$2,738
Building Details
Building Size
1,970 SF
Year Built
1920
Listing Agency:
DALTON WADE INC
Listed By:
Adam Lester · License #3404323
(941) 580-1655
Source:
Elliman
Added: Aug 13
Changed: Sep 25
Last Checked: Oct 7 at 12:58PM
Displayed information is deemed reliable but is not guaranteed and should be independently verified. All listing content including descriptions, pricing, images are the copyrighted material of DALTON WADE INC
Investment Insights
Based on property information with market context.
This live-work property at 1019 10TH W includes a residence with multiple creative spaces, two full bathrooms, and one half bathroom. A detached studio adds another flexible area and includes its own half bathroom. The property was built in 1920 and spans two commercial lots identified as RB-3/VAOD.
The site is in Bradenton’s Village of the Arts, within walking distance of galleries, cafés, and restaurants. LECOM Park is less than 0.5 miles away and has 8,500 seats with 81+ home games per year. The lots include an oversized yard with bamboo, mangroves, garden lighting, and a koi pond. The property information also identifies capacity for up to 18 units.
The site is in Bradenton’s Village of the Arts, within walking distance of galleries, cafés, and restaurants. LECOM Park is less than 0.5 miles away and has 8,500 seats with 81+ home games per year. The lots include an oversized yard with bamboo, mangroves, garden lighting, and a koi pond. The property information also identifies capacity for up to 18 units.
Key Highlights
- Live‑work property on two RB‑3/VAOD commercial lots
- Residence includes 2 full baths and 1 half bath
- Detached studio with an additional half bath
Financial Insights
Estimated NOI and Cap Rate
NOI / Yr
$32,169
Cap Rate
9.19%
Suggested Prices Based on Cap Rates
Cap Rate 5%
$643,380
$643.4K
Cap Rate 7%
$459,557
$459.6K
Cap Rate 9%
$357,433
$357.4K
Market Conditions
NOI Build-Up for 1,970 SF
Gross rent
$45.4K $23.04/SF
− Vacancy
−$2.5K −$1.27/SF
EGI
$42.9K $21.77/SF
− OpEx
−$10.7K −$5.44/SF
NOI
$32.2K $16.33/SF
Area
Manatee County, FL
Vacancy
5.50%
Lease Rate
$23.04 /SF/Yr
Expense Ratio
25.00%
Simulate Cap Rate and NOI
Suggested Prices Based on Cap Rates
Cap Rate 5%
$643,380
Cap Rate 7%
$459,557
Cap Rate 9%
$357,433
Alternative Uses
Best Use
Mixed Use
$493.4K
$431.7K – $575.6K
NOI $34,537 @ 7.0% cap · market cap 9.87%
Second Best
Office B
$459.6K
$402.1K – $536.2K
NOI $32,169 @ 7.0% cap · market cap 9.19%
Theoretical Best
Office A
$579.3K
$506.9K – $675.9K
NOI $40,552 @ 7.0% cap · market cap 11.59%
Zoning and permitted uses should be independently verified with authorities.
Property Analytics
Current Use
Location Intelligence
Trade Area within ½ mile
2,627
Businesses Nearby
Explore this area
Business Placement
Demographics for 34205, FL
33,789
Population
16,610
Households
2
Avg Household Size
44
Median Age
24%
College-Educated
87%
High-School Grad
6.5 sq mi
ZIP Area
5,198
Density / Sq Mi
$51,170
Median Household Income
$37,037
Median Earnings
$1,323
Median Rent
$236,900
Median Home Value
Market
Vacancy Rate% for Office in South region

Questions? Ask Rey
Realmo’s AI knows this listing — price, zoning, demand, history. Ask anything.






Frequently Asked Questions
What type of property is this?
Live-work space - Two commercial lots include a residence, multiple creative areas, and a detached studio with a half bath.
Where is this live-work space located?
The property is located at 1019 10TH W Bradenton, FL.
What is the asking price?
The asking price for this property is $350,000.
What are key features of this property?
This property features: Live‑work property on two RB‑3/VAOD commercial lots; Residence includes 2 full baths and 1 half bath; Detached studio with an additional half bath


