Duplex with Golf Course
For Sale
$649,000
Pending
1018 Sterling Court, Crown Point, IN 46307
Finished basement, loft, and two kitchens support flexible residential use.
Property Size4,412 SF
Days on Market100

Ask AI about this property
Review the available facts, identify missing information and prepare questions for the agent.
Property Features for 1018 Sterling Court
General Information
Standard status
Pending
Size
4,412 SF
Property subtype
Residential / Half Duplex
Zoning
residential
Additional Details
Multifamily Units
2
Taxes and HOA fees
Annual Taxes
$5,802
Amenities
Living Room, 14.0 x 14.0, Fireplace, built-ins, cathedral ceiling
Kitchen, 12.04 x 13.05, Island, SS appliances, put out drawers, soft close
Dining Room, 18.05 x 11.02, Hardwood
Sunroom, 11.07 x 14.01, Access to patio
Primary Bedroom, 19.07 x 13.1, View of course, spacious ensuite, walk-in closet
Bedroom 2, 12.0 x 9.11, currently used as a den, built-ins
Loft, 19.04 x 18.04
Game Room, 17.09 x 27.1, Beverage fridge
Kitchen, 16.11 x 9.02, second kitchen
Bonus Room, 11.07 x 12.1, currently used as guest suite
Laundry, 8.04 x 9.02
Asphalt
Central Air, Ceiling Fan(s)
Yes
2
Carpet, Tile, Hardwood
Forced Air, Natural Gas
Built-In Gas Range, Washer, Stainless Steel Appliance(s), Refrigerator, Microwave, Gas Water Heater, Dishwasher, Disposal, Dryer
3
Bath/Stubbed, Storage Space, Sump Pump, Full, Finished
1951.0
Gas Dryer Hookup, Washer Hookup, Sink, Main Level, Laundry Room
Smoke Detector(s)
11
Gas
Cathedral Ceiling(s), Walk-In Closet(s), Vaulted Ceiling(s), Tray Ceiling(s), Recessed Lighting, Open Floorplan, Kitchen Island, In-Law Floorplan, High Ceilings, Granite Counters, Entrance Foyer, Double Vanity, Ceiling Fan(s)
1
One and One Half
Landscaping
Insulated Windows
Private Yard, Rain Gutters
Covered, Porch, Patio, Front Porch
Brick, Stone, Cedar
No
Building Details
Year Built
2006
Listing Agency:
Coldwell Banker Realty
Listed By:
Julie Urbanski · License #RB14049424
(219) 741-9155
Source:
Compass
Added: Jul 8
Changed: Oct 8
Last Checked: Oct 15 at 1:03AM
Displayed information is deemed reliable but is not guaranteed and should be independently verified. All listing content including descriptions, pricing, images are the copyrighted material of Coldwell Banker Realty
Investment Insights
Based on property information with market context.
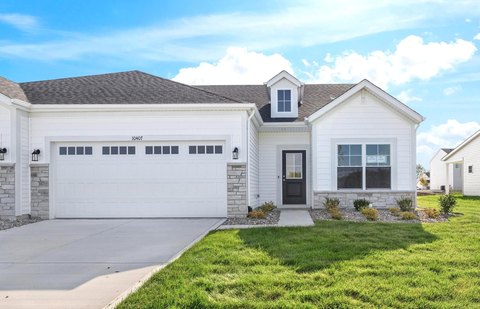
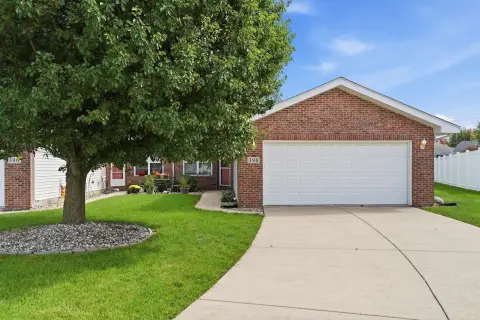
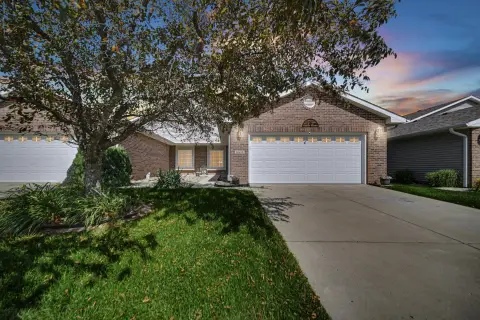
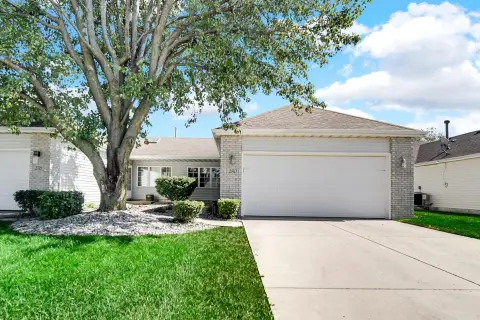
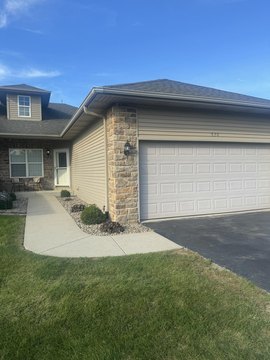
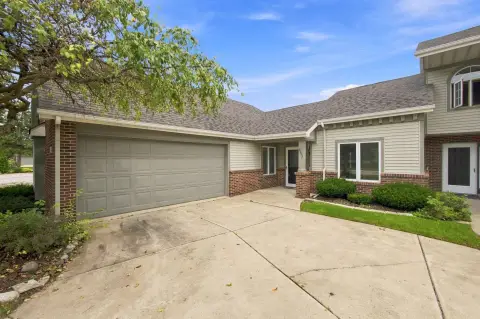
This 4,412-square-foot duplex in White Hawk Country Club includes two bedrooms, three full baths, a loft, and a finished basement. The main level combines a kitchen with stainless steel appliances and island seating, dining and living areas, a sunroom, primary suite, second bedroom or den, and laundry room. Cathedral and vaulted ceilings, hardwood flooring, granite counters, a fireplace, built-ins, and recessed lighting add detail throughout. The lower level expands the layout with a second kitchen, recreation room, dining area, full bath, guest suite, and storage space.
At 1018 Sterling Court in Crown Point, the property overlooks the club’s 36-hole golf course and includes a private patio. White Hawk Country Club also offers a pro shop and restaurant. Additional features include a generator, central air, forced-air natural gas heating, insulated windows, and a sump pump.
At 1018 Sterling Court in Crown Point, the property overlooks the club’s 36-hole golf course and includes a private patio. White Hawk Country Club also offers a pro shop and restaurant. Additional features include a generator, central air, forced-air natural gas heating, insulated windows, and a sump pump.
Key Highlights
- Duplex with 4,412 square feet of finished space
- Two bedrooms, three full baths, loft, and finished basement
- Lower level includes a second kitchen, recreation room, dining area, full bath, and guest suite
Financial Insights
Estimated NOI and Cap Rate
NOI / Yr
$39,034
Cap Rate
6.01%
Suggested Prices Based on Cap Rates
Cap Rate 5%
$780,680
$780.7K
Cap Rate 7%
$557,629
$557.6K
Cap Rate 9%
$433,711
$433.7K
Market Conditions
NOI Build-Up for 4,412 SF
Gross rent
$75.2K $17.04/SF
− Vacancy
−$4.2K −$0.95/SF
EGI
$71.0K $16.09/SF
− OpEx
−$31.9K −$7.24/SF
NOI
$39.0K $8.85/SF
Area
Lake County, IN
Vacancy
5.60%
Lease Rate
$17.04 /SF/Yr
Expense Ratio
45.00%
Simulate Cap Rate and NOI
Suggested Prices Based on Cap Rates
Cap Rate 5%
$780,680
Cap Rate 7%
$557,629
Cap Rate 9%
$433,711
Alternative Uses
Best Use
Apartment 5plus
$557.6K
$487.9K – $650.6K
NOI $39,034 @ 7.0% cap · market cap 6.01%
Second Best
—
—
no second resolved use
Theoretical Best
Specialty Retail
$1.23M
$1.08M – $1.44M
NOI $86,216 @ 7.0% cap · market cap 13.28%
Zoning and permitted uses should be independently verified with authorities.
How Realmo checks its estimates
Property Analytics
Unlock full access to Insights
Subscribe to Realmo Intelligence
Open Analytics
Current Use
Lease Details
2
Residential units
Location Intelligence
Trade Area within ½ mile
48
Businesses Nearby
Explore this area
Business Placement
Demographics for 46307, IN
69,248
Population
26,081
Households
2.7
Avg Household Size
41
Median Age
33%
College-Educated
94%
High-School Grad
87.2 sq mi
ZIP Area
794
Density / Sq Mi
$102,118
Median Household Income
$50,612
Median Earnings
$1,308
Median Rent
$293,500
Median Home Value
Check the figures for this property
Cap Rate, Value Estimation, Potential NOI and more
View Realmo Analytics
Frequently Asked Questions
What type of property is this?
Residential income property - Finished basement, loft, and two kitchens support flexible residential use.
Where is this residential income property located?
The property is located at 1018 Sterling Court Crown Point, IN.
What is the asking price?
The asking price for this property is $649,000.
What are key features of this property?
This property features: Duplex with 4,412 square feet of finished space; Two bedrooms, three full baths, loft, and finished basement; Lower level includes a second kitchen, recreation room, dining area, full bath, and guest suite


