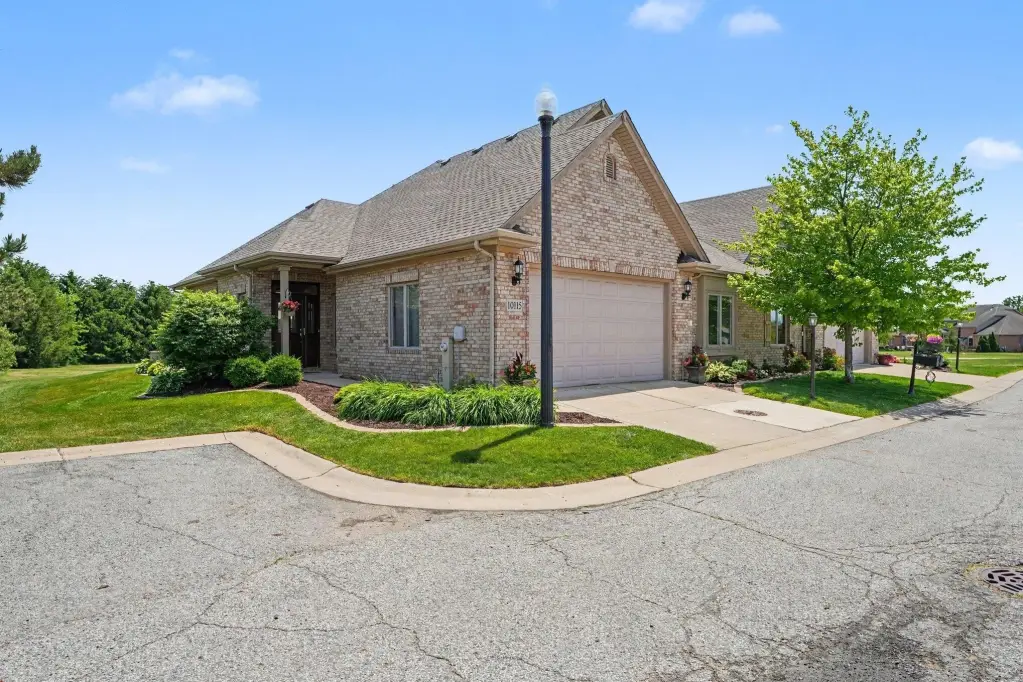
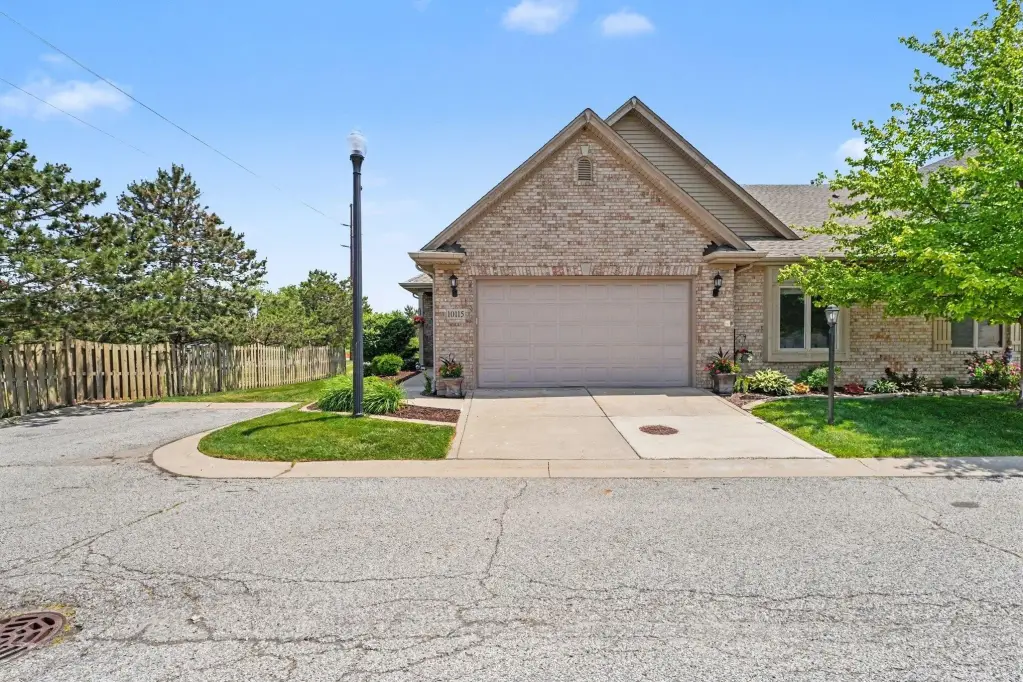
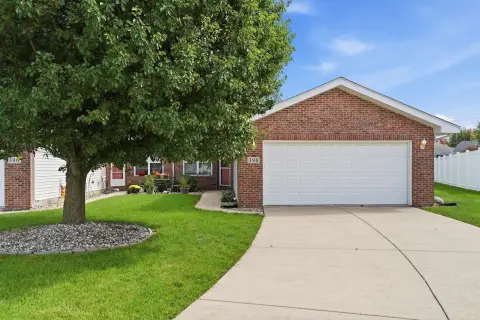
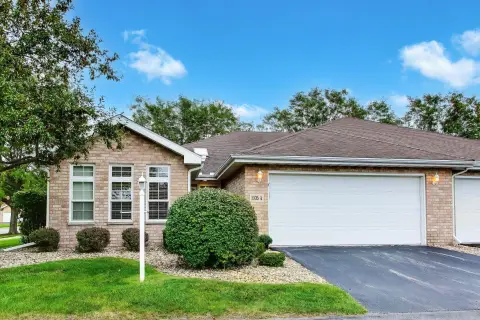
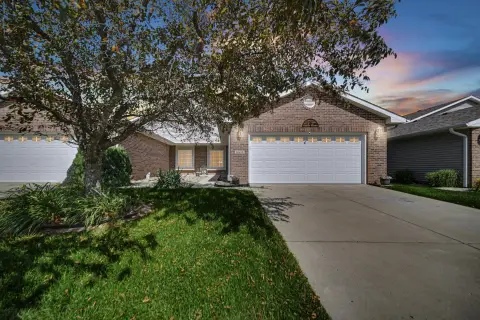
All-Brick Half
For Sale
$350,000
Pending
10115 Texas Lane, Crown Point, IN 46307
Residential, Crown Point, IN
Property Size1,644 SF
Lot Size0.16 Acres
Days on Market135
Property Features for 10115 Texas Lane
General Information
Property type
Residential
Property subtype
Duplex
Bedrooms
2
Bathrooms
2
Full bathrooms
2
Rooms
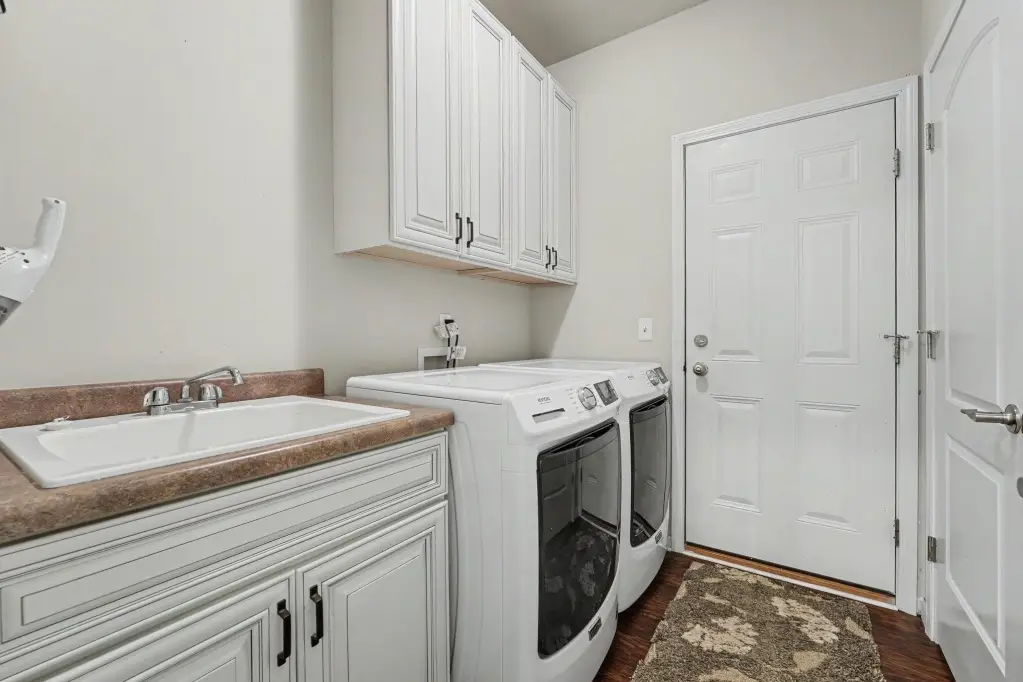
Dining Room, Bathroom 2, Bathroom 1, Bedroom 1, Laundry Room, Bedroom 2
Parking features
Open, Garage
Window features
Insulated Windows
Patio and Porch features
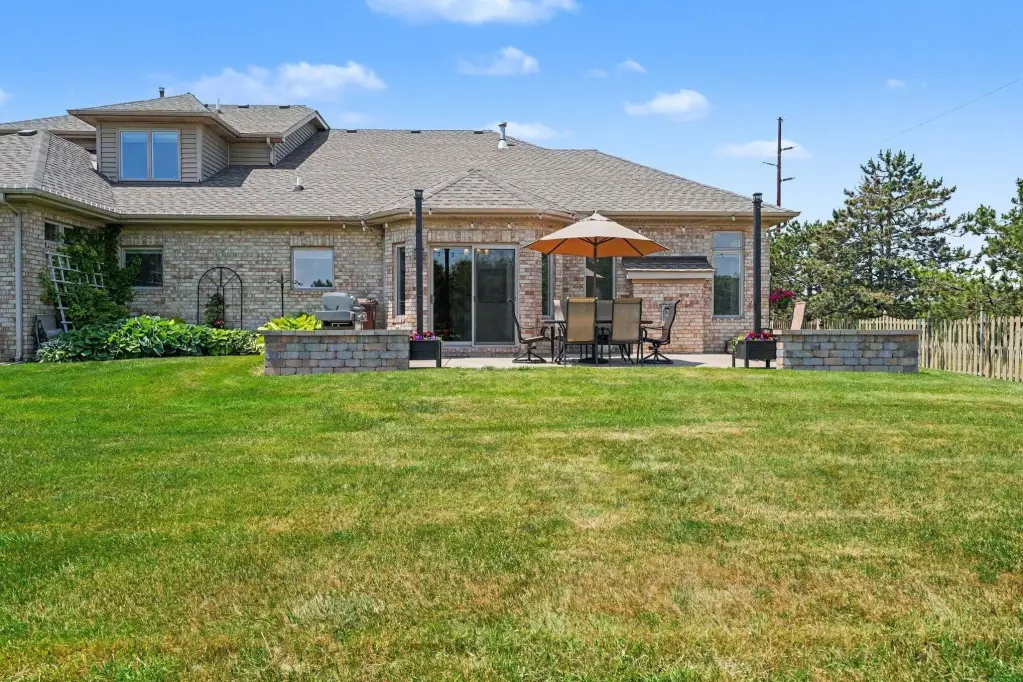
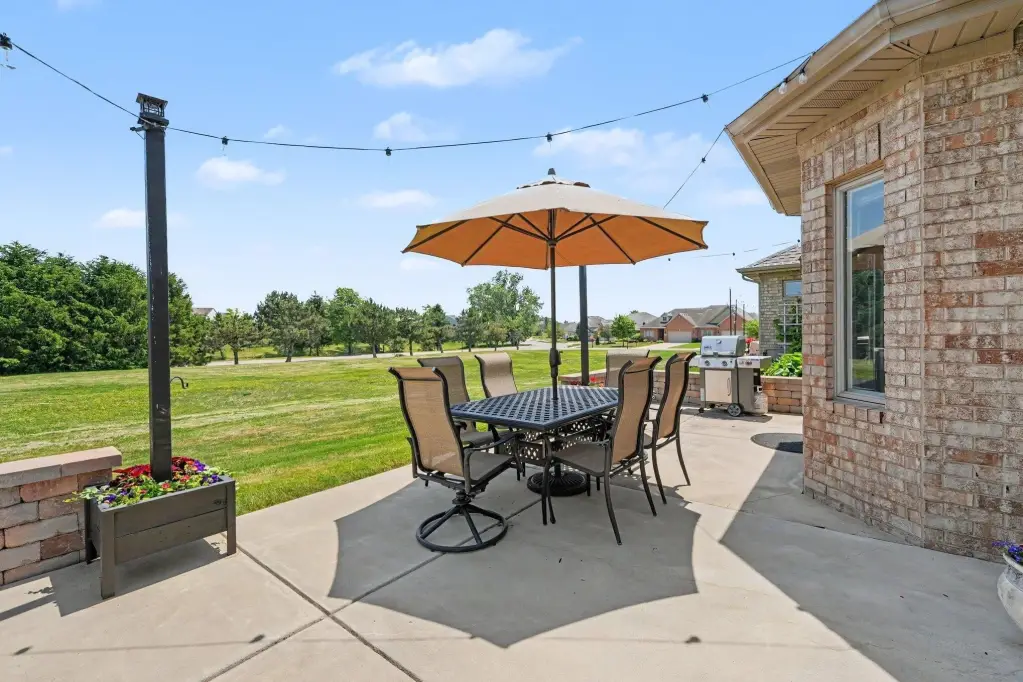
Patio
Interior features
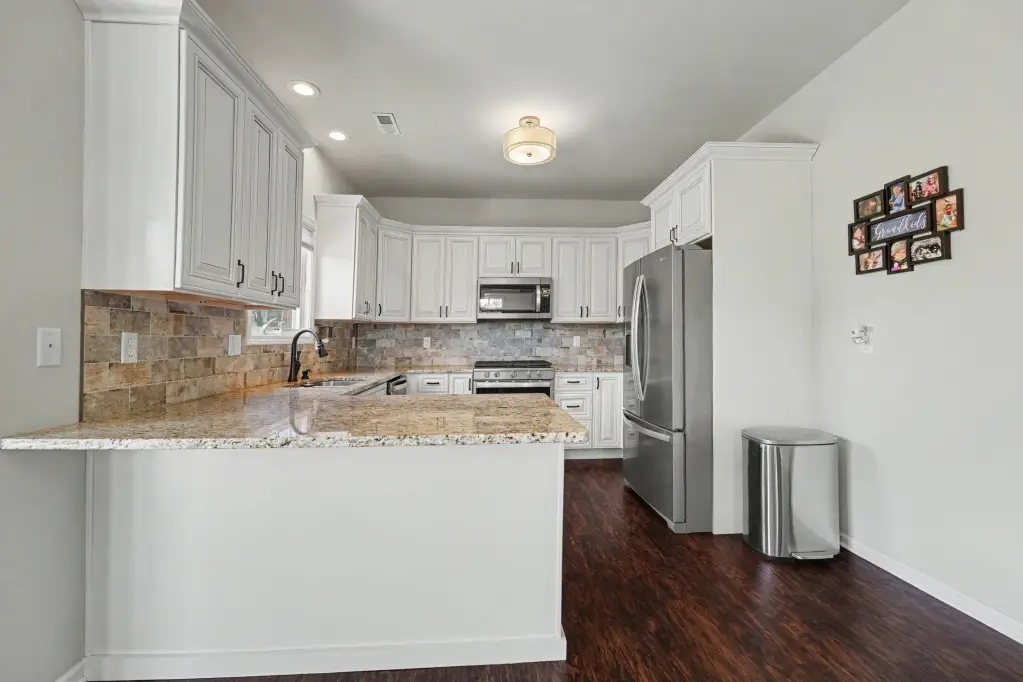
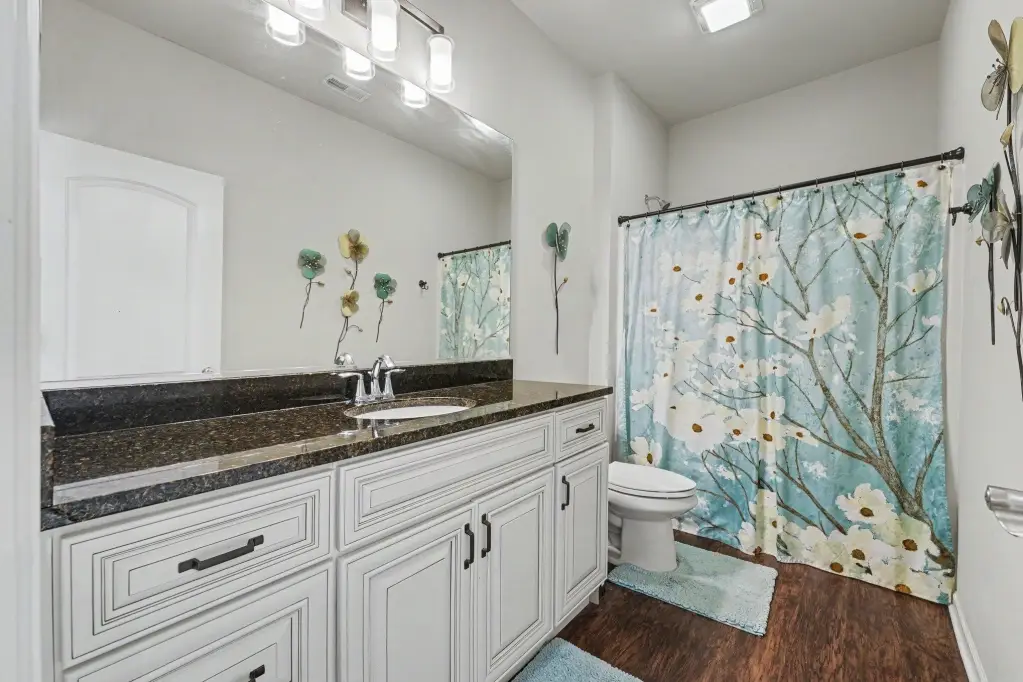
Ceiling Fan(s), Walk-In Closet(s), Soaking Tub, Pantry, Open Floorplan, His and Hers Closets, Granite Counters, Double Vanity
Exterior features
Lighting, Rain Gutters
Fireplace
1
Appliances
Dryer, Washer, Stainless Steel Appliance(s), Refrigerator, Microwave, Gas Water Heater, Gas Range, Dishwasher, Disposal
Subdivision
Summertree Ph 01
Lot features
Landscaped, Sprinklers In Rear, Sprinklers In Front, Rectangular Lot
Directions
You can access Summer Tree off of I65 either at Rt 30 east or 109th exit east. Exit I65 East - two blocks to Mississippi (the stop light) South approximately three miles to 101st East one mile to Summer Tree Estates / California Street.
Standard status
Pending
APN
451602126008000042
Size
1,644 SF
Lot size
0.16 Acres
Taxes and HOA fees
Tax Year
2025
Tax Description
SUMMERTREE PHASE ONE PT OF LOT 4 (10115 TEXAS LANE)
Tax Annual Amount
2896
HOA Fee
$495 Quarterly
Legal Description
SUMMERTREE PHASE ONE PT OF LOT 4 (10115 TEXAS LANE)
Utilities
Sewer type
Public Sewer
Heating system
Natural Gas, Forced Air
Water source
Public
Building Details
Year built
2009
Floors in Building
1
Listing Agency:
Century 21 Circle · Century 21 Real Estate
(219) 738-2455
Listed By:
Shirley Niven
(219) 808-5741
Added: Jun 5
Changed: Oct 11
Last Checked: Oct 17 at 3:06AM
MLS# 840183
Copyright © 2026 Greater Northwest Indiana Association of REALTORS. All rights reserved. All information provided by the listing agent/broker is deemed reliable but is not guaranteed and should be independently verified.

Ask AI about this property
Review the available facts, identify missing information and prepare questions for the agent.
Investment Insights
Based on property information with market context.
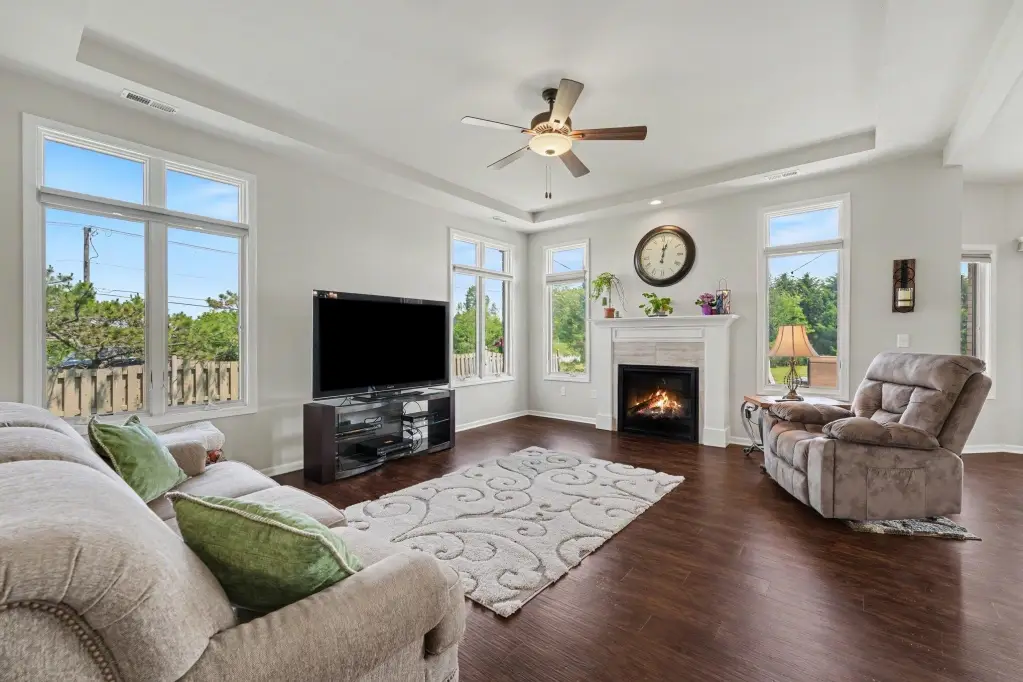
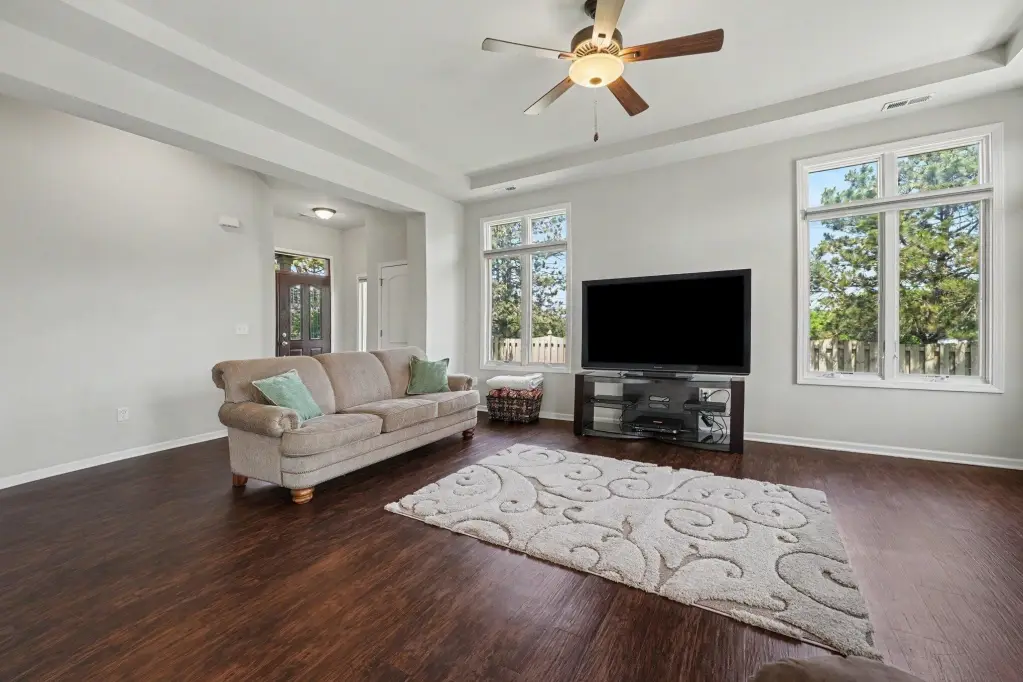
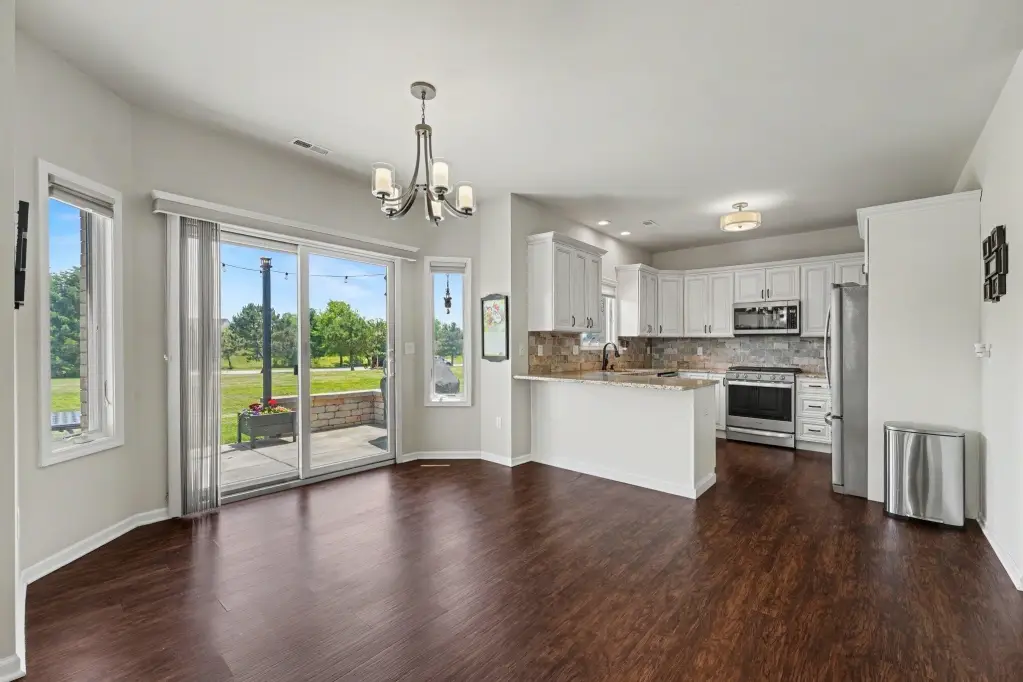
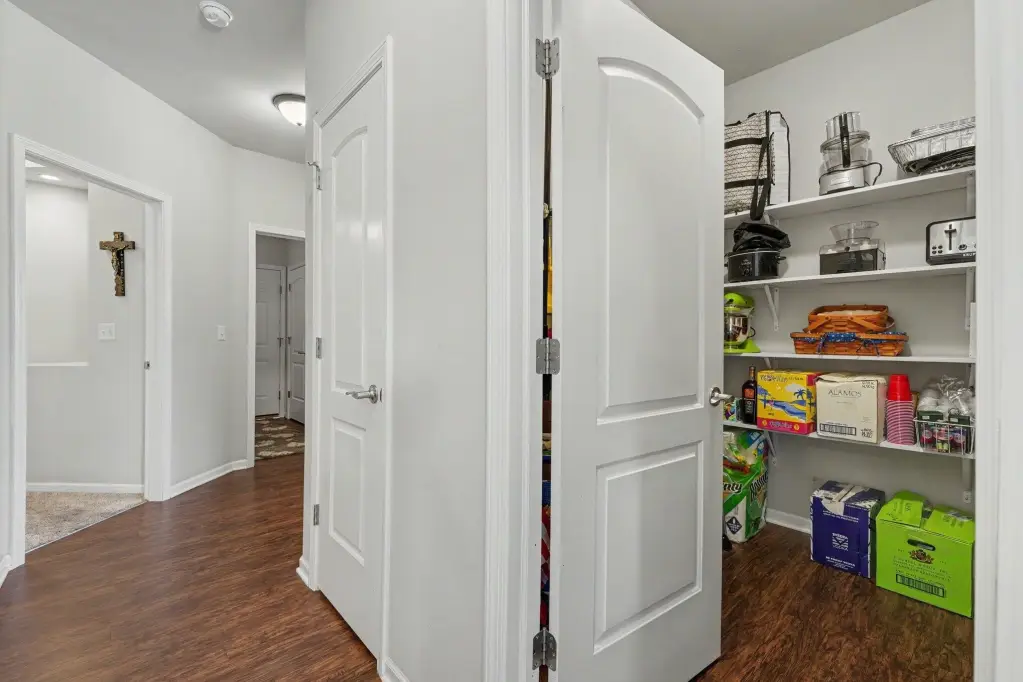
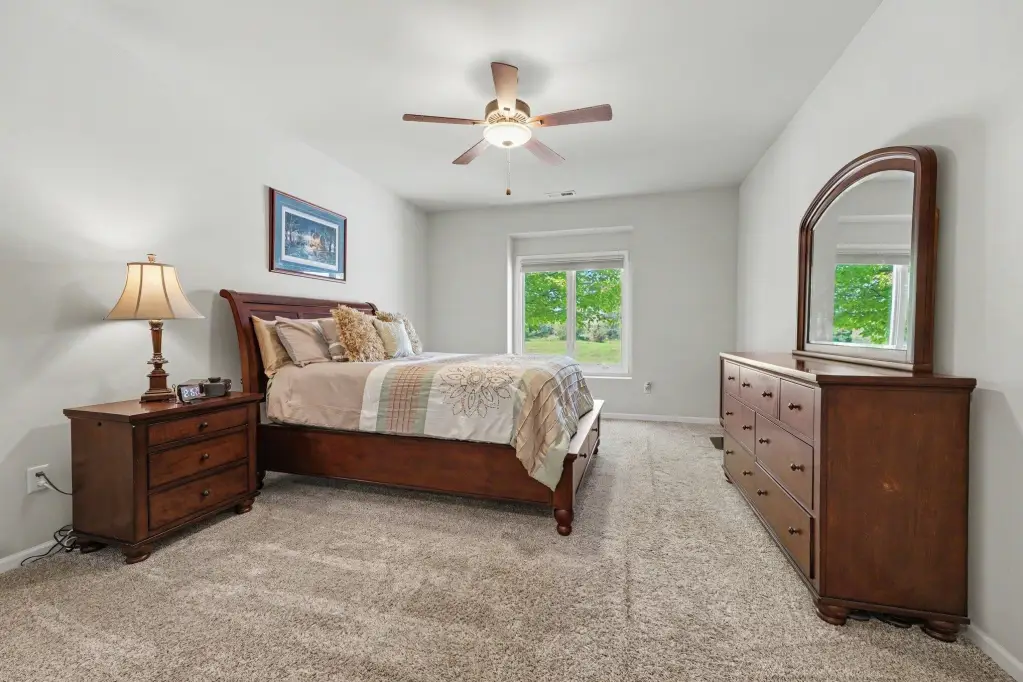
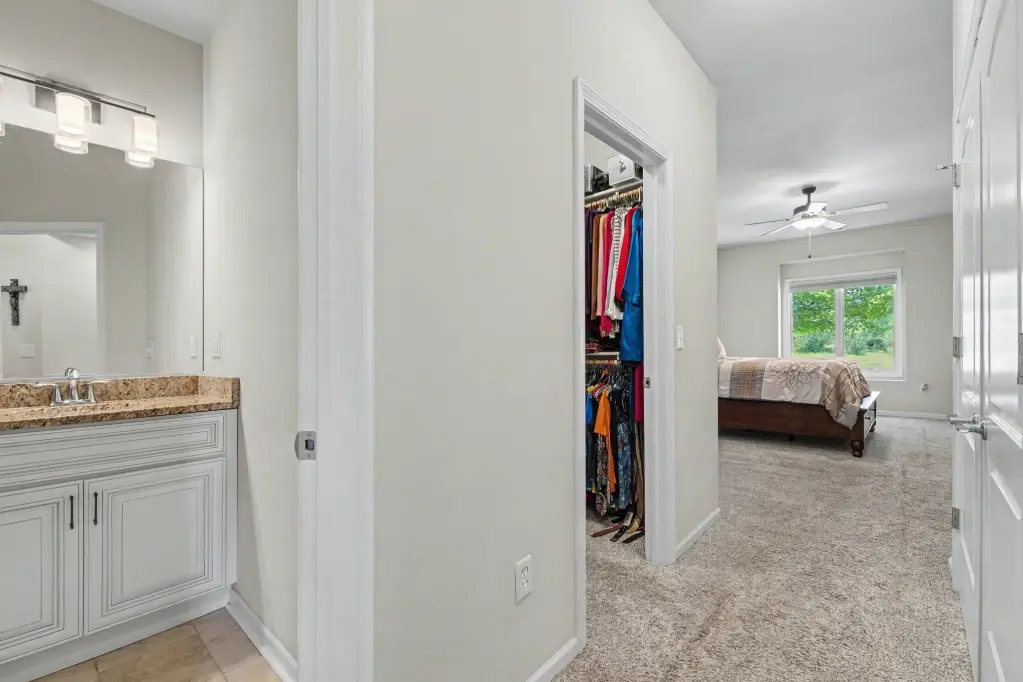
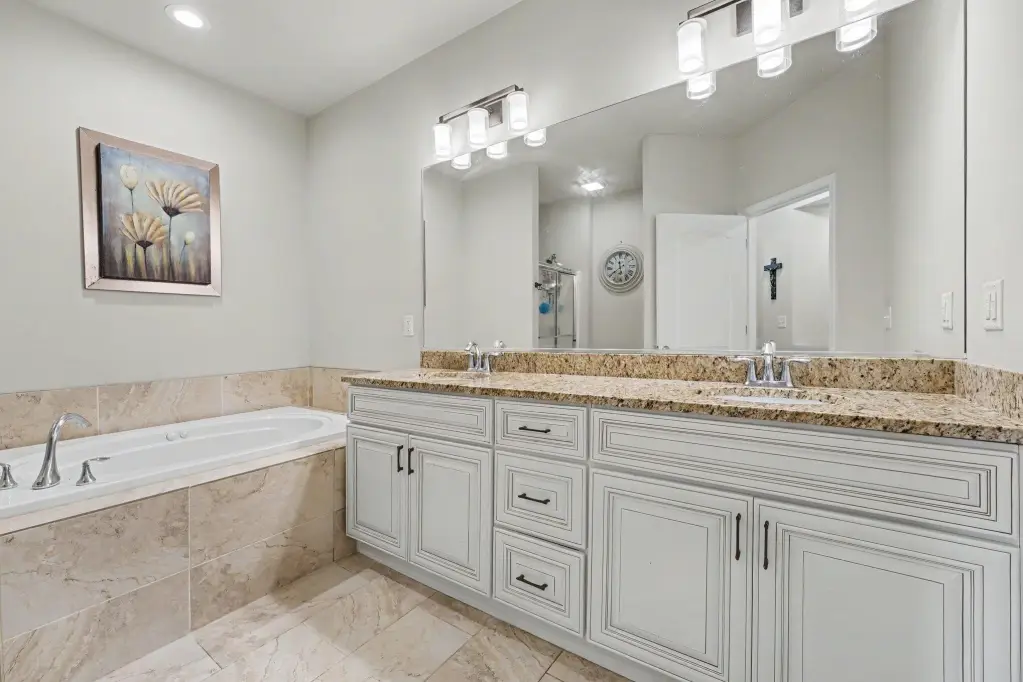
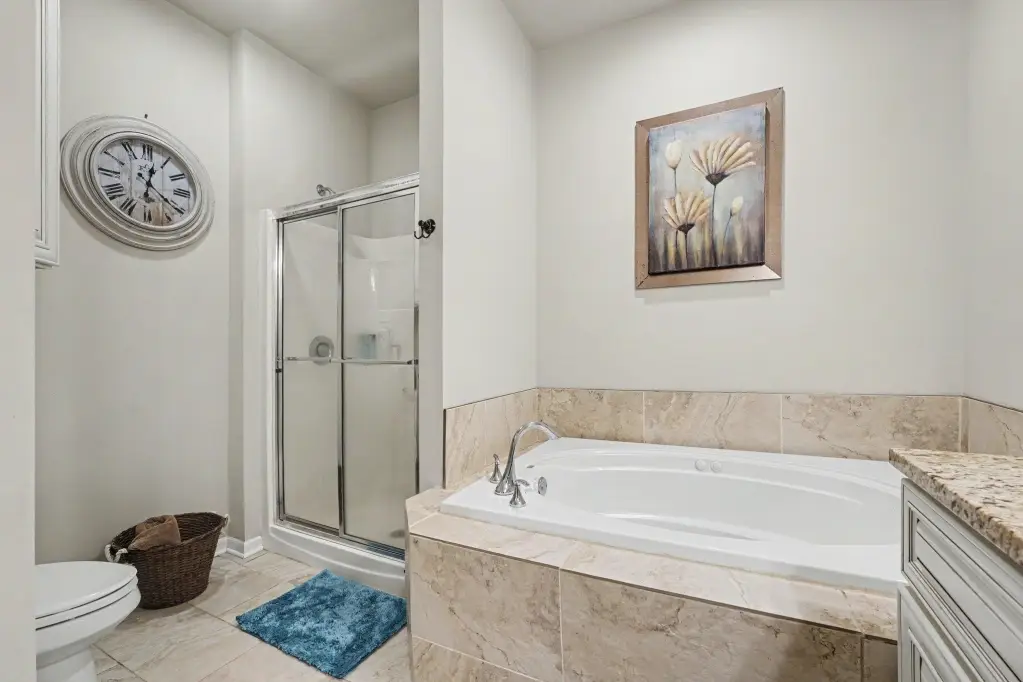
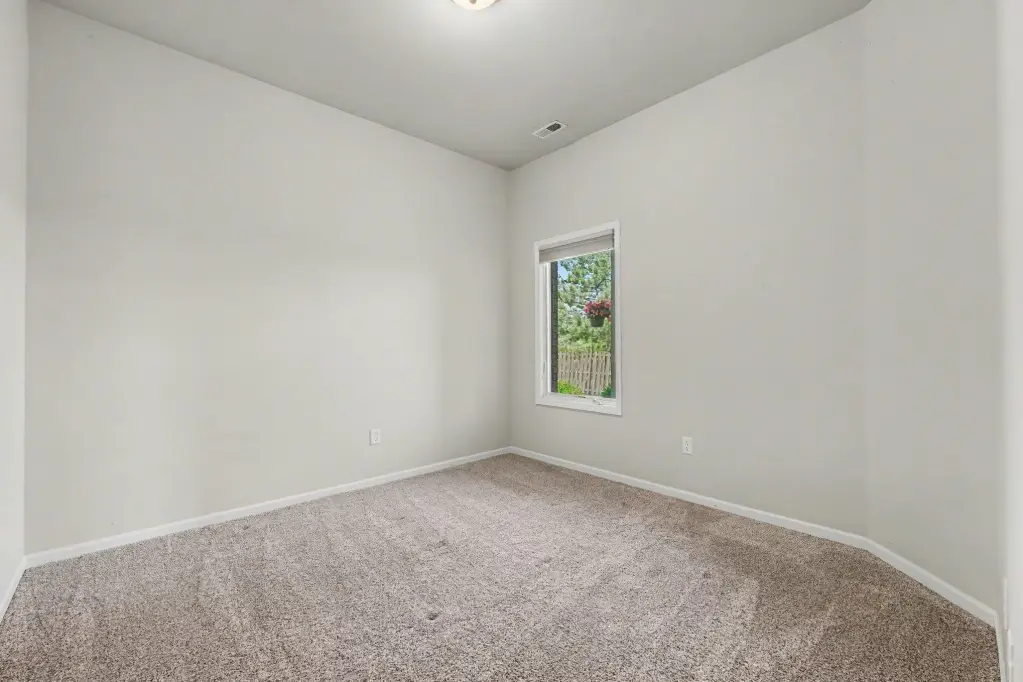
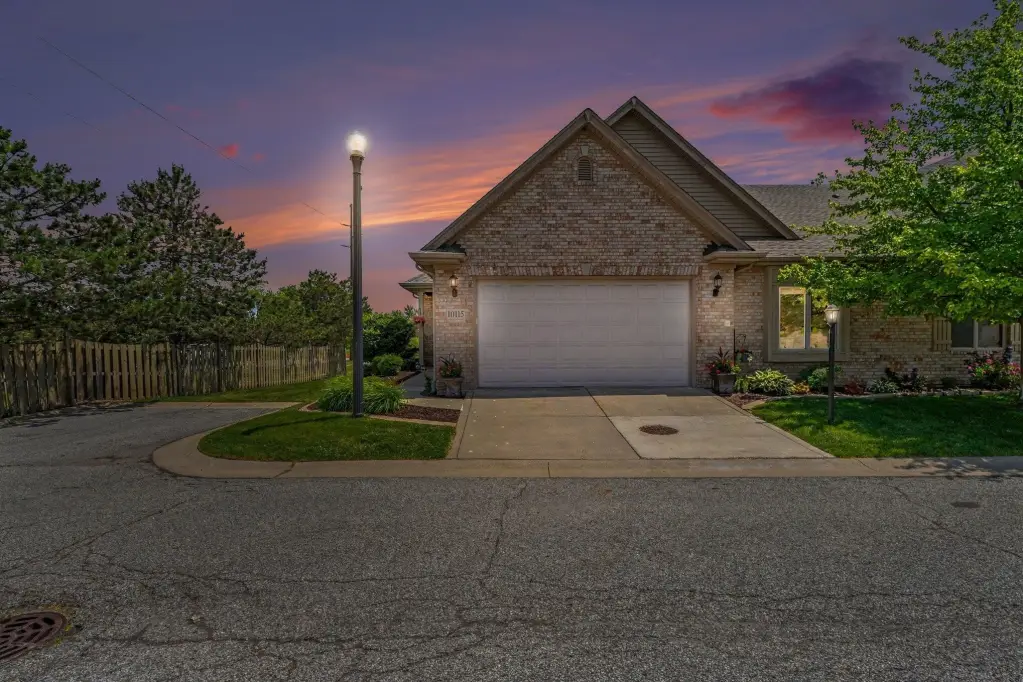
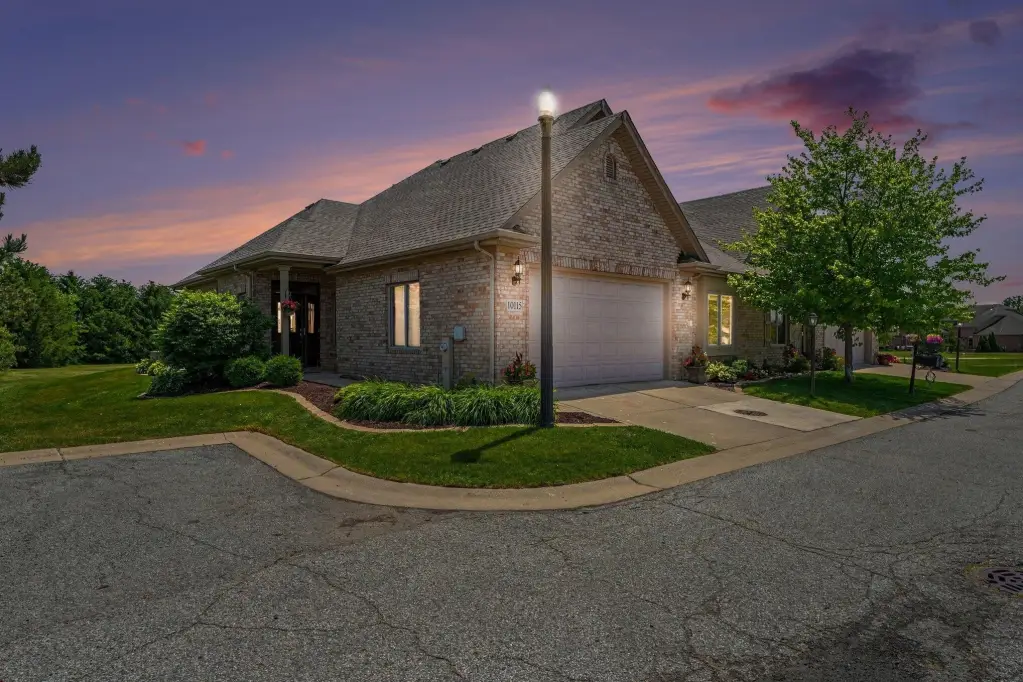
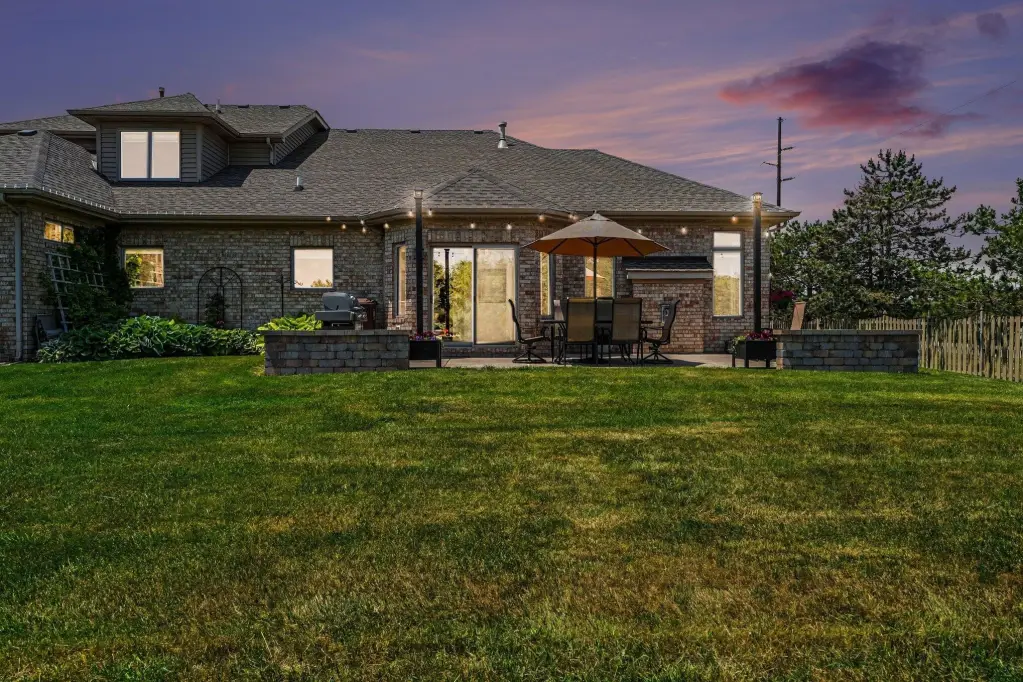
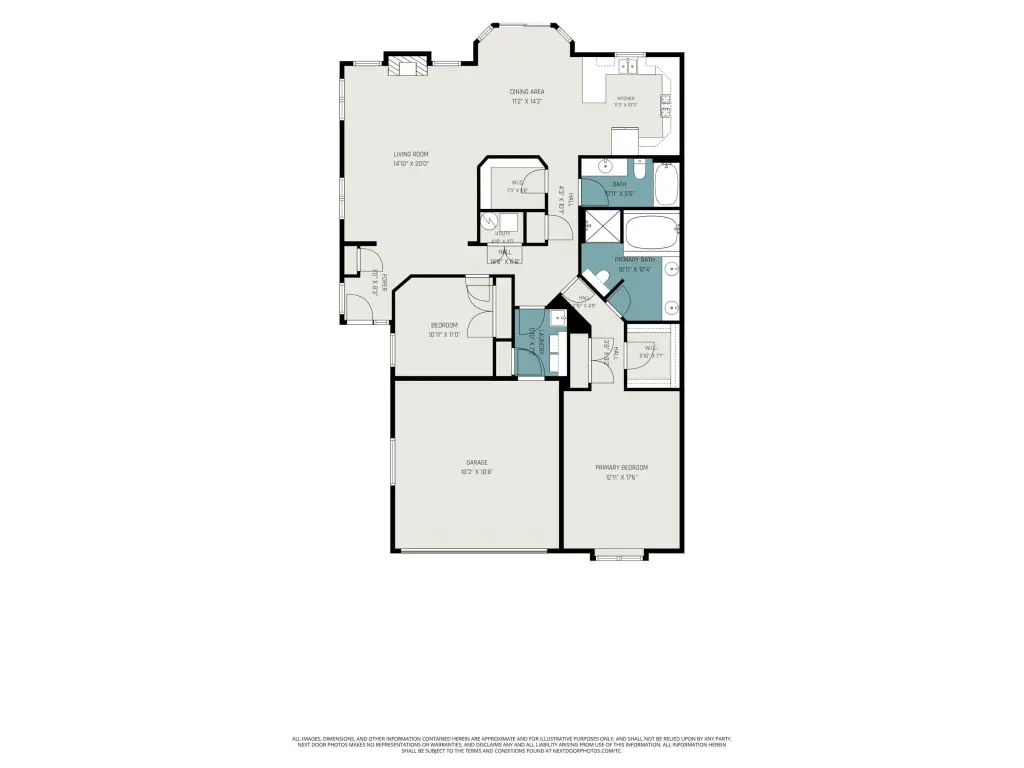
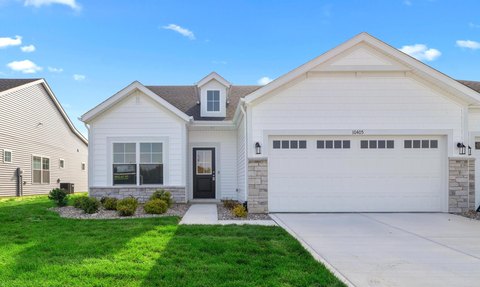
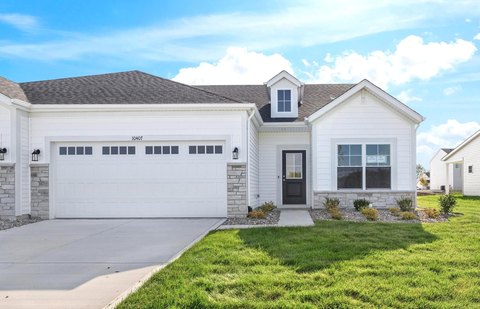
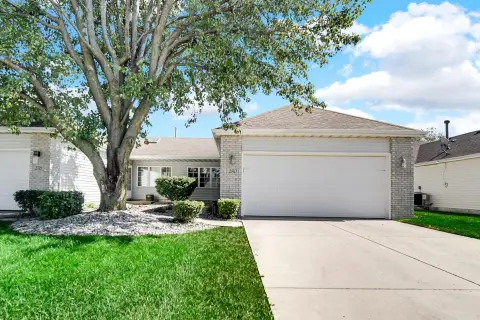
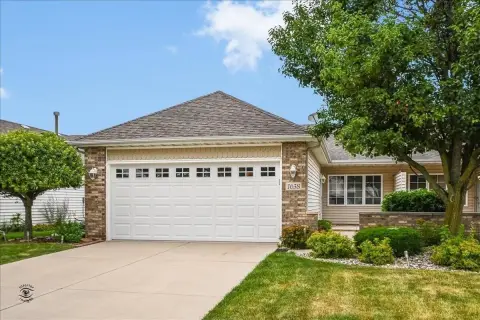
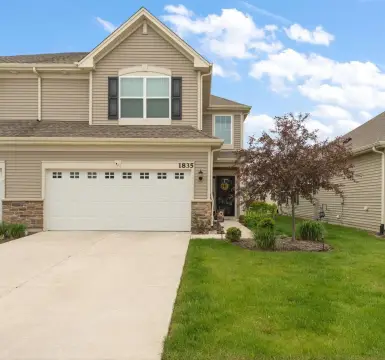
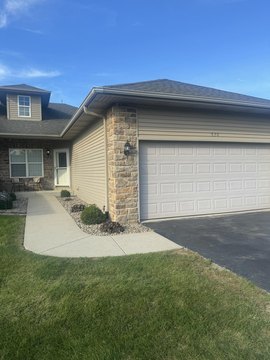
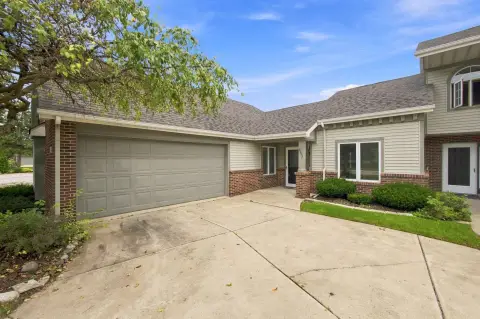
Enjoy maintenance-conscious living in this all-brick half duplex. The home offers 2 bedrooms and 2 full baths, including a private primary suite with double-bowl sinks, a separate shower and tub, and ample storage. An open, inviting layout connects the living room, dining area, and kitchen, with the living space centered by a cozy gas fireplace. The kitchen includes granite countertops, a walk-in pantry, and all stainless appliances are included. Hardwood flooring flows throughout the home, and a custom patio extends the living space outdoors.
A 2-car attached garage adds convenience and additional storage, with pull-down stairs providing attic access. Updates include a roof installed in 2023, with the furnace, A/C, and water heater dated 2019.
Located at 10115 Texas Lane in Crown Point, Indiana, this move-in-ready residence is set up for comfortable day-to-day living with thoughtful finishes and straightforward functionality throughout.
A 2-car attached garage adds convenience and additional storage, with pull-down stairs providing attic access. Updates include a roof installed in 2023, with the furnace, A/C, and water heater dated 2019.
Located at 10115 Texas Lane in Crown Point, Indiana, this move-in-ready residence is set up for comfortable day-to-day living with thoughtful finishes and straightforward functionality throughout.
Key Highlights
- Maintenance‑free all‑brick half duplex built in 2009 with 2 bedrooms and 2 full baths
- Private primary suite with double vanity, separate shower and soaking tub, and walk‑in closets
- Open floor plan with gas fireplace and hardwood flooring
Financial Insights
Estimated NOI and Cap Rate
NOI / Yr
$14,545
Cap Rate
4.16%
Suggested Prices Based on Cap Rates
Cap Rate 5%
$290,900
$290.9K
Cap Rate 7%
$207,786
$207.8K
Cap Rate 9%
$161,611
$161.6K
Market Conditions
NOI Build-Up for 1,644 SF
Gross rent
$28.0K $17.04/SF
− Vacancy
−$1.6K −$0.95/SF
EGI
$26.4K $16.09/SF
− OpEx
−$11.9K −$7.24/SF
NOI
$14.5K $8.85/SF
Area
Lake County, IN
Vacancy
5.60%
Lease Rate
$17.04 /SF/Yr
Expense Ratio
45.00%
Simulate Cap Rate and NOI
Suggested Prices Based on Cap Rates
Cap Rate 5%
$290,900
Cap Rate 7%
$207,786
Cap Rate 9%
$161,611
Alternative Uses
Best Use
Apartment 5plus
$207.8K
$181.8K – $242.4K
NOI $14,545 @ 7.0% cap · market cap 4.16%
Second Best
—
—
no second resolved use
Theoretical Best
Specialty Retail
$458.9K
$401.6K – $535.4K
NOI $32,126 @ 7.0% cap · market cap 9.18%
Zoning and permitted uses should be independently verified with authorities.
How Realmo checks its estimates
Property Analytics
Unlock full access to Insights
Subscribe to Realmo Intelligence
Open Analytics
Current Use
Location Intelligence
Trade Area within ½ mile
14
Businesses Nearby
Explore this area
Business Placement
Demographics for 46307, IN
69,248
Population
26,081
Households
2.7
Avg Household Size
41
Median Age
33%
College-Educated
94%
High-School Grad
87.2 sq mi
ZIP Area
794
Density / Sq Mi
$102,118
Median Household Income
$50,612
Median Earnings
$1,308
Median Rent
$293,500
Median Home Value
Check the figures for this property
Cap Rate, Value Estimation, Potential NOI and more
View Realmo Analytics

Frequently Asked Questions
What type of property is this?
Single family property - All-brick half duplex with 2 bedrooms, 2 full baths, an open floor plan, and a 2-car attached garage.
Where is this single family property located?
The property is located at 10115 Texas Lane Crown Point, IN.
What is the asking price?
The asking price for this property is $350,000.
What are key features of this property?
This property features: Maintenance‑free all‑brick half duplex built in 2009 with 2 bedrooms and 2 full baths; Private primary suite with double vanity, separate shower and soaking tub, and walk‑in closets; Open floor plan with gas fireplace and hardwood flooring