Residential Income Condo with
For Sale
$165,000
1011 ARLINGTON BOULEVARD Unit 501, Arlington, VA 22209
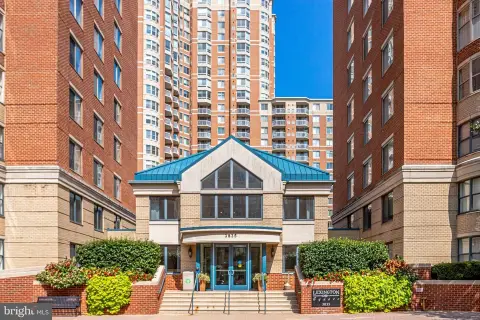
A renovated condo unit with a separate den, pool-view outlook, and full amenity package near Rosslyn Metro.
Property Size463 SF
Days on Market89
Property Features for 1011 ARLINGTON BOULEVARD Unit 501
General Information
Standard status
Active
Size
463 SF
Property subtype
Unit/Flat/Apartment
Site & Location
Neighborhood
Radnor/Fort Myer Heights
Public Transit
Yes
Additional Details
HOA Fee
$360
Multifamily Units
1
Taxes and HOA fees
Annual Taxes
$1,488
Amenities
pool
hot tub
fitness center
24-hour concierge
dry cleaner
convenience store
Building Details
Building Size
463 SF
Year Built
1955
Listing Agency:
Pearson Smith Realty, LLC
Listed By:
Patrick H Giannelli · License #0225099552
(703) 624-1728
Source:
Kwcapitalproperties
Added: Jul 29
Changed: Oct 25
Last Checked: Oct 24 at 10:51PM
Displayed information is deemed reliable but is not guaranteed and should be independently verified. All listing content including descriptions, pricing, images are the copyrighted material of Pearson Smith Realty, LLC

Ask AI about this property
Review the available facts, identify missing information and prepare questions for the agent.
Investment Insights
Based on property information with market context.
A residential income condo unit built in 1955 with a separate den that fits a full-size bed. The kitchen and bath have been fully renovated, and the interior finishes include beautiful floors, granite counters, fresh paint, and cordless blinds. The unit also features a walk-in closet and a pool view.
Conveniently located about three blocks to the Rosslyn Metro and roughly four blocks to the Key Bridge and the W&OD trail. It’s also positioned minutes to Georgetown, downtown DC, and Amazon HQ2.
Residents enjoy a full amenity package, including a pool, hot tub, fitness center, 24-hour concierge, and additional onsite services such as a dry cleaner and convenience store.
Conveniently located about three blocks to the Rosslyn Metro and roughly four blocks to the Key Bridge and the W&OD trail. It’s also positioned minutes to Georgetown, downtown DC, and Amazon HQ2.
Residents enjoy a full amenity package, including a pool, hot tub, fitness center, 24-hour concierge, and additional onsite services such as a dry cleaner and convenience store.
Key Highlights
- Separate den area fits a full‑size bed
- Kitchen and bath fully renovated with granite counters
- Walk‑in closet and pool‑view outlook
Financial Insights
Estimated NOI and Cap Rate
NOI / Yr
$6,967
Cap Rate
4.22%
Suggested Prices Based on Cap Rates
Cap Rate 5%
$139,340
$139.3K
Cap Rate 7%
$99,529
$99.5K
Cap Rate 9%
$77,411
$77.4K
Market Conditions
NOI Build-Up for 463 SF
Gross rent
$13.3K $28.80/SF
− Vacancy
−$667 −$1.44/SF
EGI
$12.7K $27.36/SF
− OpEx
−$5.7K −$12.31/SF
NOI
$7.0K $15.05/SF
Area
Arlington, VA
Vacancy
5.00%
Lease Rate
$28.80 /SF/Yr
Expense Ratio
45.00%
Simulate Cap Rate and NOI
Suggested Prices Based on Cap Rates
Cap Rate 5%
$139,340
Cap Rate 7%
$99,529
Cap Rate 9%
$77,411
Alternative Uses
Best Use
Apartment 5plus
$99.5K
$87.1K – $116.1K
NOI $6,967 @ 7.0% cap · market cap 4.22%
Second Best
—
—
no second resolved use
Theoretical Best
Specialty Retail
$257.2K
$225.0K – $300.0K
NOI $18,001 @ 7.0% cap · market cap 10.91%
Zoning and permitted uses should be independently verified with authorities.
How Realmo checks its estimates
Property Analytics
Unlock full access to Insights
Subscribe to Realmo Intelligence
Open Analytics
Lease Details
1
Residential units
Location Intelligence
Trade Area within ½ mile
2,278
Businesses Nearby
Explore this area
Business Placement
Demographics for 22209, VA
14,859
Population
9,261
Households
1.6
Avg Household Size
33
Median Age
86%
College-Educated
98%
High-School Grad
0.7 sq mi
ZIP Area
21,227
Density / Sq Mi
$110,824
Median Household Income
$83,221
Median Earnings
$2,171
Median Rent
$799,900
Median Home Value
Check the figures for this property
Cap Rate, Value Estimation, Potential NOI and more
View Realmo Analytics




Frequently Asked Questions
What type of property is this?
Residential income property - A renovated condo unit with a separate den, pool-view outlook, and full amenity package near Rosslyn Metro.
Where is this residential income property located?
The property is located at 1011 ARLINGTON BOULEVARD Unit 501 Arlington, VA.
What is the asking price?
The asking price for this property is $165,000.
What are key features of this property?
This property features: Separate den area fits a full‑size bed; Kitchen and bath fully renovated with granite counters; Walk‑in closet and pool‑view outlook


