Renovated Four-Unit
For Sale
Contact for pricing
1011-1013 Bennett Avenue, Colorado Springs, CO 80909
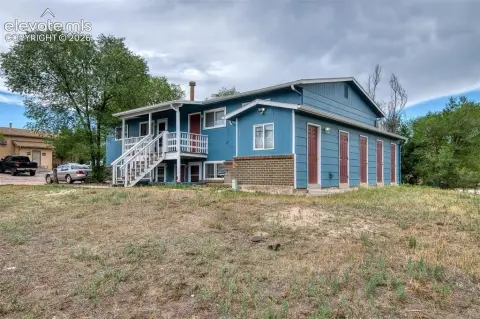
Recently renovated four-unit property with 2-bedroom layouts, in-unit laundry, and off-street parking.
Property Size3,600 SF
Price / SF$194.17
Days on Market129

Ask AI about this property
Review the available facts, identify missing information and prepare questions for the agent.
Property Features for 1011-1013 Bennett Avenue
General Information
Standard status
Active
Size
3,600 SF
Total Parking Spaces
4
Property subtype
Retail, Multifamily
Zoning
R5
Building Details
Year Built
1985
Buildings
2
Units
4
Tenancy
Multi
Listing Agency:
Cushman & Wakefield - Denver, Colorado
Listed By:
Lee Wagner · License #CO 100084704
(417) 459-2155
Source:
Crexi
Added: Jun 9
Changed: Oct 15
Last Checked: Oct 14 at 8:03PM
Displayed information is deemed reliable but is not guaranteed and should be independently verified. All listing content including descriptions, pricing, images are the copyrighted material of Cushman & Wakefield - Denver, Colorado
Investment Insights
Based on property information with market context.
1011-1013 Bennett Avenue is a recently renovated four-unit multifamily property offering two-bedroom, two-bath residences across 4 total units. Each unit features a functional floorplan with updated interiors and in-unit laundry, designed to support everyday livability. Off-street parking is also included, adding convenience for residents.
The asset is positioned in Colorado Springs and is described as being located in an infill setting with convenient access to major employment centers, military installations, and downtown Colorado Springs. This central convenience can be relevant for tenants who value shorter commutes and access to a range of area destinations.
For investors or owner-operators, this configuration provides an efficient unit mix of spacious 2-bedroom, 2-bath homes. The combination of recent renovations, in-unit laundry, and off-street parking may appeal to renters seeking modern in-home amenities while supporting practical day-to-day management. The property is being offered for sale as a 4-unit income-focused multifamily opportunity.
The asset is positioned in Colorado Springs and is described as being located in an infill setting with convenient access to major employment centers, military installations, and downtown Colorado Springs. This central convenience can be relevant for tenants who value shorter commutes and access to a range of area destinations.
For investors or owner-operators, this configuration provides an efficient unit mix of spacious 2-bedroom, 2-bath homes. The combination of recent renovations, in-unit laundry, and off-street parking may appeal to renters seeking modern in-home amenities while supporting practical day-to-day management. The property is being offered for sale as a 4-unit income-focused multifamily opportunity.
Key Highlights
- Recently renovated 4‑unit multifamily built in 1985
- All units are 2 bed / 2 bath, averaging about 800 SF each
- Units include in‑unit laundry
Financial Insights
Estimated NOI and Cap Rate
NOI / Yr
$47,152
Cap Rate
6.75%
Suggested Prices Based on Cap Rates
Cap Rate 5%
$943,040
$943.0K
Cap Rate 7%
$673,600
$673.6K
Cap Rate 9%
$523,911
$523.9K
Market Conditions
NOI Build-Up for 3,600 SF
Gross rent
$71.3K $19.80/SF
− Vacancy
−$3.9K −$1.09/SF
EGI
$67.4K $18.71/SF
− OpEx
−$20.2K −$5.61/SF
NOI
$47.2K $13.10/SF
Area
Colorado Springs, CO
Vacancy
5.50%
Lease Rate
$19.80 /SF/Yr
Expense Ratio
30.00%
Simulate Cap Rate and NOI
Suggested Prices Based on Cap Rates
Cap Rate 5%
$943,040
Cap Rate 7%
$673,600
Cap Rate 9%
$523,911
Alternative Uses
Best Use
Multifamily LT 5
$673.6K
$589.4K – $785.9K
NOI $47,152 @ 7.0% cap · market cap 6.75%
Second Best
Apartment 5plus
$624.2K
$546.2K – $728.3K
NOI $43,697 @ 7.0% cap · market cap 6.25%
Theoretical Best
Specialty Retail
$710.9K
$622.1K – $829.4K
NOI $49,766 @ 7.0% cap · market cap 7.12%
Zoning and permitted uses should be independently verified with authorities.
How Realmo checks its estimates
Property Analytics
Unlock full access to Insights
Subscribe to Realmo Intelligence
Open Analytics
Current Use
Location Intelligence
Trade Area within ½ mile
910
Businesses Nearby
Explore this area
Business Placement
Demographics for 80909, CO
37,302
Population
16,572
Households
2.3
Avg Household Size
38
Median Age
28%
College-Educated
92%
High-School Grad
7.9 sq mi
ZIP Area
4,722
Density / Sq Mi
$61,777
Median Household Income
$36,894
Median Earnings
$1,227
Median Rent
$352,400
Median Home Value
Check the figures for this property
Cap Rate, Value Estimation, Potential NOI and more
View Realmo Analytics
Market
Vacancy Rate% for Multifamily in West region


Frequently Asked Questions
What type of property is this?
Quadplex - Recently renovated four-unit property with 2-bedroom layouts, in-unit laundry, and off-street parking.
Where is this quadplex located?
The property is located at 1011-1013 Bennett Avenue Colorado Springs, CO.
What is the asking price?
The asking price for this property is $699,000.
What are key features of this property?
This property features: Recently renovated 4‑unit multifamily built in 1985; All units are 2 bed / 2 bath, averaging about 800 SF each; Units include in‑unit laundry


