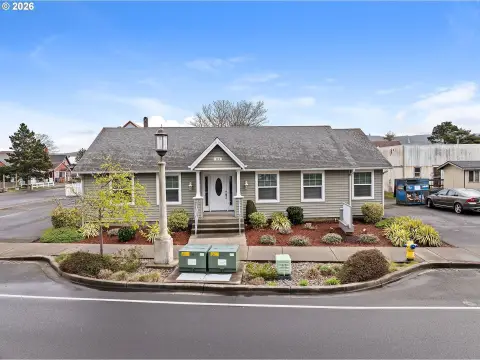
Single-Story Office
For Sale
$449,000
1010 3rd Ave, Seaside, OR 97138
Two occupied units provide an existing multi-tenant configuration near Highway 101 in Seaside.
Property Size1,755 SF
Lot Size0.21 Acres
Price / SF$255.84
Days on Market47
Property Features for 1010 3rd Ave
General Information
Standard status
Active
Size
1,755 SF
Lot size
0.21 Acres
Zoning
R2
Site & Location
Highway Access
Yes
Utilities to Site
Yes
Additional Details
Office Units
2
Building Details
Year Built
1980
Buildings
1
Stories
1
Building Size
1,755 SF
Tenancy
Multi
Listing Agency:
Keller Williams Sunset Corridor
Listed By:
David Hoggard · License #200306004
(503) 440-4670
Source:
Rosecityrealtygroup
Added: Sep 7
Changed: Oct 3
Last Checked: Oct 7 at 2:58PM
Displayed information is deemed reliable but is not guaranteed and should be independently verified. All listing content including descriptions, pricing, images are the copyrighted material of Keller Williams Sunset Corridor

Ask AI about this property
Review the available facts, identify missing information and prepare questions for the agent.
Investment Insights
Based on property information with market context.
This 1,755-square-foot office building at 1010 3rd Ave in Seaside provides a single-story layout on a 0.21-acre lot. Constructed in 1980, the property has two occupied units, a heat pump system, and connections to public water and sewer. Off-street parking is available on the site, and the stated zoning is R2 for commercial use.
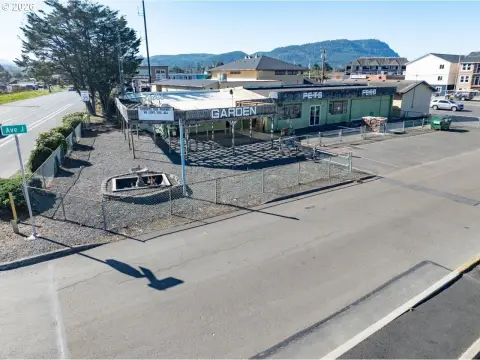
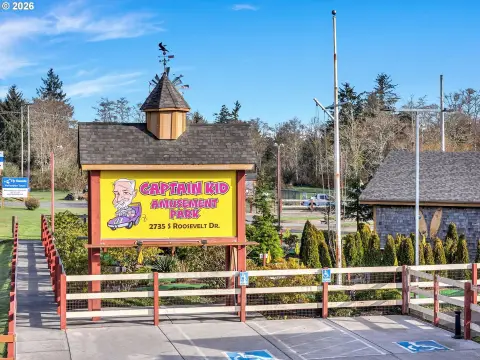
The property sits near the intersection of Highway 101 and 3rd Avenue, placing it within Seaside’s active commercial area and near the city’s downtown district. Its coastal Oregon setting is supported by a year-round tourism economy and established resort activity.
The property sits near the intersection of Highway 101 and 3rd Avenue, placing it within Seaside’s active commercial area and near the city’s downtown district. Its coastal Oregon setting is supported by a year-round tourism economy and established resort activity.
Key Highlights
- 1,755‑square‑foot office building on a 0.21‑acre lot
- Two occupied units with a multi‑tenant configuration
- Single‑story building constructed in 1980
Financial Insights
Estimated NOI and Cap Rate
NOI / Yr
$29,467
Cap Rate
6.56%
Suggested Prices Based on Cap Rates
Cap Rate 5%
$589,340
$589.3K
Cap Rate 7%
$420,957
$421.0K
Cap Rate 9%
$327,411
$327.4K
Market Conditions
NOI Build-Up for 1,755 SF
Gross rent
$46.3K $26.40/SF
− Vacancy
−$7.0K −$4.01/SF
EGI
$39.3K $22.39/SF
− OpEx
−$9.8K −$5.60/SF
NOI
$29.5K $16.79/SF
Area
Clatsop County, OR
Vacancy
15.20%
Lease Rate
$26.40 /SF/Yr
Expense Ratio
25.00%
Simulate Cap Rate and NOI
Suggested Prices Based on Cap Rates
Cap Rate 5%
$589,340
Cap Rate 7%
$420,957
Cap Rate 9%
$327,411
Alternative Uses
Best Use
Office B
$421.0K
$368.3K – $491.1K
NOI $29,467 @ 7.0% cap · market cap 6.56%
Second Best
—
—
no second resolved use
Theoretical Best
Office A
$510.3K
$446.5K – $595.3K
NOI $35,718 @ 7.0% cap · market cap 7.96%
Zoning and permitted uses should be independently verified with authorities.
How Realmo checks its estimates
Property Analytics
Contact the owner directly
Get the owner's phone numbers and email
Open Analytics
Current Use
Lease Details
2
Office units
Multi-tenant
Tenancy
Yes
Highway access
Yes
Utilities to site
Location Intelligence
Trade Area within ½ mile
Explore this area
Business Placement
Demographics for 97138, OR
11,248
Population
7,785
Households
1.4
Avg Household Size
48
Median Age
28%
College-Educated
92%
High-School Grad
146.0 sq mi
ZIP Area
77
Density / Sq Mi
$51,993
Median Household Income
$39,285
Median Earnings
$1,004
Median Rent
$433,200
Median Home Value
Check the figures for this property
Cap Rate, Value Estimation, Potential NOI and more
View Realmo Analytics
Market
Vacancy Rate% for Office in West region




Frequently Asked Questions
What type of property is this?
Office building - Two occupied units provide an existing multi-tenant configuration near Highway 101 in Seaside.
Where is this office building located?
The property is located at 1010 3rd Ave Seaside, OR.
What is the asking price?
The asking price for this property is $449,000.
What are key features of this property?
This property features: 1,755‑square‑foot office building on a 0.21‑acre lot; Two occupied units with a multi‑tenant configuration; Single‑story building constructed in 1980


