Historic Mixed-Use
For Sale
$475,000
1007 Wealthy Street SE, Grand Rapids, MI 49506
Commercial Sale, Grand Rapids, MI
Property Size3,600 SF
Lot Size0.09 Acres
Price / SF$131.94
Days on Market51
Property Features for 1007 Wealthy Street SE
General Information
Property type
Commercial Sale
Property subtype
Retail
Zoning description
TBA TN
Rooms
Basement
Interior features
Broadband
Elementary school district
Grand Rapids
Middle school district
Grand Rapids
High school district
Grand Rapids
Standard status
Active
APN
41-14-29-379-021
Size
3,600 SF
Lot size
0.09 Acres
Taxes and HOA fees
Tax Year
2026
Tax Description
LOT 1683* STEINMANN S ASSESSOR S PLAT NO 58
Tax Annual Amount
6415
Legal Description
LOT 1683* STEINMANN S ASSESSOR S PLAT NO 58
Utilities
Utilities
Cable Available
Building Details
Year built
1884
Number of units
2
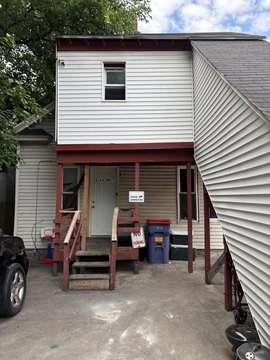
Building materials
Wood Siding
Roof type
Rubber
Listing Agency:
Urban Soil Realty
Listed By:
Bradley S Veneklase · License #6505408520
(616) 437-1065
Added: Aug 17
Changed: Sep 12
Last Checked: Oct 6 at 1:06AM
MLS# 26043253
Copyright © 2026 Michigan Regional Information Center, LLC. All rights reserved. All information provided by the listing agent/broker is deemed reliable but is not guaranteed and should be independently verified.
Investment Insights
Based on property information with market context.
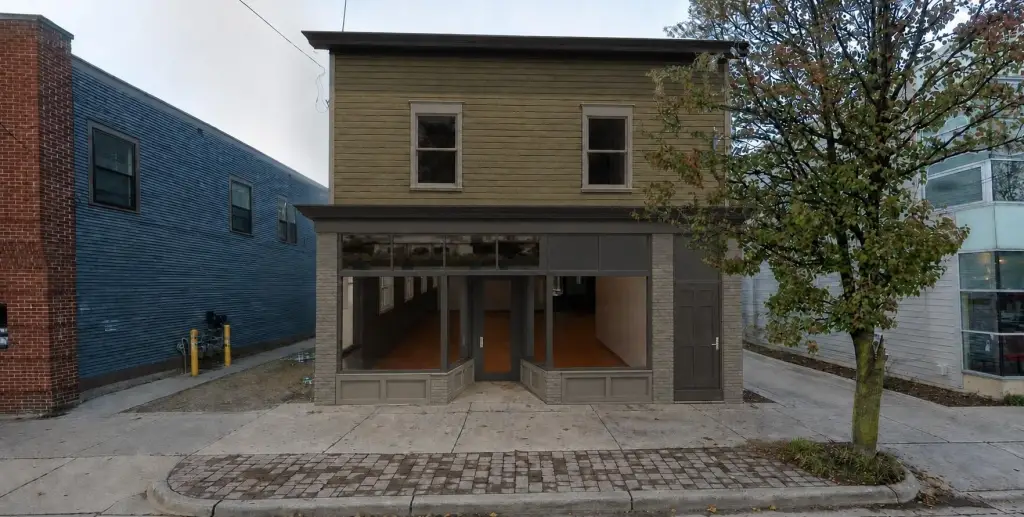
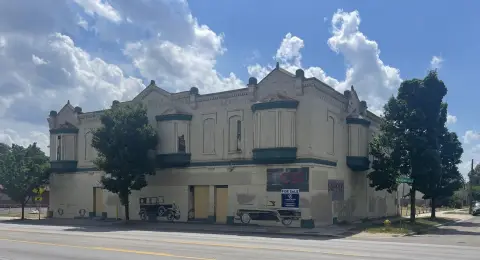
Built in 1884, this 3,600-square-foot mixed-use property is supported by Historic Preservation Commission approval and completed permit drawings. The approved layout provides four one-bedroom apartments, each with in-unit laundry, above approximately 1,800 square feet of main-floor white-box commercial space with two restrooms. The commercial area is identified for retail, hospitality, restaurant, or office use.
The property is located at 1007 Wealthy Street SE in Grand Rapids, along the Wealthy Street corridor between Electric Cheetah and The Meanwhile Bar. Three vehicle parking spaces are included, along with a rear yard that offers patio potential. Additional property features include a basement, wood siding, rubber roofing, broadband, and cable availability.
The property is located at 1007 Wealthy Street SE in Grand Rapids, along the Wealthy Street corridor between Electric Cheetah and The Meanwhile Bar. Three vehicle parking spaces are included, along with a rear yard that offers patio potential. Additional property features include a basement, wood siding, rubber roofing, broadband, and cable availability.
Key Highlights
- 1884‑built mixed‑use building totaling 3,600 SF
- Approved layout includes four one‑bedroom apartments with in‑unit laundry
- Approximately 1,800 SF of main‑floor white‑box commercial space
Financial Insights
Estimated NOI and Cap Rate
NOI / Yr
$39,744
Cap Rate
8.37%
Suggested Prices Based on Cap Rates
Cap Rate 5%
$794,880
$794.9K
Cap Rate 7%
$567,771
$567.8K
Cap Rate 9%
$441,600
$441.6K
Market Conditions
NOI Build-Up for 3,600 SF
Gross rent
$69.1K $19.20/SF
− Vacancy
−$5.5K −$1.54/SF
EGI
$63.6K $17.66/SF
− OpEx
−$23.8K −$6.62/SF
NOI
$39.7K $11.04/SF
Area
Grand Rapids, MI
Vacancy
8.00%
Lease Rate
$19.20 /SF/Yr
Expense Ratio
37.50%
Simulate Cap Rate and NOI
Suggested Prices Based on Cap Rates
Cap Rate 5%
$794,880
Cap Rate 7%
$567,771
Cap Rate 9%
$441,600
Alternative Uses
Best Use
Retail
$745.5K
$652.3K – $869.8K
NOI $52,185 @ 7.0% cap · market cap 10.99%
Second Best
Mixed Use
$567.8K
$496.8K – $662.4K
NOI $39,744 @ 7.0% cap · market cap 8.37%
Theoretical Best
Specialty Retail
$835.5K
$731.0K – $974.7K
NOI $58,482 @ 7.0% cap · market cap 12.31%
Zoning and permitted uses should be independently verified with authorities.
Property Analytics
Unlock full access to Insights
Subscribe to Realmo Intelligence
Open Analytics
Current Use
Location Intelligence
Trade Area within ½ mile
1,250
Businesses Nearby
9k
Monthly Visits Nearby
Explore this area
Business Placement
Foot Traffic Nearby
Shops & Services 85%
Dining 15%
Family Dollar
Shops & Services
4,275 visits/mo
0.2 miles
Huntington Bank
Shops & Services
3,011 visits/mo
0.2 miles
Domino's Pizza
Dining
1,292 visits/mo
0.5 miles
Demographics for 49506, MI
33,050
Population
13,262
Households
2.5
Avg Household Size
34
Median Age
67%
College-Educated
97%
High-School Grad
7.3 sq mi
ZIP Area
4,527
Density / Sq Mi
$112,287
Median Household Income
$48,631
Median Earnings
$1,305
Median Rent
$338,600
Median Home Value
Check the figures for this property
Cap Rate, Value Estimation, Potential NOI and more
View Realmo Analytics

Questions? Ask Rey
Realmo’s AI knows this listing — price, zoning, demand, history. Ask anything.







Frequently Asked Questions
What type of property is this?
Mixed-use property - Approved plans combine residential units with flexible main-floor commercial space and two restrooms.
Where is this mixed-use property located?
The property is located at 1007 Wealthy Street SE Grand Rapids, MI.
What is the asking price?
The asking price for this property is $475,000.
What are key features of this property?
This property features: 1884‑built mixed‑use building totaling 3,600 SF; Approved layout includes four one‑bedroom apartments with in‑unit laundry; Approximately 1,800 SF of main‑floor white‑box commercial space



