Freestanding Retail Property For
For Sale
Contact for pricing
Pending
100 Bass Dr, Santee, SC
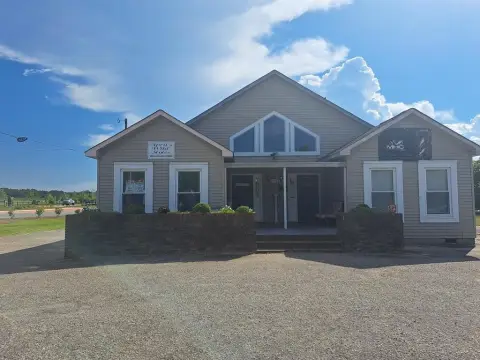
Freestanding retail property with investment-grade tenant Dollar Tree.
Property Size9,993 SF
Lot Size1.69 Acres
Days on Market440
Property Features for 100 Bass Dr
General Information
Standard status
Pending
Size
9,993 SF
Lot size
1.69 Acres
Property subtype
RETAIL
Listing Agency:
Furman Capital Advisors
(864) 235-6855
Listed By:
Robert Schmidt · License #81850
(864) 678-5995
Source:
Moodyscre
Added: Aug 6, 2025
Changed: Oct 13
Last Checked: Oct 16 at 12:00PM
Displayed information is deemed reliable but is not guaranteed and should be independently verified. All listing content including descriptions, pricing, images are the copyrighted material of Furman Capital Advisors

Ask AI about this property
Review the available facts, identify missing information and prepare questions for the agent.
Investment Insights
Based on property information with market context.
This retail property features a NN+ lease structure, offering a passive investment with minimal landlord responsibilities. The lease is guaranteed by Dollar Tree Stores, Inc., which holds an S&P investment-grade credit rating of BBB. Dollar Tree operates over 9,000 locations across 48 U.S. states and 5 Canadian provinces, with 2024 net sales exceeding $17 billion. Approximately 6.75 years remain on the initial lease term, with an additional 20 years available through option periods, providing long-term investment security. The property is strategically located just approximately 0.6 miles from I-95, offering market exposure and convenient access. The property has a size of 9,993 square feet.
Key Highlights
- Investment Grade Tenant: Lease guaranteed by Dollar Tree Stores, Inc. (S&P: BBB)
- Strong Lease Term: Approximately 6.75 years remaining on initial term, with options for an additional 20 years
- Minimal Landlord Responsibilities: NN+ lease structure offers a highly passive investment
Financial Insights
Estimated NOI and Cap Rate
NOI / Yr
$59,095
Cap Rate
4.24%
Suggested Prices Based on Cap Rates
Cap Rate 5%
$1,181,900
$1.2M
Cap Rate 7%
$844,214
$844.2K
Cap Rate 9%
$656,611
$656.6K
Market Conditions
NOI Build-Up for 9,993 SF
Gross rent
$95.9K $9.60/SF
− Vacancy
−$11.5K −$1.15/SF
EGI
$84.4K $8.45/SF
− OpEx
−$25.3K −$2.53/SF
NOI
$59.1K $5.91/SF
Area
Orangeburg County, SC
Vacancy
12.00%
Lease Rate
$9.60 /SF/Yr
Expense Ratio
30.00%
Simulate Cap Rate and NOI
Suggested Prices Based on Cap Rates
Cap Rate 5%
$1,181,900
Cap Rate 7%
$844,214
Cap Rate 9%
$656,611
Alternative Uses
Best Use
Retail
$844.2K
$738.7K – $984.9K
NOI $59,095 @ 7.0% cap · market cap 4.24%
Second Best
—
—
no second resolved use
Theoretical Best
Specialty Retail
$1.45M
$1.27M – $1.69M
NOI $101,341 @ 7.0% cap · market cap 7.27%
Zoning and permitted uses should be independently verified with authorities.
How Realmo checks its estimates
Property Analytics
Unlock full access to Insights
Subscribe to Realmo Intelligence
Open Analytics
Current Use
Location Intelligence
Trade Area within ½ mile
126
Businesses Nearby
Well-served
Demand for This Use
Explore this area
Business Placement
Check the figures for this property
Cap Rate, Value Estimation, Potential NOI and more
View Realmo Analytics
Market
Vacancy Rate% for Retail in South region

Frequently Asked Questions
What type of property is this?
Storefront property - Freestanding retail property with investment-grade tenant Dollar Tree.
Where is this storefront property located?
The property is located at 100 Bass Dr Santee, SC.
What is the asking price?
The asking price for this property is $1,394,000.
What are key features of this property?
This property features: Investment Grade Tenant: Lease guaranteed by Dollar Tree Stores, Inc. (S&P: BBB); Strong Lease Term: Approximately 6.75 years remaining on initial term, with options for an additional 20 years; Minimal Landlord Responsibilities: NN+ lease structure offers a highly passive investment


