Mixed-Use Property with
For Sale
$1,699,000
10 Erie St, Mount Morris, NY 14510
A diversified property combines residential, childcare, mobile-home, and self-storage uses with public utilities.
Property Size8,480 SF
Lot Size5.08 Acres
Days on Market47
Property Features for 10 Erie St
General Information
Standard status
Active
Size
8,480 SF
Lot size
5.08 Acres
Property subtype
Commercial
Additional Details
Utilities to Site
Yes
Self-Storage Units
30
Taxes and HOA fees
Annual Taxes
$29,270
Building Details
Building Size
8,480 SF
Year Built
1991
Stories
2
Listing Agency:
Empire Realty Group
Listed By:
Nicholas Kneut
(585) 469-9229
Source:
Elliman
Added: Sep 4
Changed: Oct 10
Last Checked: Oct 19 at 7:43AM
Displayed information is deemed reliable but is not guaranteed and should be independently verified. All listing content including descriptions, pricing, images are the copyrighted material of Empire Realty Group

Ask AI about this property
Review the available facts, identify missing information and prepare questions for the agent.
Investment Insights
Based on property information with market context.
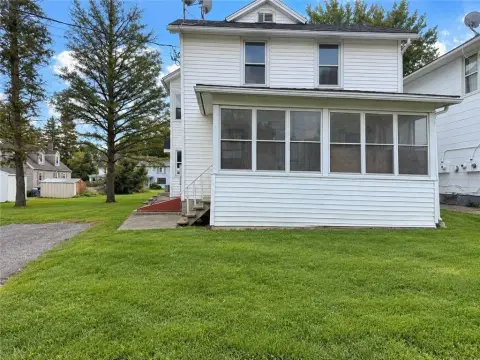
Set on 5.08 acres at 10 Erie St, this mixed-use property brings together 21 occupied mobile-home pads, two self-storage buildings with 30 units, and a commercial/residential building. The main building contains a daycare on the first floor and two apartments above, while a separate residence provides three bedrooms and 1.5 baths. The improvements date to 1991 and have been maintained with limited deferred maintenance.
Public water and sewer serve the property, with individual water meters at the mobile-home sites. Three storage units are vacant. A potential 22nd mobile-home pad is currently used as a daycare playground and retains water and electric service, subject to applicable requirements. The first-floor commercial area also includes existing plumbing, drainage, and electrical infrastructure from its former laundromat configuration.
Public water and sewer serve the property, with individual water meters at the mobile-home sites. Three storage units are vacant. A potential 22nd mobile-home pad is currently used as a daycare playground and retains water and electric service, subject to applicable requirements. The first-floor commercial area also includes existing plumbing, drainage, and electrical infrastructure from its former laundromat configuration.
Key Highlights
- 5.08‑acre mixed‑use property at 10 Erie St, Mount Morris, NY 14510
- 21 occupied mobile‑home pads with individual water metering
- Two self‑storage buildings totaling 30 units; three units are vacant
Financial Insights
Estimated NOI and Cap Rate
NOI / Yr
$105,023
Cap Rate
6.18%
Suggested Prices Based on Cap Rates
Cap Rate 5%
$2,100,460
$2.1M
Cap Rate 7%
$1,500,329
$1.5M
Cap Rate 9%
$1,166,922
$1.2M
Market Conditions
NOI Build-Up for 8,480 SF
Gross rent
$132.3K $15.60/SF
− Vacancy
−$8.7K −$1.03/SF
EGI
$123.6K $14.57/SF
− OpEx
−$18.5K −$2.19/SF
NOI
$105.0K $12.38/SF
Area
Livingston County, NY
Vacancy
6.60%
Lease Rate
$15.60 /SF/Yr
Expense Ratio
15.00%
Simulate Cap Rate and NOI
Suggested Prices Based on Cap Rates
Cap Rate 5%
$2,100,460
Cap Rate 7%
$1,500,329
Cap Rate 9%
$1,166,922
Alternative Uses
Best Use
Warehouse
$1.50M
$1.31M – $1.75M
NOI $105,023 @ 7.0% cap · market cap 6.18%
Second Best
Mixed Use
$1.47M
$1.29M – $1.72M
NOI $103,032 @ 7.0% cap · market cap 6.06%
Theoretical Best
Office A
$2.32M
$2.03M – $2.71M
NOI $162,612 @ 7.0% cap · market cap 9.57%
Zoning and permitted uses should be independently verified with authorities.
How Realmo checks its estimates
Property Analytics
Current Use
Lease Details
Yes
Utilities to site
Location Intelligence
Trade Area within ½ mile
259
Businesses Nearby
Explore this area
Business Placement
Demographics for 14510, NY
4,902
Population
2,190
Households
2.2
Avg Household Size
44
Median Age
22%
College-Educated
93%
High-School Grad
75.2 sq mi
ZIP Area
65
Density / Sq Mi
$61,099
Median Household Income
$42,205
Median Earnings
$806
Median Rent
$97,800
Median Home Value
Market
Vacancy Rate% for Industrial in Northeast region


Frequently Asked Questions
What type of property is this?
Mixed-use property - A diversified property combines residential, childcare, mobile-home, and self-storage uses with public utilities.
Where is this mixed-use property located?
The property is located at 10 Erie St Mount Morris, NY.
What is the asking price?
The asking price for this property is $1,699,000.
What are key features of this property?
This property features: 5.08‑acre mixed‑use property at 10 Erie St, Mount Morris, NY 14510; 21 occupied mobile‑home pads with individual water metering; Two self‑storage buildings totaling 30 units; three units are vacant


