Three-Story Mixed-Use
For Sale
Contact for pricing
1 N Harrison St, East Orange, NJ 07017
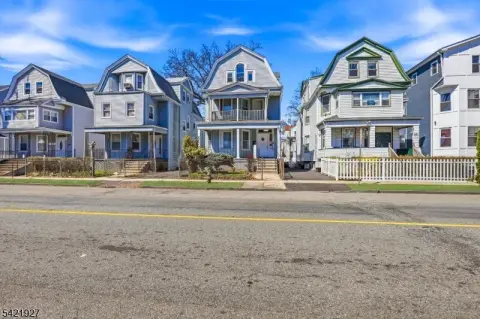
Corner property with residential and commercial space near transit, retail, education, and medical facilities.
Property Size4,945 SF
Lot Size0.11 Acres
Price / SF$262.89
Days on Market220

Ask AI about this property
Review the available facts, identify missing information and prepare questions for the agent.
Property Features for 1 N Harrison St
General Information
Standard status
Active
Size
4,945 SF
Lot size
0.11 Acres
Property subtype
Retail, Multifamily, Mixed Use
Occupancy
100%
Investment Type
Value Add
Net Operating Income
$107,535
Site & Location
Corner Location
Yes
Highway Access
Yes
Road Access
Yes
Public Transit
Yes
Units
Unit Mix
1 x 3BR/1BA
Multifamily Units
1
Building Details
Year Built
1927
Buildings
1
Stories
3
Units
5
Tenancy
Multi
Listing Agency:
Horvath & Tremblay
Listed By:
Michael Lombardi · License #0569706
(201) 215-1801
Source:
Crexi
Added: Mar 10
Changed: Oct 15
Last Checked: Oct 14 at 9:09PM
Displayed information is deemed reliable but is not guaranteed and should be independently verified. All listing content including descriptions, pricing, images are the copyrighted material of Horvath & Tremblay
Investment Insights
Based on property information with market context.
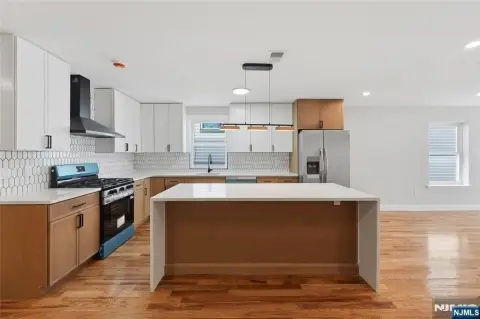
This three-story mixed-use building contains 4,945 square feet and five total units, including one three-bedroom, one-bath residential unit and four commercial units. Constructed in 1927, the property occupies a 0.11-acre corner parcel in East Orange, New Jersey.
The building is positioned near Brick Church Train Station, with direct service to Manhattan’s Penn Station, and along a municipal bus line. The surrounding area includes The Crossing at Brick Church Station, a mixed-use development with 820 residential units and 196,000 square feet of retail space, including Shop Rite. Seton Hall University and East Orange VA Medical Center are also nearby. Access to Interstate 280, the Garden State Parkway, and NJ Route 21 connects the property with the broader region, while Newark’s Central Business District is 3.5 miles away.
The building is positioned near Brick Church Train Station, with direct service to Manhattan’s Penn Station, and along a municipal bus line. The surrounding area includes The Crossing at Brick Church Station, a mixed-use development with 820 residential units and 196,000 square feet of retail space, including Shop Rite. Seton Hall University and East Orange VA Medical Center are also nearby. Access to Interstate 280, the Garden State Parkway, and NJ Route 21 connects the property with the broader region, while Newark’s Central Business District is 3.5 miles away.
Key Highlights
- 4,945‑square‑foot three‑story mixed‑use building
- Five total units: one 3‑Bedroom/1‑Bath residential unit and four commercial units
- 0.11‑acre corner parcel in East Orange, New Jersey
Financial Insights
Estimated NOI and Cap Rate
NOI / Yr
$70,581
Cap Rate
5.43%
Suggested Prices Based on Cap Rates
Cap Rate 5%
$1,411,620
$1.4M
Cap Rate 7%
$1,008,300
$1.0M
Cap Rate 9%
$784,233
$784.2K
Market Conditions
NOI Build-Up for 4,945 SF
Gross rent
$106.8K $21.60/SF
− Vacancy
−$6.0K −$1.21/SF
EGI
$100.8K $20.39/SF
− OpEx
−$30.2K −$6.12/SF
NOI
$70.6K $14.27/SF
Area
Essex County, NJ
Vacancy
5.60%
Lease Rate
$21.60 /SF/Yr
Expense Ratio
30.00%
Simulate Cap Rate and NOI
Suggested Prices Based on Cap Rates
Cap Rate 5%
$1,411,620
Cap Rate 7%
$1,008,300
Cap Rate 9%
$784,233
Alternative Uses
Best Use
Retail
$1.01M
$882.3K – $1.18M
NOI $70,581 @ 7.0% cap · market cap 5.43%
Second Best
Mixed Use
$974.9K
$853.0K – $1.14M
NOI $68,241 @ 7.0% cap · market cap 5.25%
Theoretical Best
Office A
$1.29M
$1.13M – $1.51M
NOI $90,387 @ 7.0% cap · market cap 6.95%
Zoning and permitted uses should be independently verified with authorities.
How Realmo checks its estimates
Property Analytics
Unlock full access to Insights
Subscribe to Realmo Intelligence
Open Analytics
Current Use
Lease Details
1
Residential units
Yes
Highway access
Yes
Paved road access
Location Intelligence
Trade Area within ½ mile
2,687
Businesses Nearby
215k
Monthly Visits Nearby
Explore this area
Business Placement
Foot Traffic Nearby
Shops & Services 53%
Dining 39%
Apparel 4%
Electronics 2%
McDonald's
Dining
44,610 visits/mo
0.3 miles
Wawa
Shops & Services
32,162 visits/mo
0.3 miles
Wendy's
Dining
21,731 visits/mo
0.0 miles
Burger King
Dining
16,673 visits/mo
0.5 miles
BP
Shops & Services
13,899 visits/mo
0.3 miles
Demographics for 07017, NJ
39,054
Population
16,770
Households
2.3
Avg Household Size
37
Median Age
22%
College-Educated
88%
High-School Grad
2.3 sq mi
ZIP Area
16,980
Density / Sq Mi
$61,552
Median Household Income
$39,847
Median Earnings
$1,346
Median Rent
$316,700
Median Home Value
Check the figures for this property
Cap Rate, Value Estimation, Potential NOI and more
View Realmo Analytics
Market
Vacancy Rate% for Retail in Northeast region




Frequently Asked Questions
What type of property is this?
Mixed-use property - Corner property with residential and commercial space near transit, retail, education, and medical facilities.
Where is this mixed-use property located?
The property is located at 1 N Harrison St East Orange, NJ.
What is the asking price?
The asking price for this property is $1,300,000.
What are key features of this property?
This property features: 4,945‑square‑foot three‑story mixed‑use building; Five total units: one 3‑Bedroom/1‑Bath residential unit and four commercial units; 0.11‑acre corner parcel in East Orange, New Jersey


