Duplex with Private
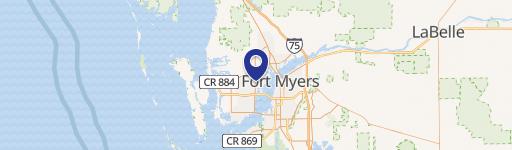
920 SE 6th Court Cape Coral, FL 33990
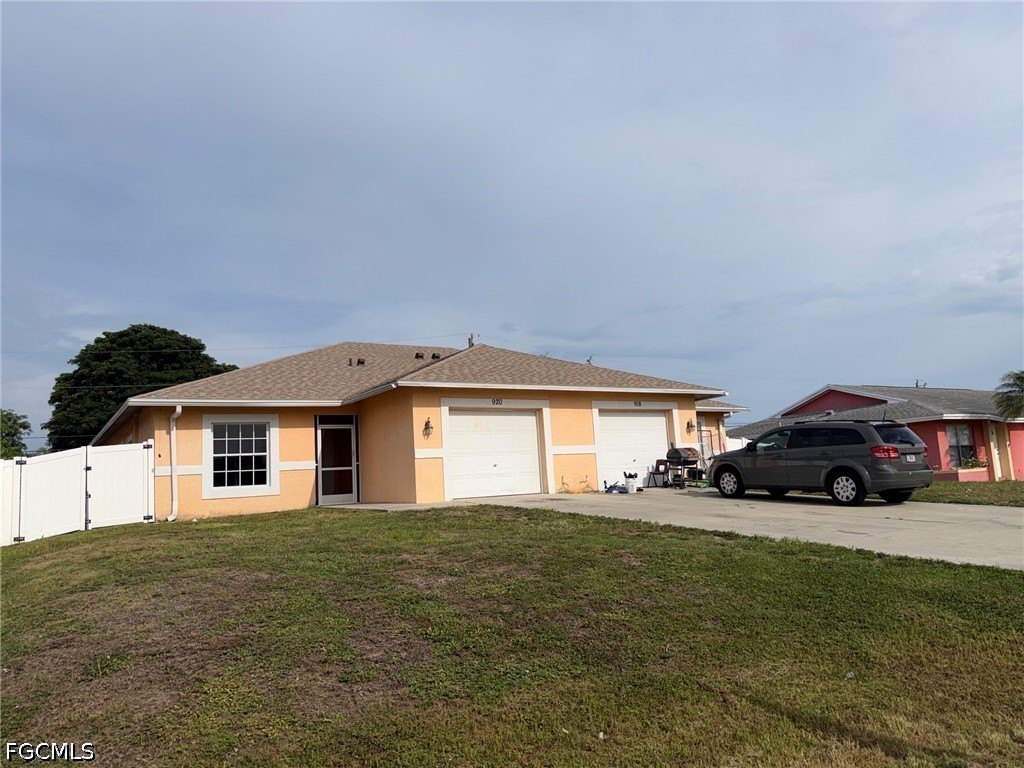
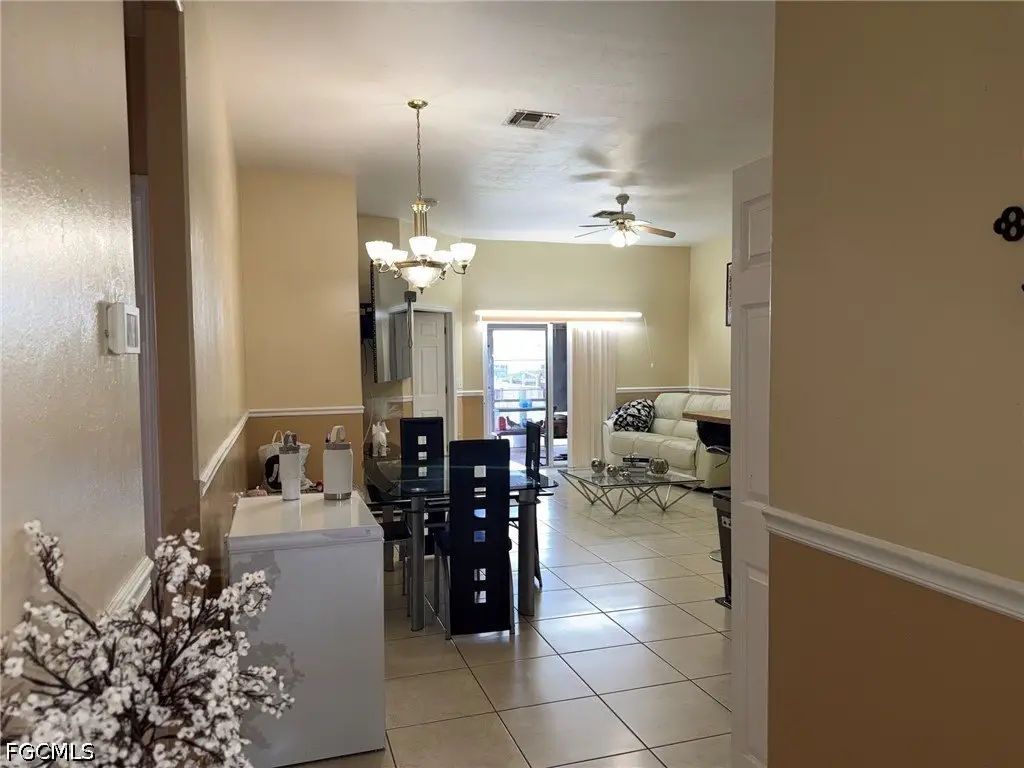
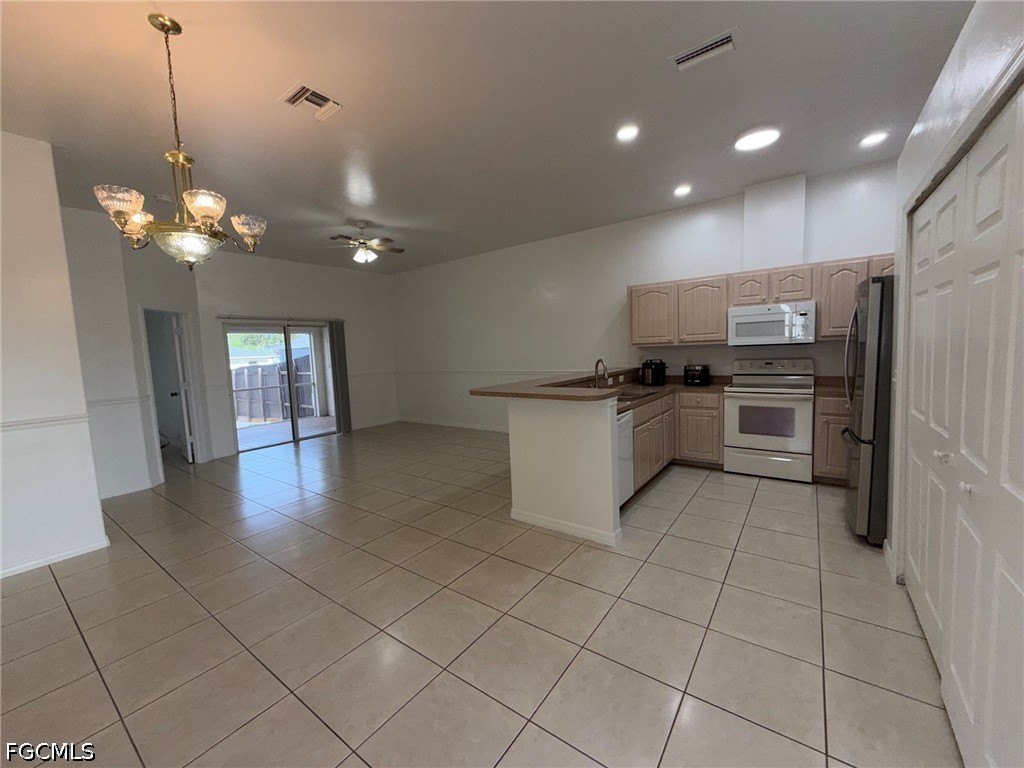
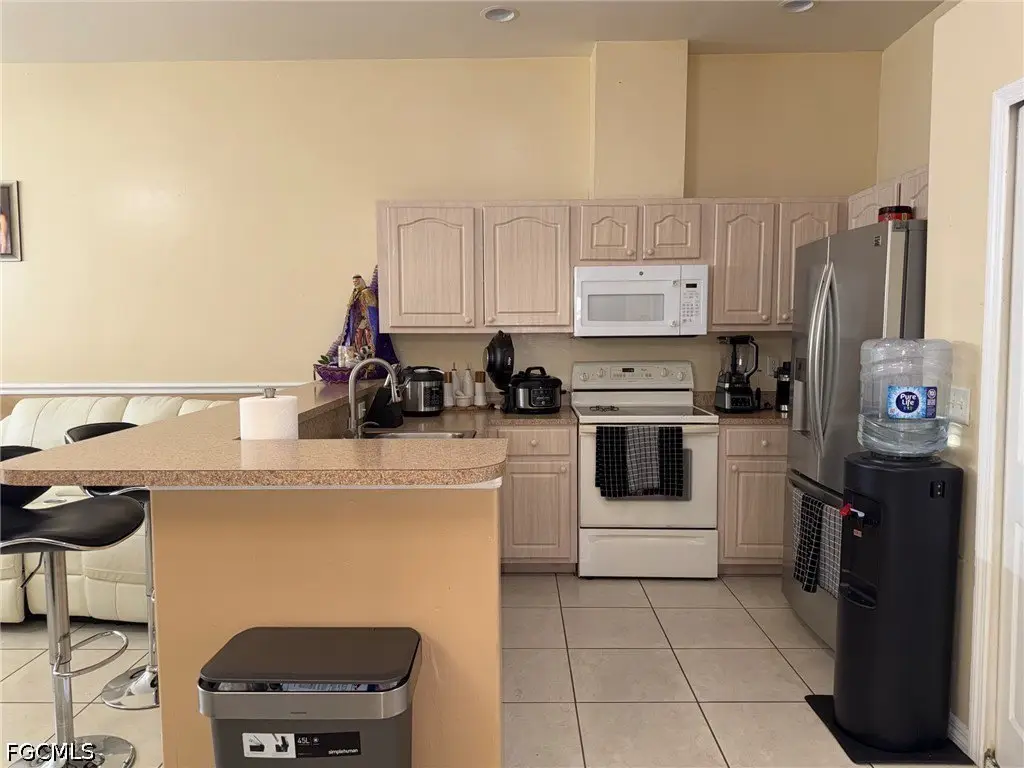
920 SE 6th Court, Cape Coral, FL, 33990
$420,000
For Sale
$420,000
MULTI_FAMILY - Other - Cape Coral, FL
Property Size2,410 SF
Lot Size0.23 Acres
Price / SF$174.27
Days on Market50
Property Features for 920 SE 6th Court
General Information
- Property type
- Residential Multi Family
- Property subtype
- Duplex
- Bedrooms
- 6
- Bathrooms
- 4
- Rooms
- Bathroom 3, Bedroom 6, Bedroom 2, Bathroom 1, Bedroom 5, Bedroom 1, Bathroom 2, Bathroom 4, Bedroom 3, Bedroom 4
- Exterior features
- Fence
- Fencing
- Fenced
- Standard status
- Active
- APN
- 24-44-23-C2-01065.0090
- Lot size
- 0.23 Acres
Taxes and HOA fees
- Tax Year
- 2025
- Tax Description
- CAPE CORAL UNIT 24 BLK 1065 PB 14 PG 77 LOTS 9 + 10
- Tax Annual Amount
- 7920
Utilities
- Heating system
- Central, Electric (Heating)
- Cooling system
- Electric, Ceiling Fan(s), Central Air
Building Details
- Year built
- 2004
- Number of units
- 2
- Flooring type
- Tile
- Building materials
- Block, Concrete, Stucco
- Roof type
- Shingle
- Architectural style
- Other
Listing agency
Century 21 Tri Power Realty
(239) 463-3400
Listed by
Susan Betts · License #258009215
(239) 938-5432
Added: Jun 3 Updated: Jul 18 at 1:42AM Checked: Jul 22 at 8:06PM
MLS# 2026024334
Copyright © 2026 Florida Gulf Coast Multiple Listing Service, Inc. All rights reserved. All information provided by the listing agent/broker is deemed reliable but is not guaranteed and should be independently verified.
Investment Insights
Based on property information with market context.
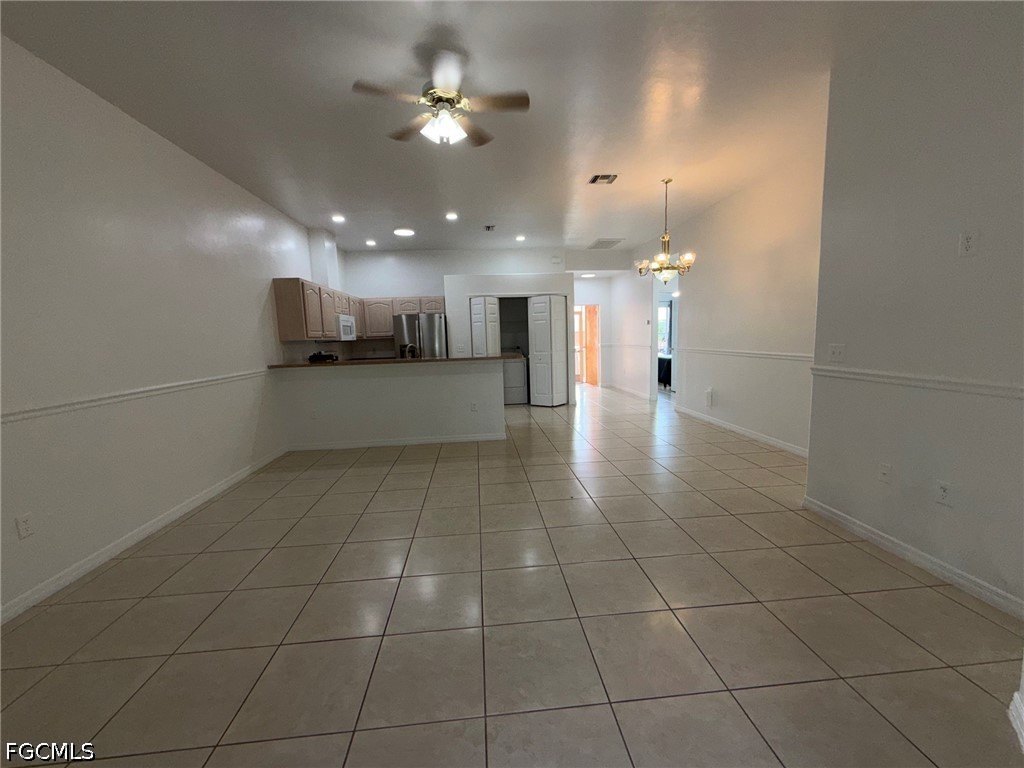
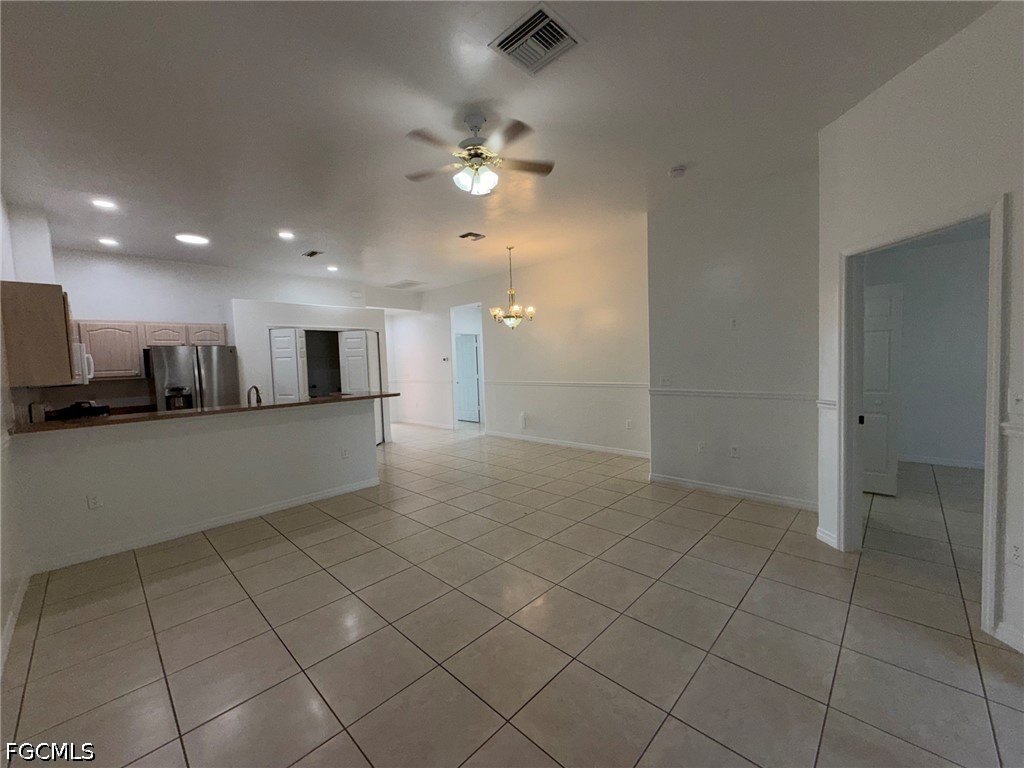
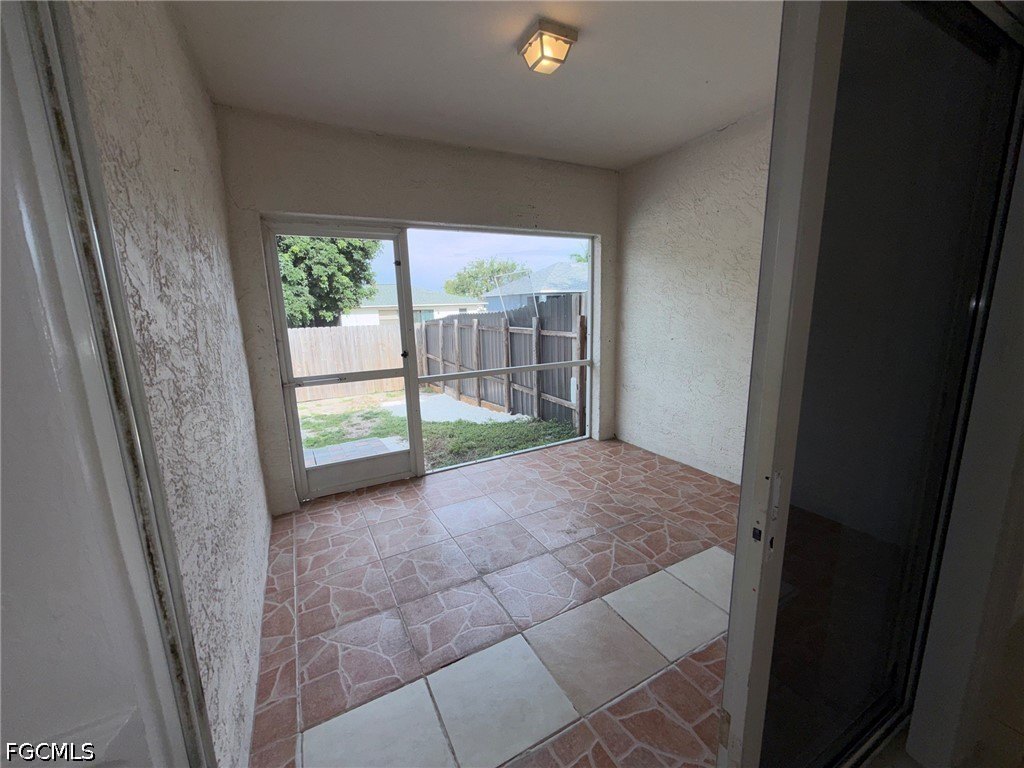
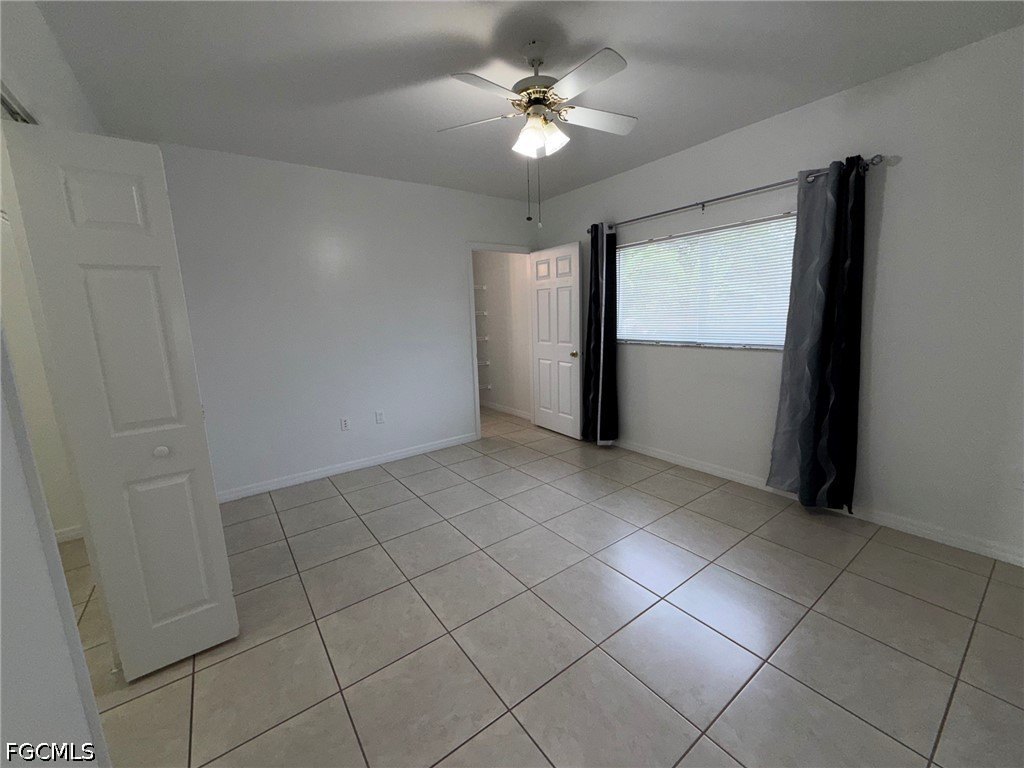
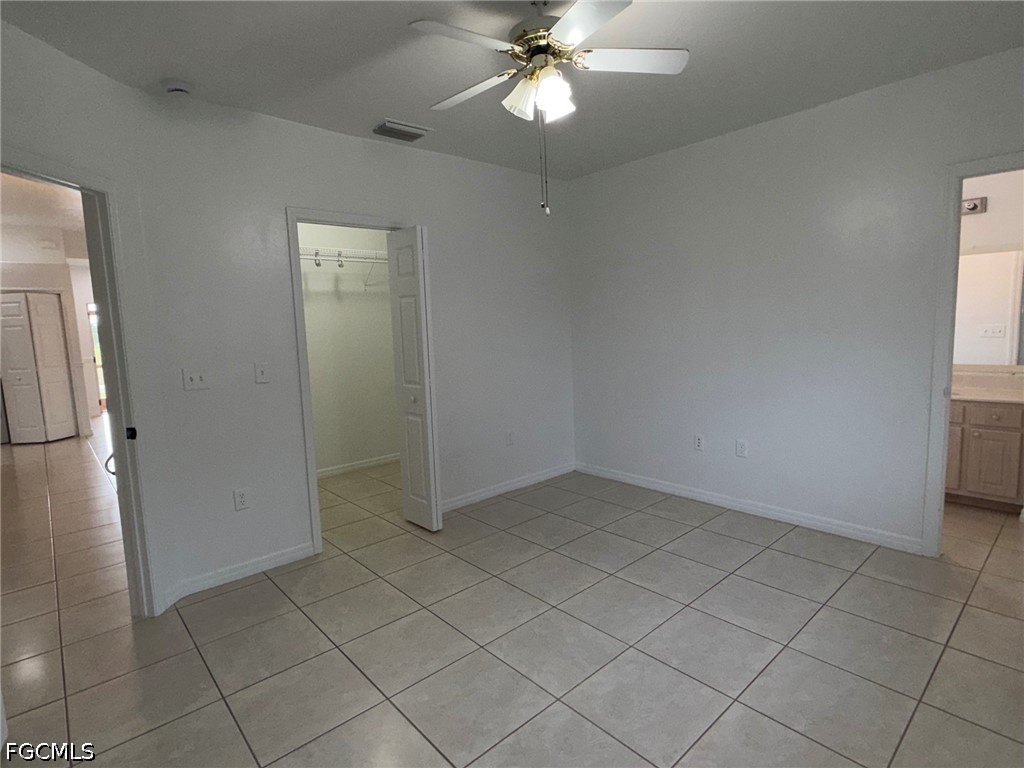
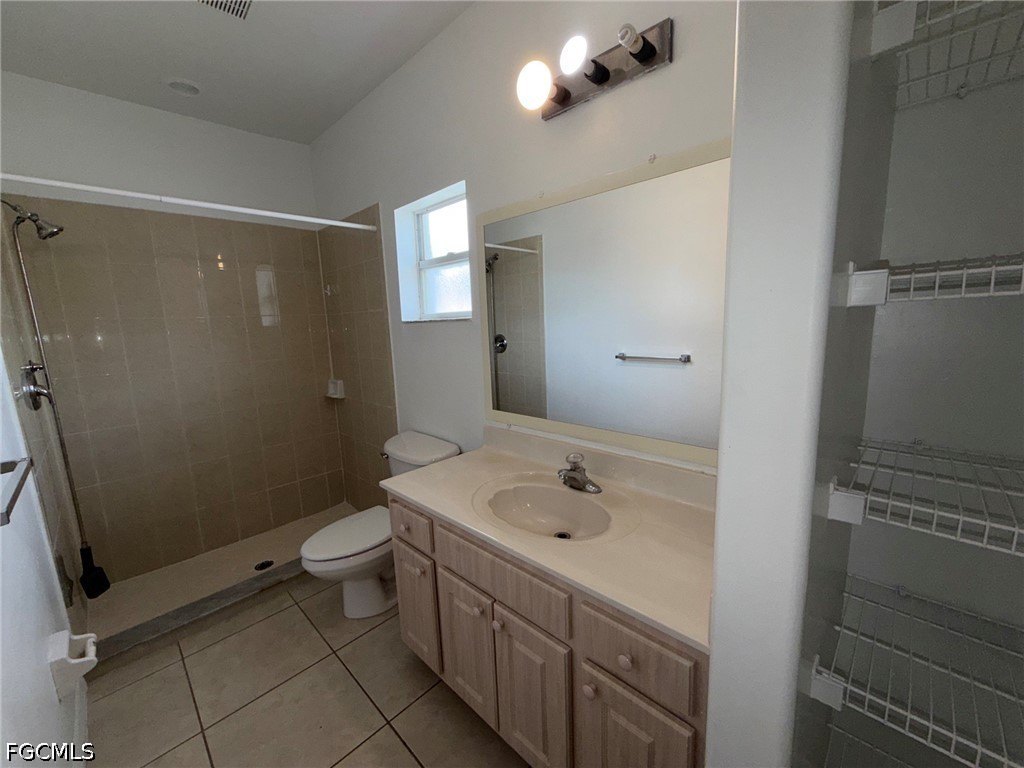
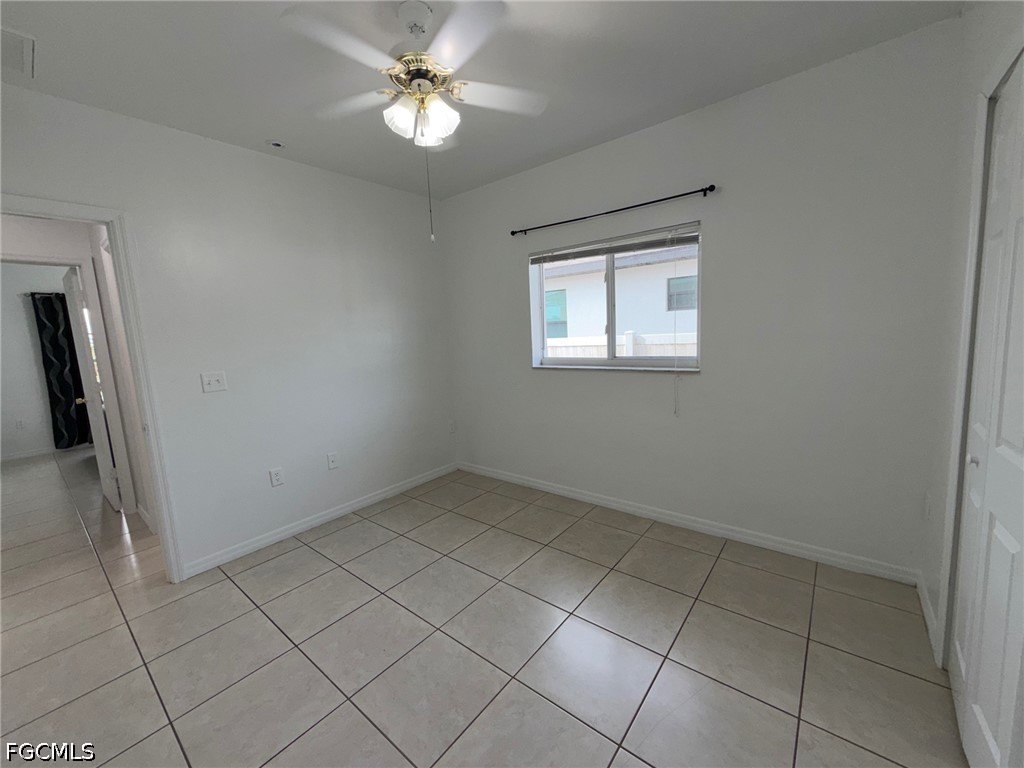
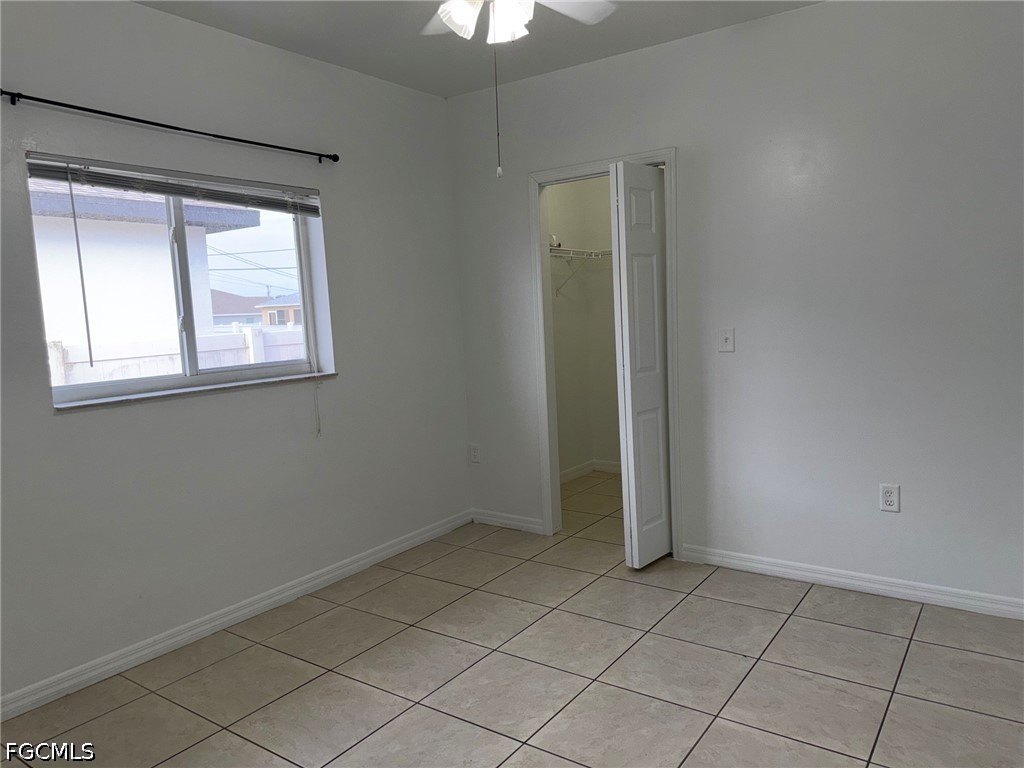
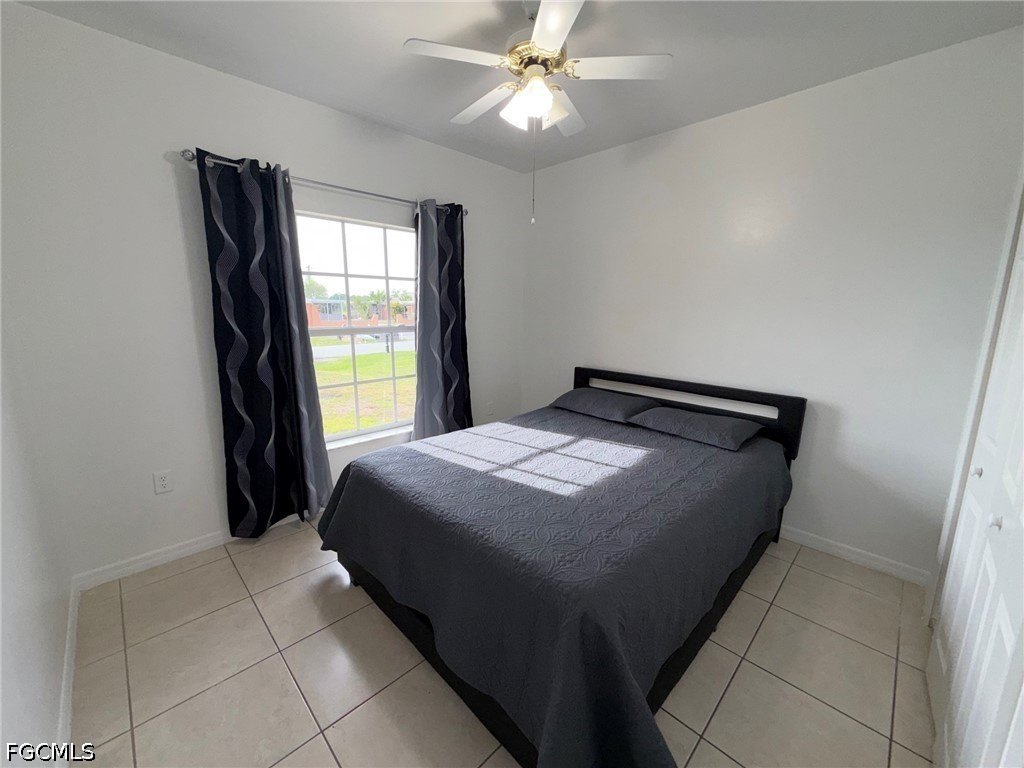
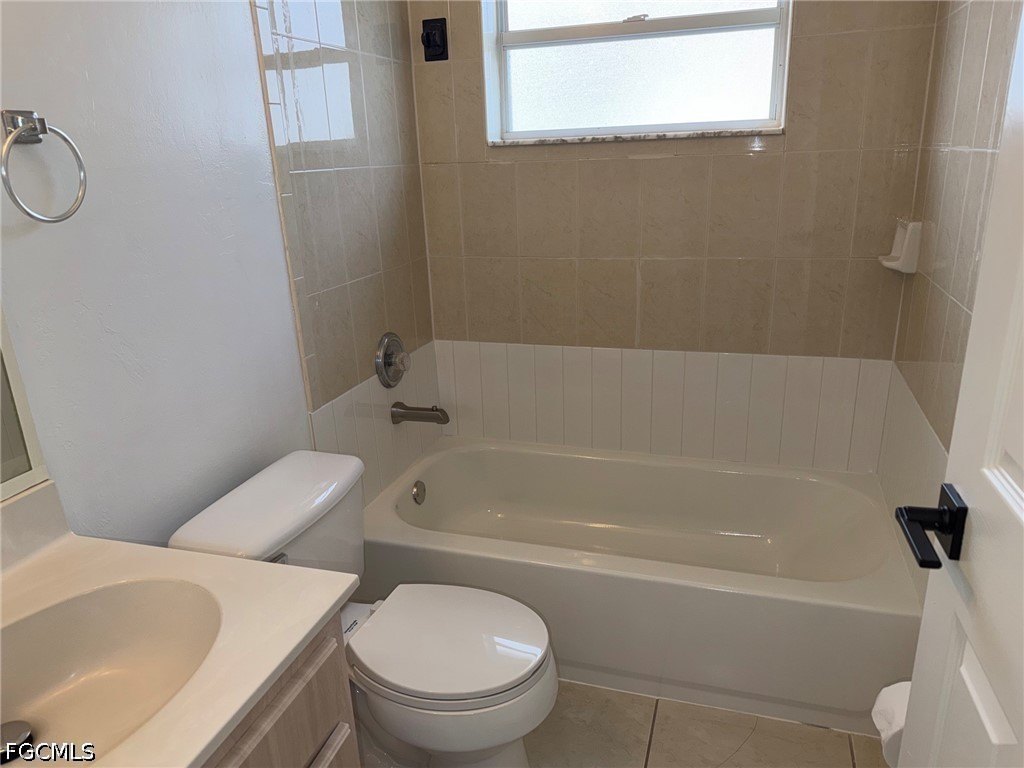
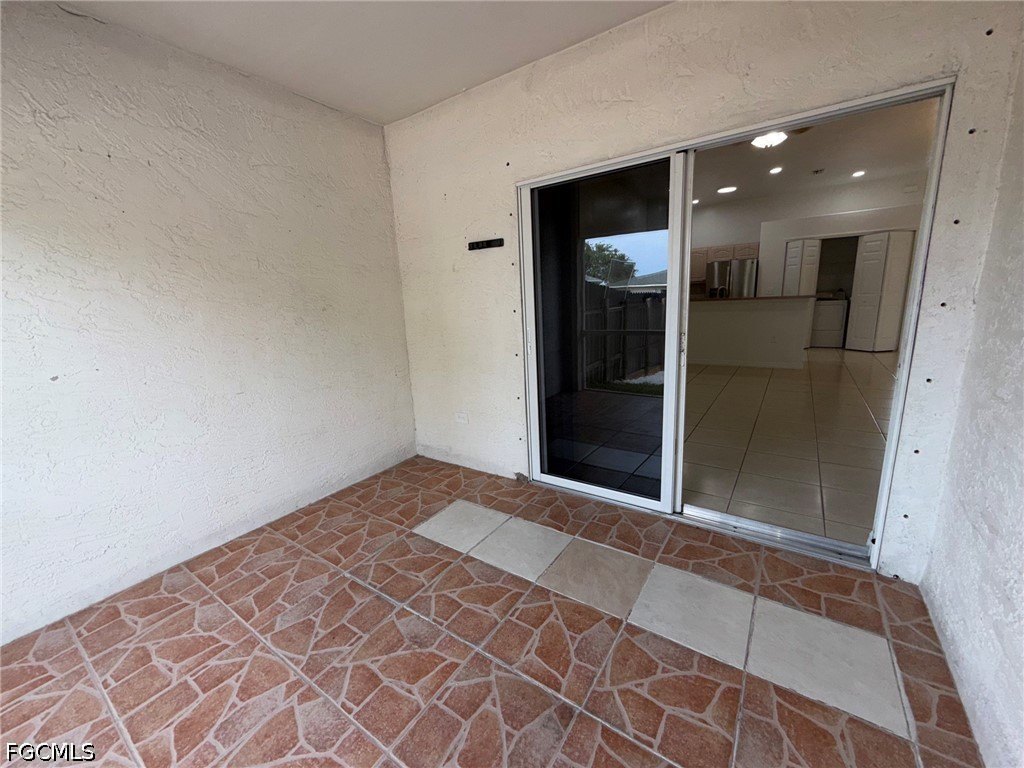
This duplex in southeast Cape Coral is configured as two separate, mirror-image residences. Each side features three bedrooms and two bathrooms with approximately 1,205 square feet per unit, along with in-residence laundry. Bedroom storage includes walk-in closets in the primary suite, and each home opens to a private screened-in lanai. The property also includes a one-car garage per side and a private fenced backyard for each unit.
The roof was reported as replaced on 8-2-2019. The listing notes the property is on high grounds and not in a flood zone, with a statement that it has never flooded. Additional updates include air conditioning units dated 2024 and 2025.
For investors or owner-occupants, this layout supports flexible occupancy, allowing one side to be lived in while the other can be rented. The private yards, garages, and screened lanai areas help maintain unit separation and tenant privacy, while the described interior updating needs on one side offer an opportunity to tailor finishes during transition.
The roof was reported as replaced on 8-2-2019. The listing notes the property is on high grounds and not in a flood zone, with a statement that it has never flooded. Additional updates include air conditioning units dated 2024 and 2025.
For investors or owner-occupants, this layout supports flexible occupancy, allowing one side to be lived in while the other can be rented. The private yards, garages, and screened lanai areas help maintain unit separation and tenant privacy, while the described interior updating needs on one side offer an opportunity to tailor finishes during transition.
Key Highlights
- Duplex in SE Cape Coral with 2 units, each with 3 bedrooms and 2 bathrooms
- Each side offers 1,205 sq ft of living space for a total of 2,410 sq ft
- Private screened‑in lanai for each side, plus fenced back yard (each side)
Local Financial Insights For Multifamily LT 5
Simulate Cap Rate and NOI
NOI Build-Up
- Vacancy
- income lost from leasable area expected to sit empty during the year — subtracted from gross rent.
- EGI (Effective Gross Income)
- gross rent minus vacancy losses — the realistic income before paying operating costs.
- OpEx (Operating Expenses)
- recurring costs to operate the property (property tax, insurance, utilities, maintenance, management) — excludes financing and capital improvements.
- NOI (Net Operating Income)
- income a property generates after operating costs but before financing and taxes.
| Component | $ | $/SF |
|---|---|---|
| Gross rent | $47.7k | $19.80 |
| − Vacancy | −$2.1k | −$0.89 |
| EGI | $45.6k | $18.91 |
| − OpEx | −$13.7k | −$5.67 |
| NOI | $31.9k | $13.24 |
2,410 SF · lease $19.80/SF/yr · vacancy 4.50% · expense 30.00%
Alternative Uses
Best Use
Multifamily LT 5
$455.7K
$398.7K – $531.7K
NOI $31,899 @ 7.0% cap · market cap 7.60%
Second Best
Apartment 5plus
$422.3K
$369.5K – $492.7K
NOI $29,562 @ 7.0% cap · market cap 7.04%
Theoretical Best
Office A
$625.3K
$547.2K – $729.6K
NOI $43,773 @ 7.0% cap · market cap 10.42%
Zoning and permitted uses should be independently verified with local authorities.
Property Analytics
Property Profile
Location Intelligence
Current Use by Public Records
Duplexes
Similar For Sale Nearby





FAQs
What type of property is this?
Duplex - Two mirror-image units each offer three bedrooms, private screened lanai, and in-residence laundry for rental-ready living.
Where is this duplex located?
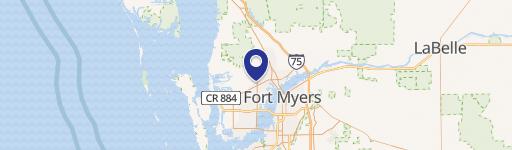
The property is located at 920 SE 6th Court Cape Coral, FL.
What is the asking price?
The asking price for this property is $420,000.
What are key features of this property?
This property features: Duplex in SE Cape Coral with 2 units, each with 3 bedrooms and 2 bathrooms; Each side offers 1,205 sq ft of living space for a total of 2,410 sq ft; Private screened‑in lanai for each side, plus fenced back yard (each side)