Renovated Fifth-Floor Office
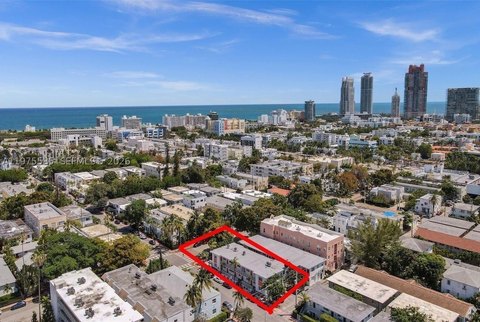
605 Lincoln Rd Miami Beach, FL 33139
For Sale
$5,000,000
SINGLE_FAMILY - Miami Beach, FL
Property Size9,800 SF
Price / SF$510.20
Days on Market33
Property Features for 605 Lincoln Rd
General Information
Property type
Residential
Property subtype
Office
Standard status
Active
APN
02-32-34-168-0260
Taxes and HOA fees
Tax Description
605 LINCOLN ROAD OFFICE CONDO UNIT 500 UNDIV 1.05% INT IN COMMON ELEMENTS OFF REC 23213-0721 COC 23261-4613 04 2005 2
Utilities
Water source
Public
Building Details
Year built
1932
Building materials
Block
Listing Agency:
Compass Florida, LLC
(305) 851-2820
Listed By:
Menachem Fellig · License #3291623
(786) 221-7700
Added: Jun 25
Changed: Jun 30
Last Checked: Jul 27 at 4:06PM
MLS# A11933563
Copyright © 2026 Miami REALTORS®. All rights reserved. All information provided by the listing agent/broker is deemed reliable but is not guaranteed and should be independently verified.
Investment Insights
Based on property information with market context.
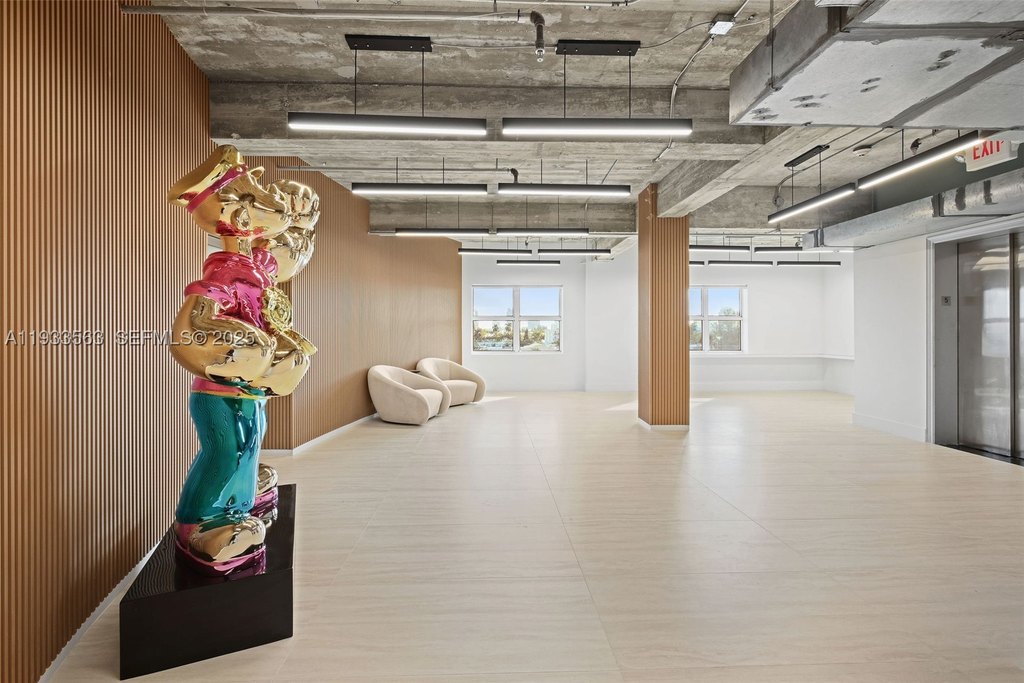
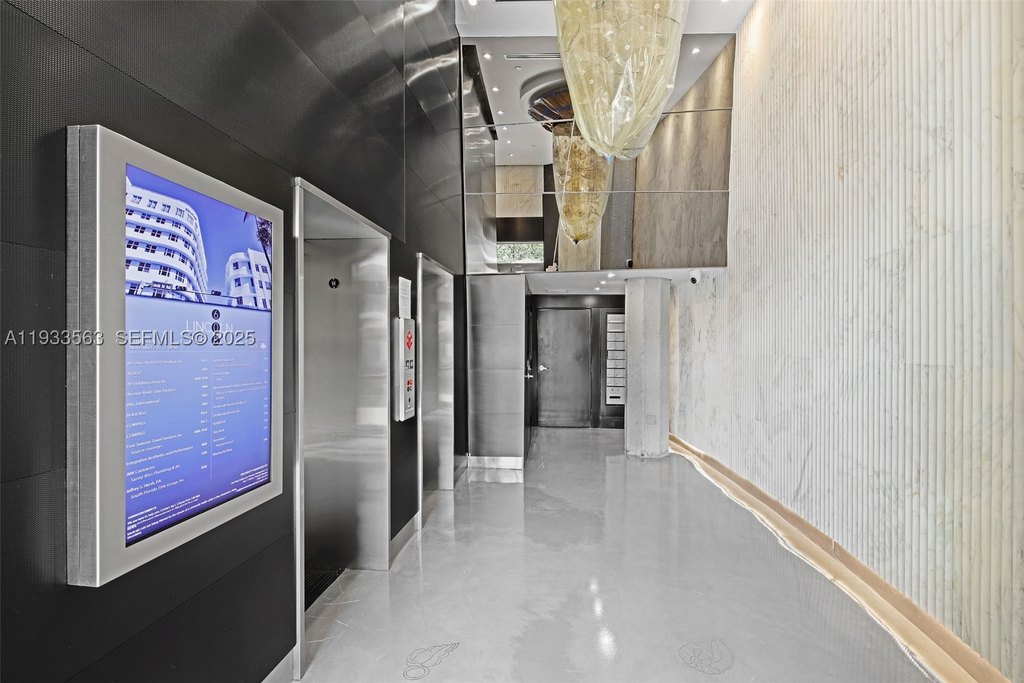
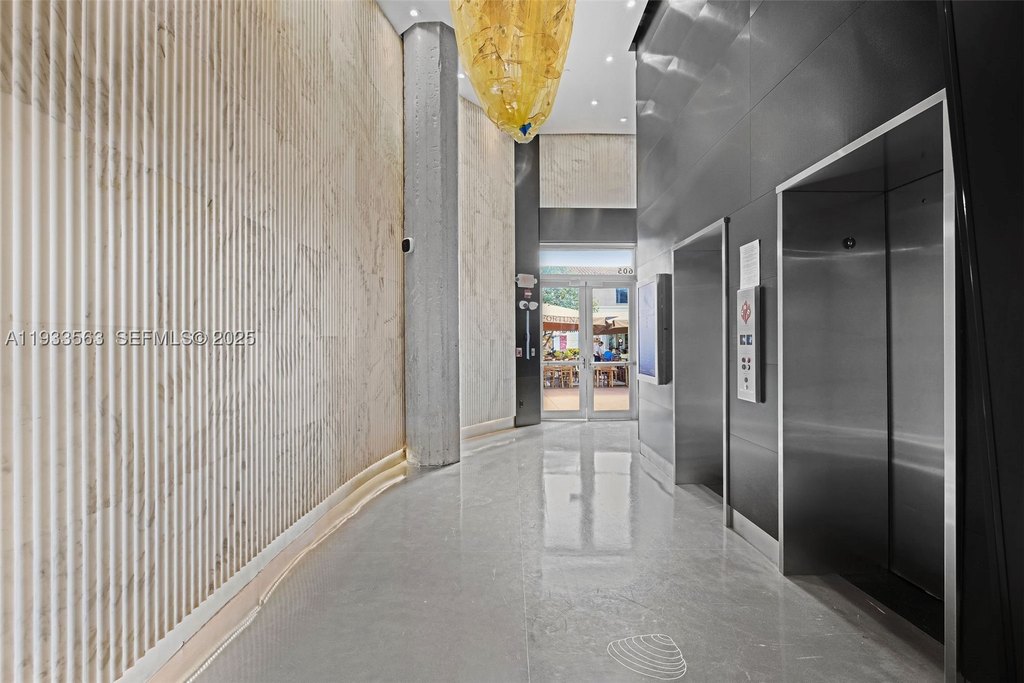
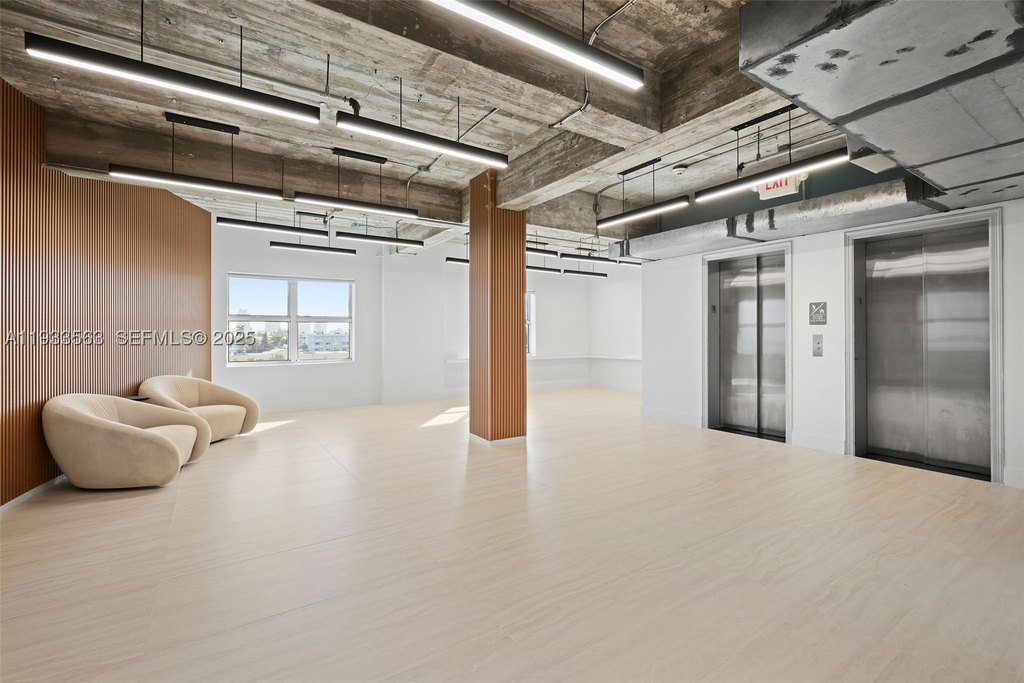
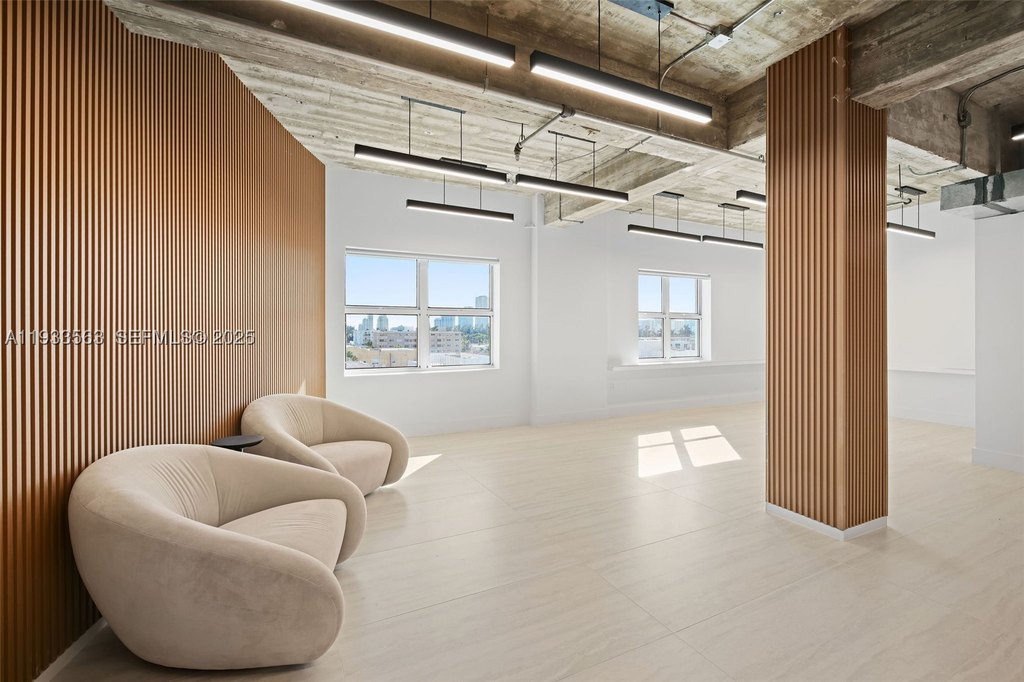
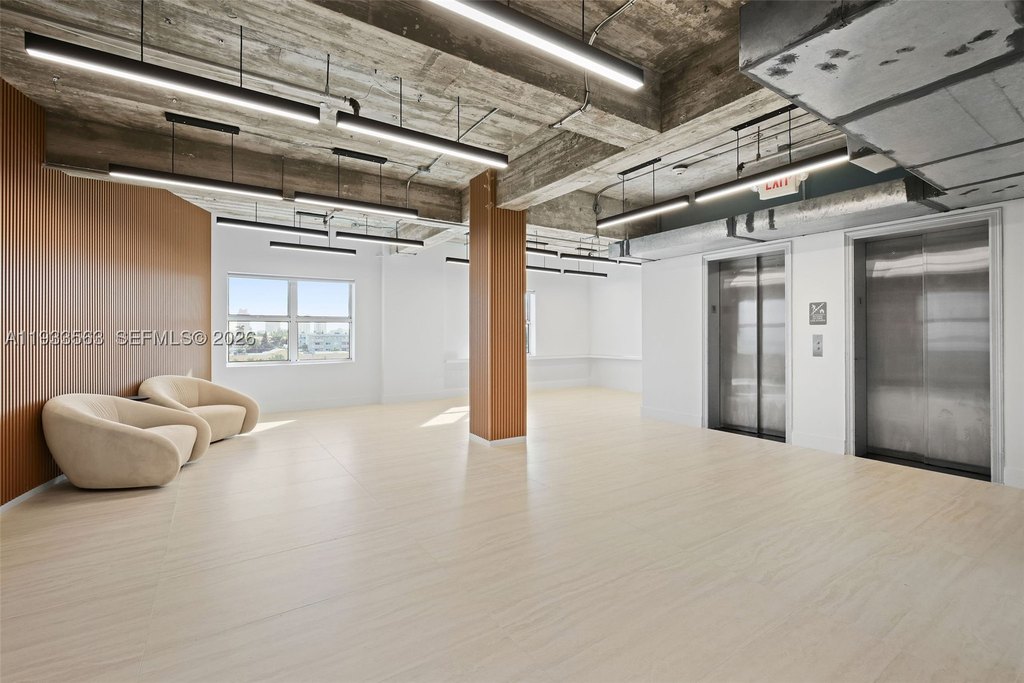
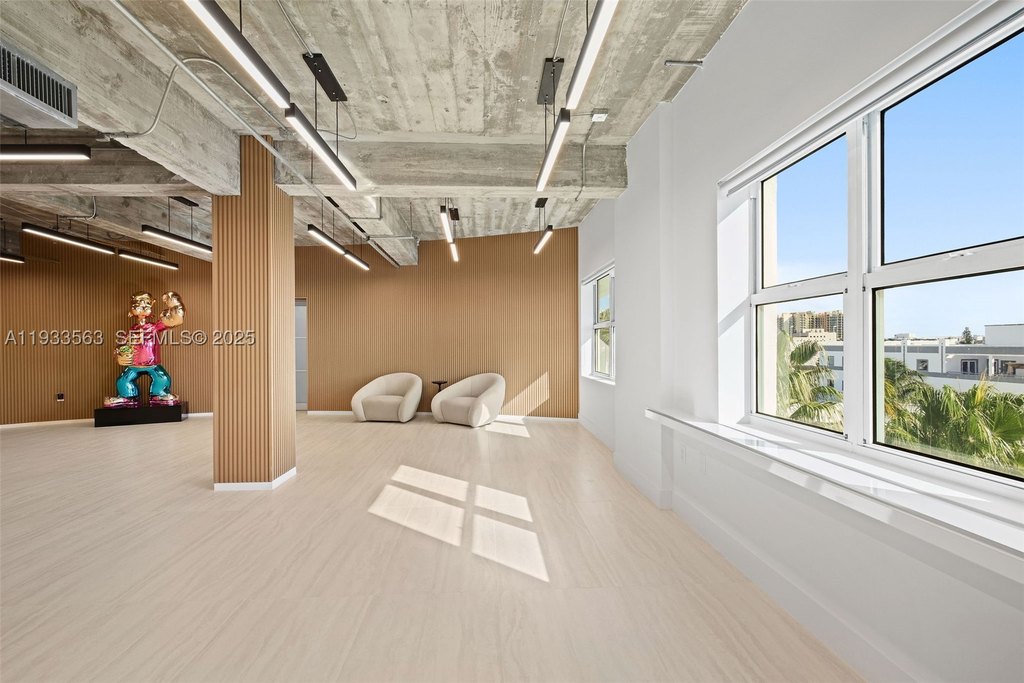
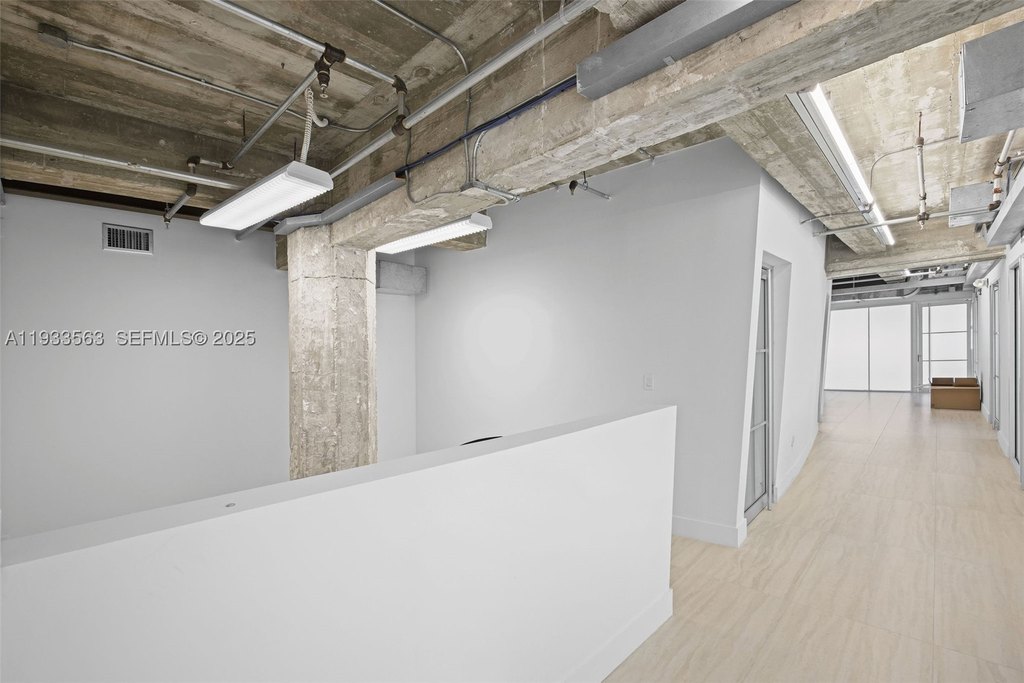
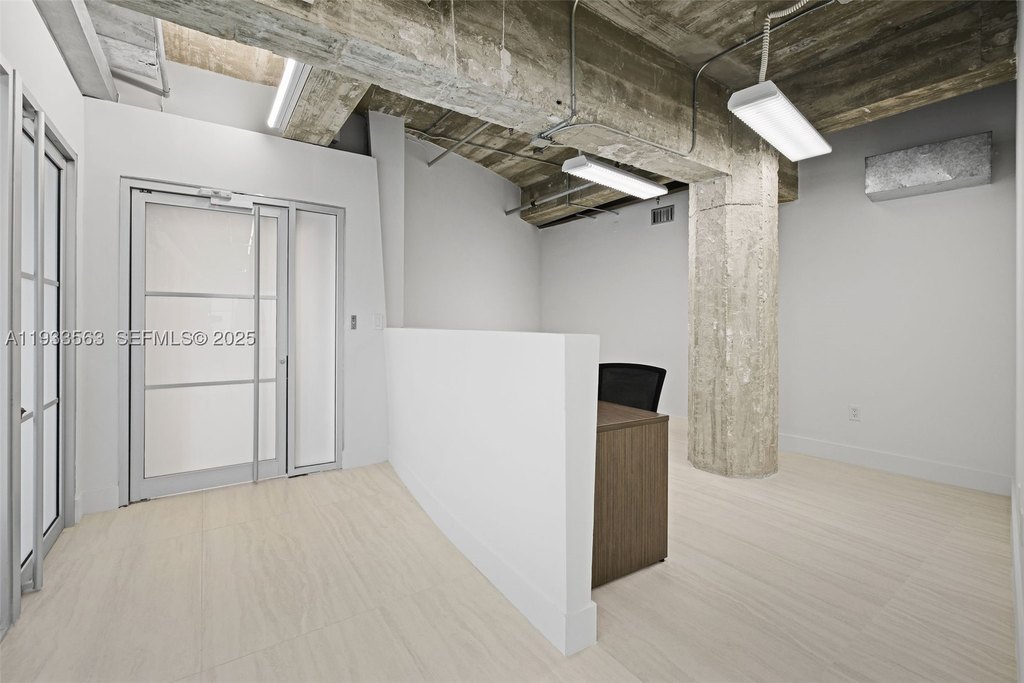
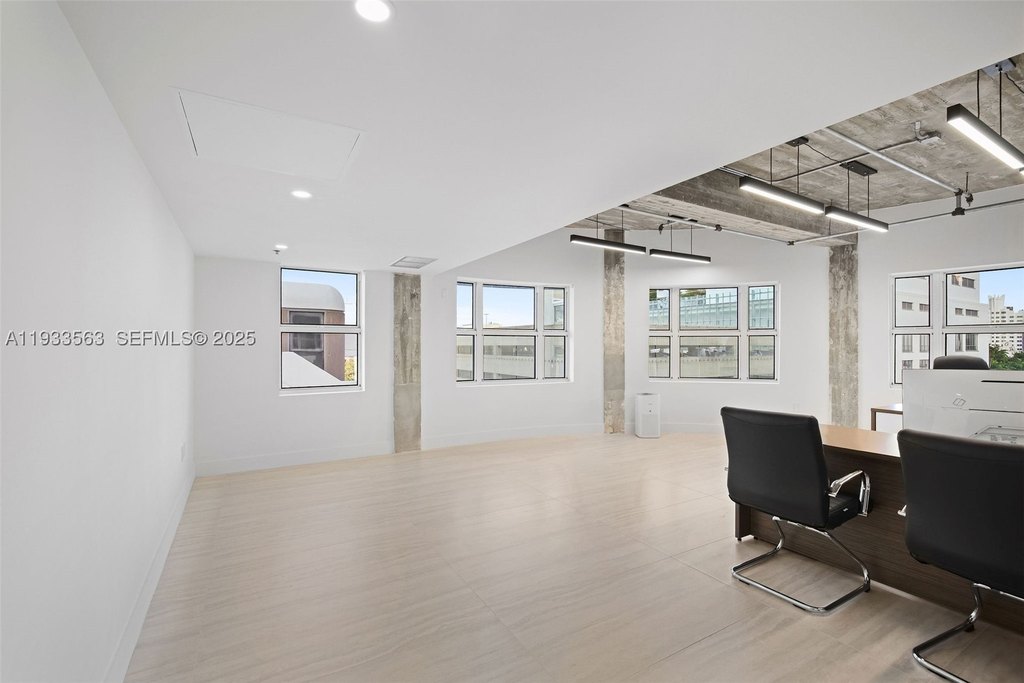
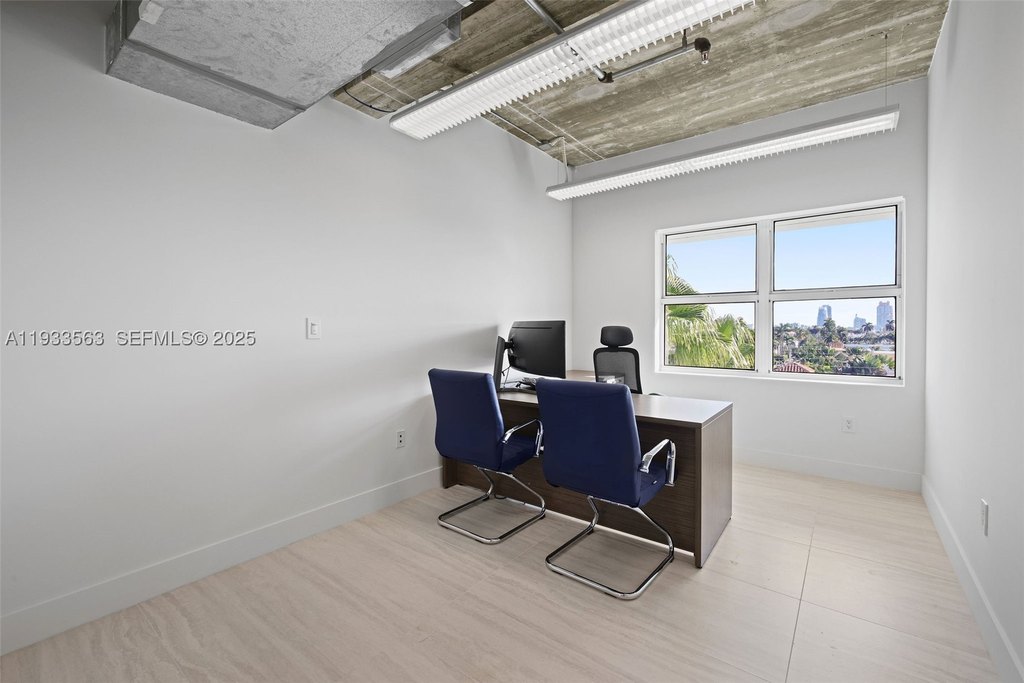
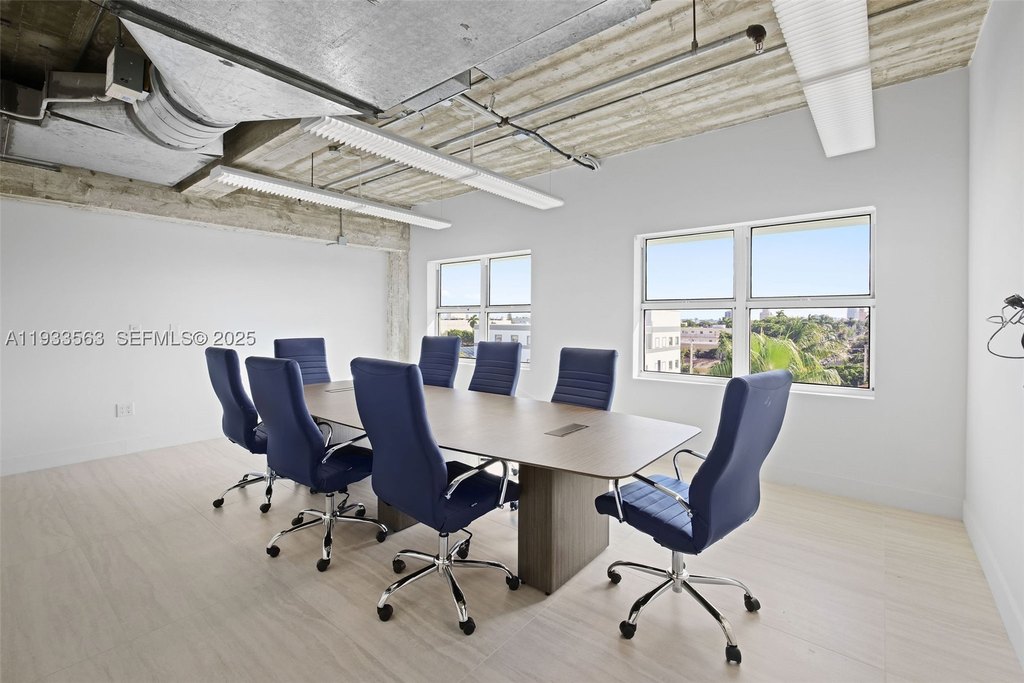
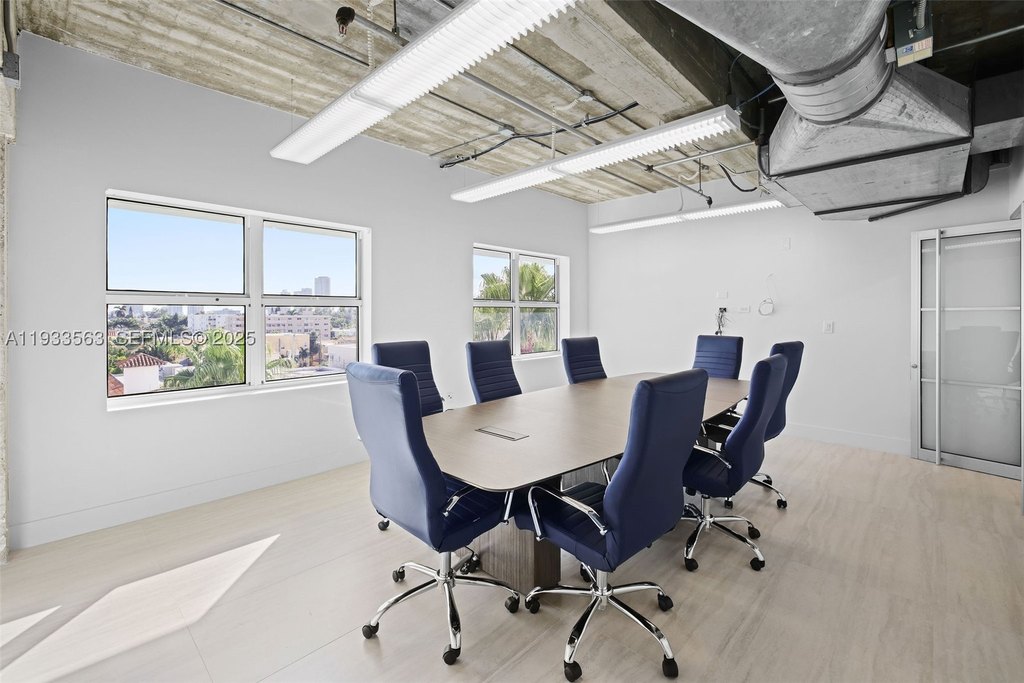
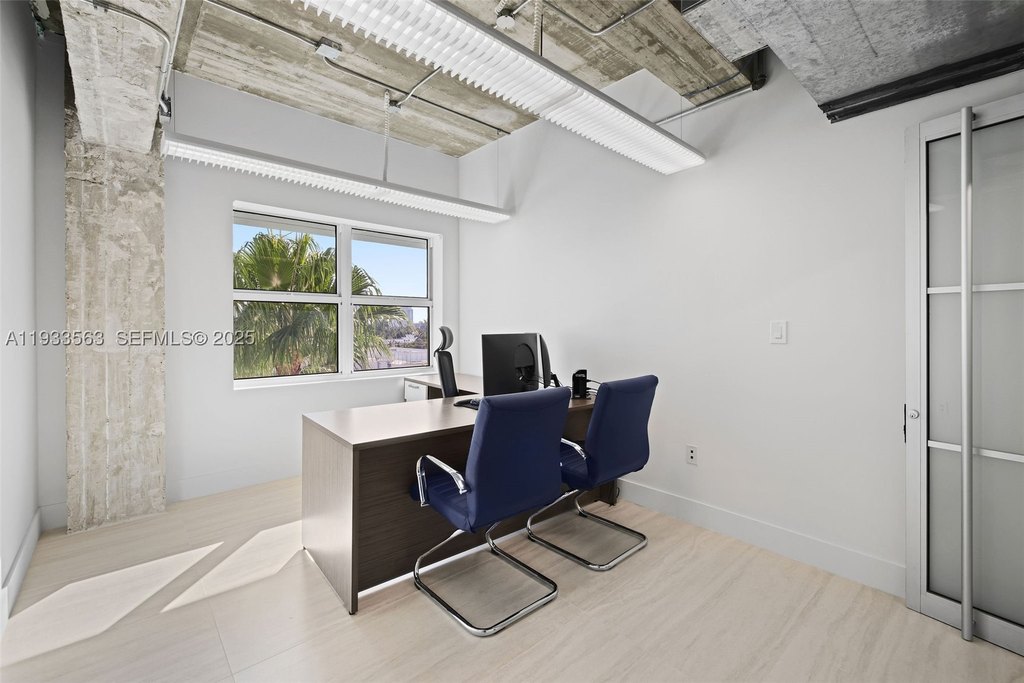
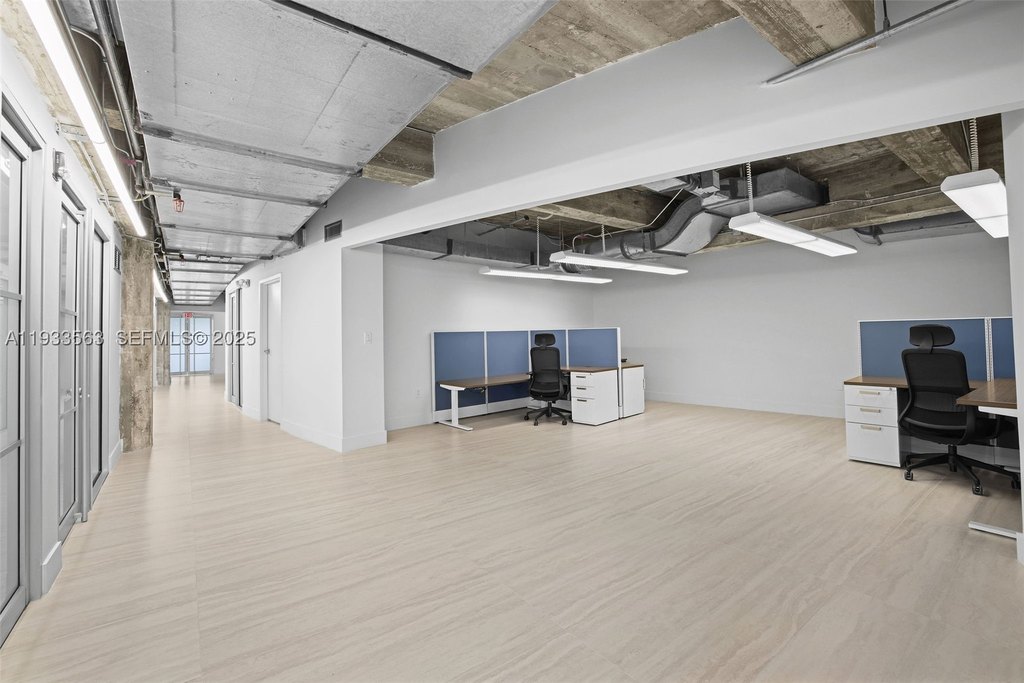
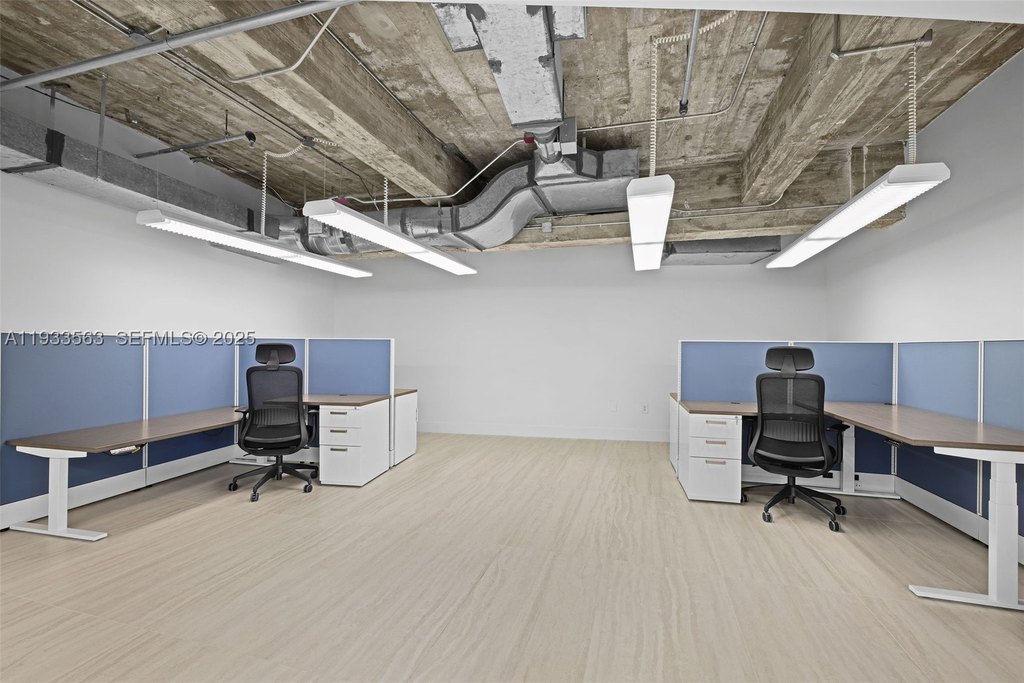
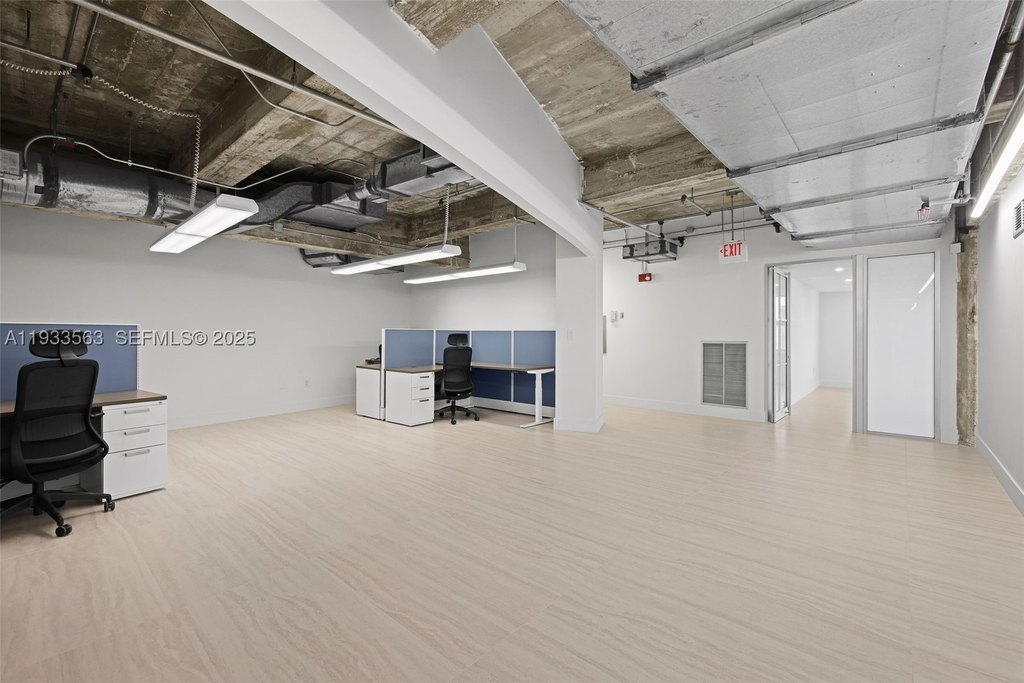
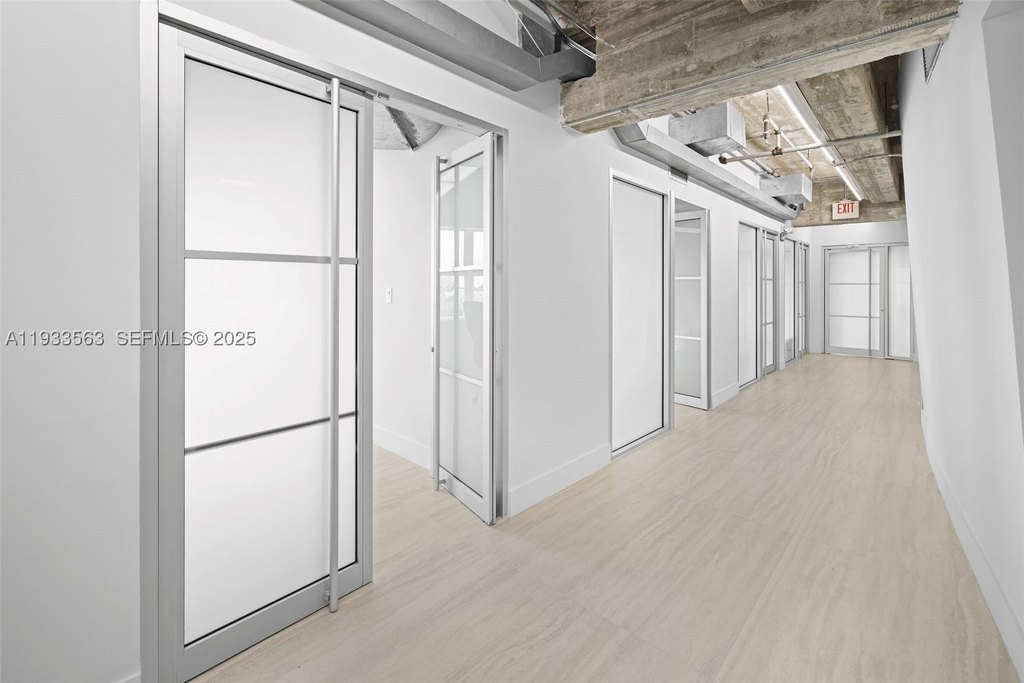
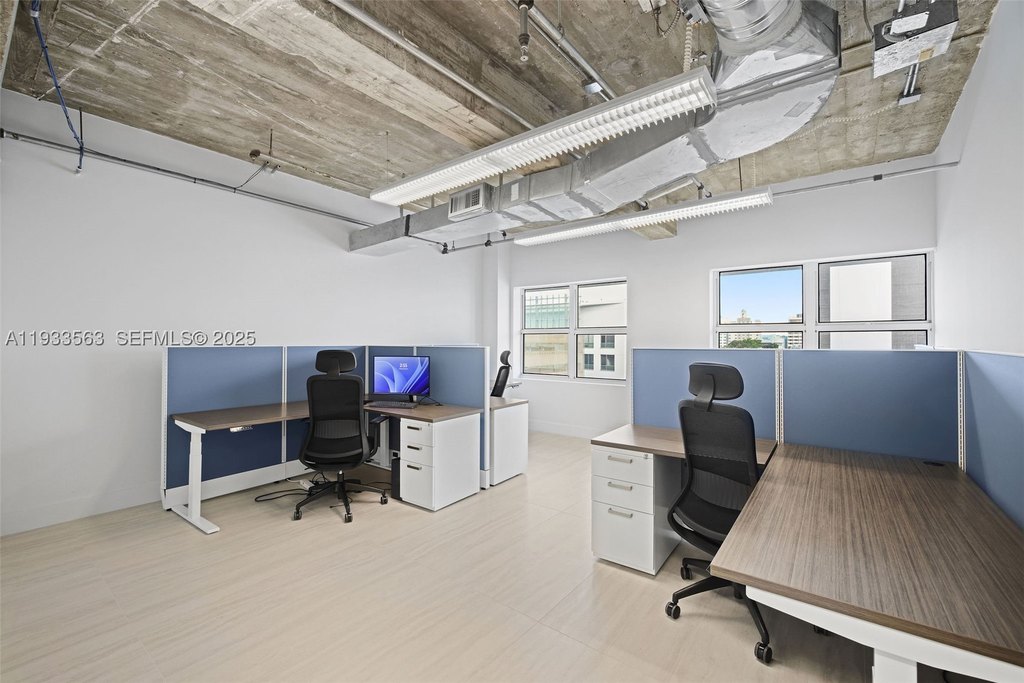
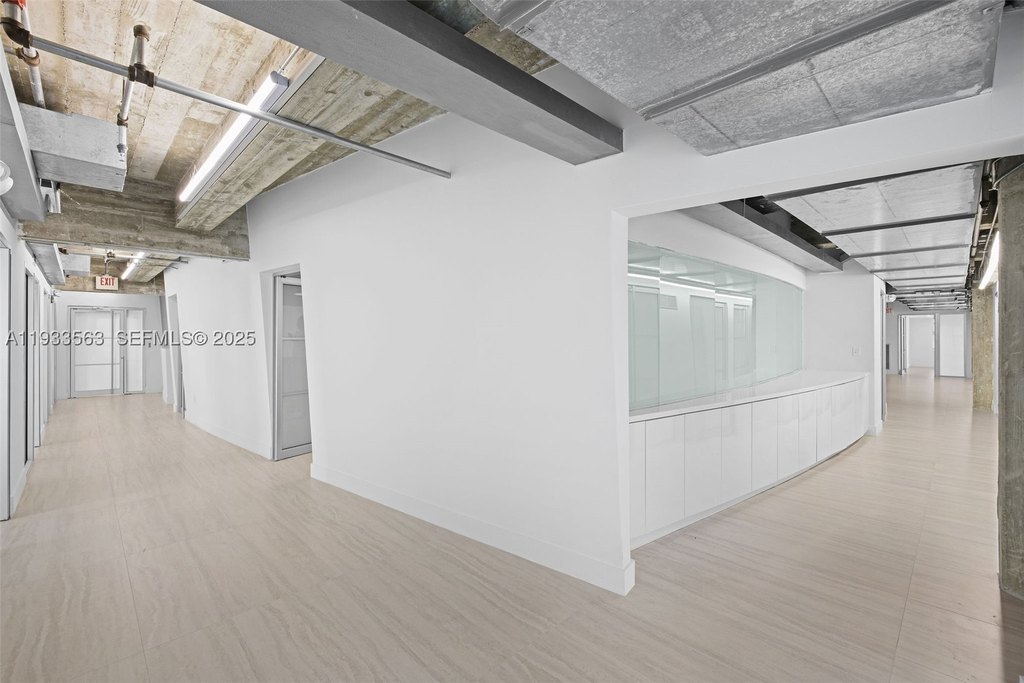
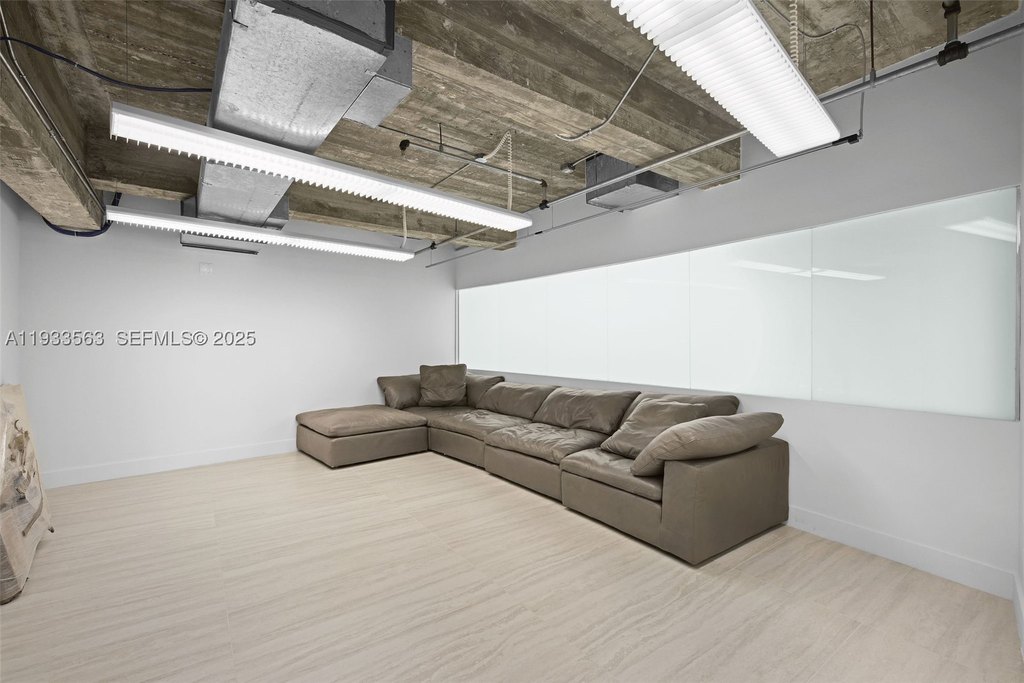
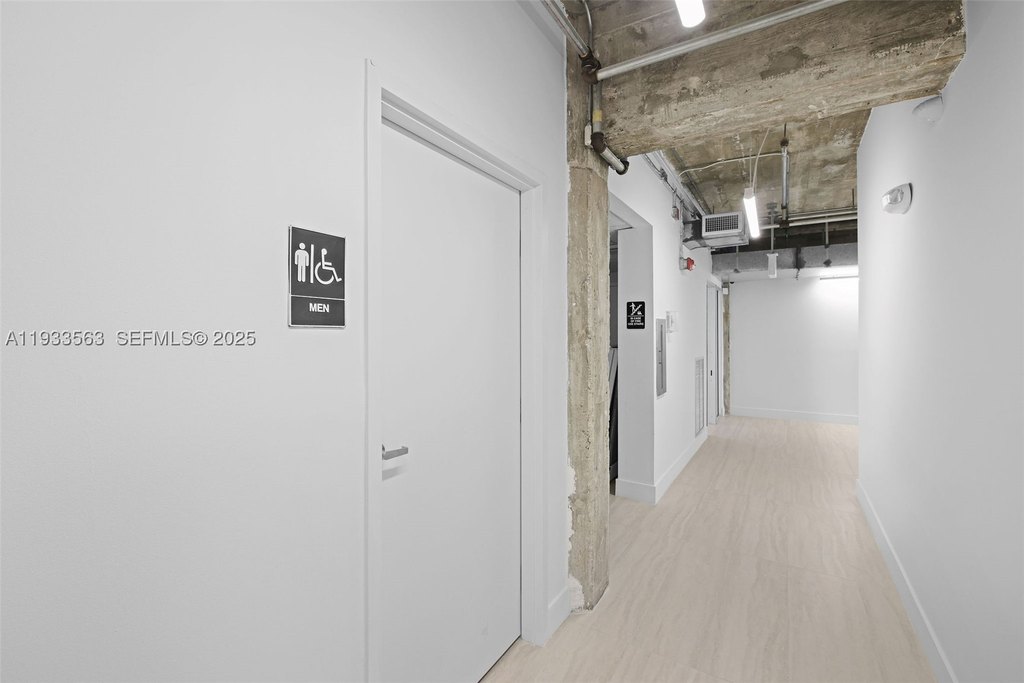
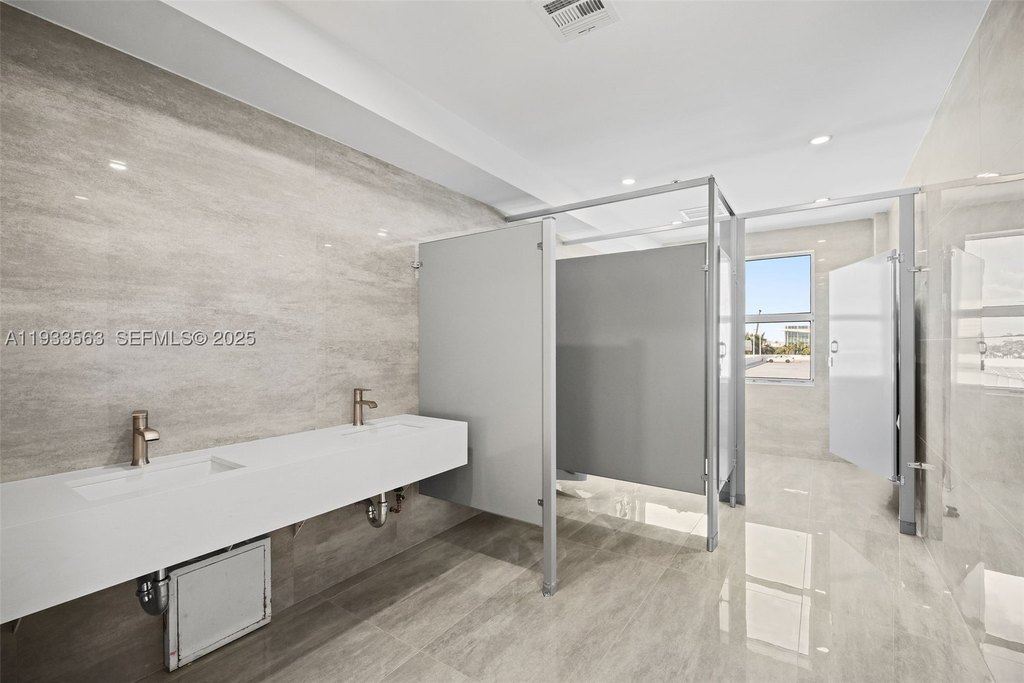
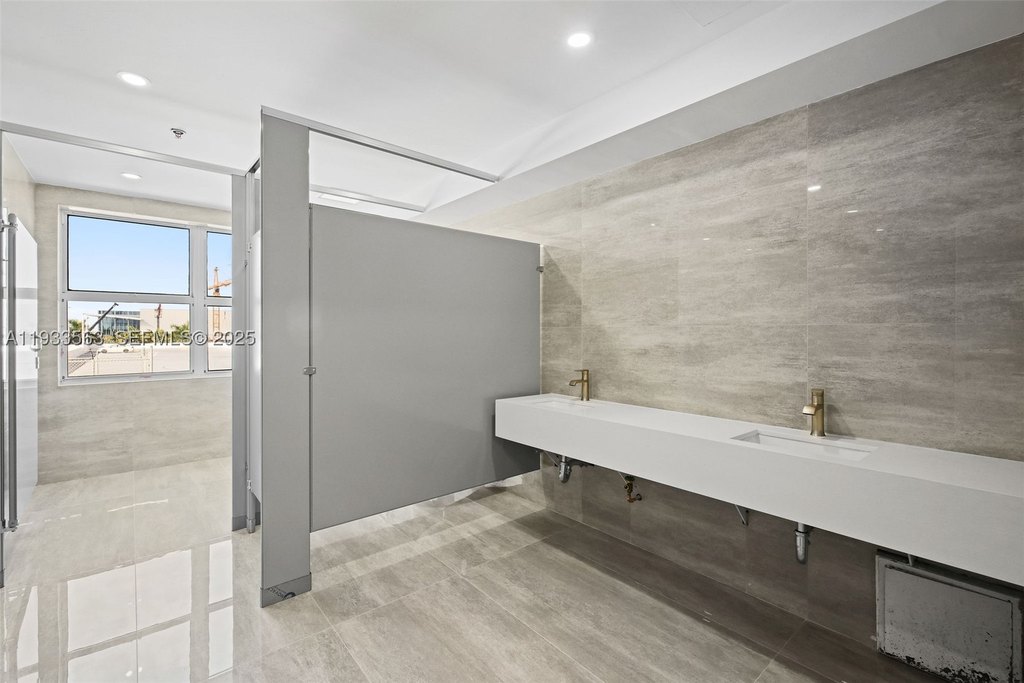
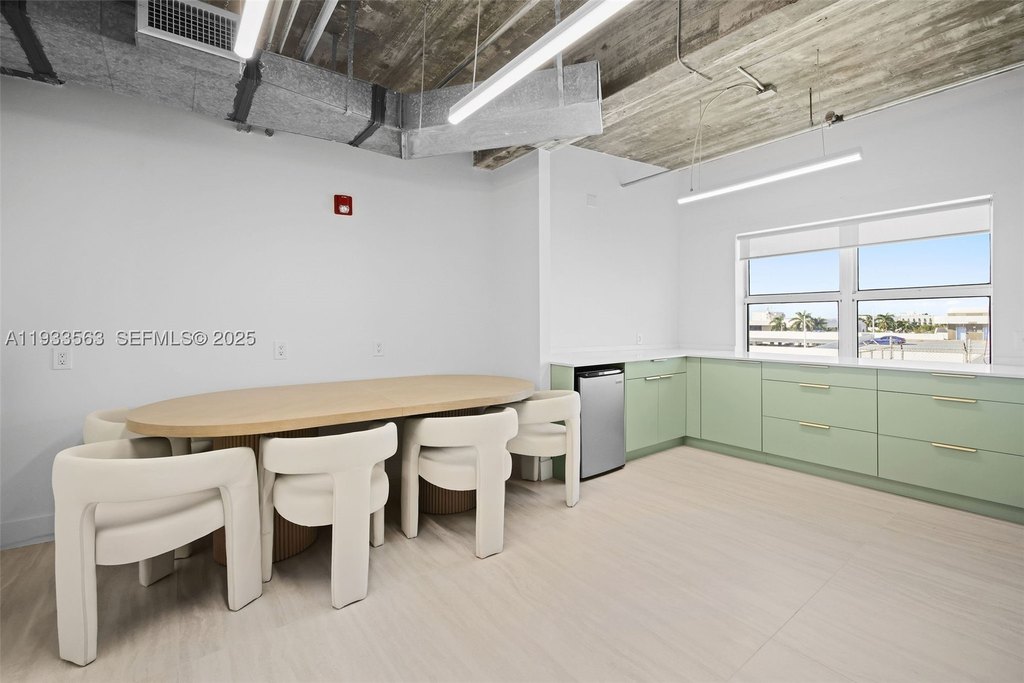
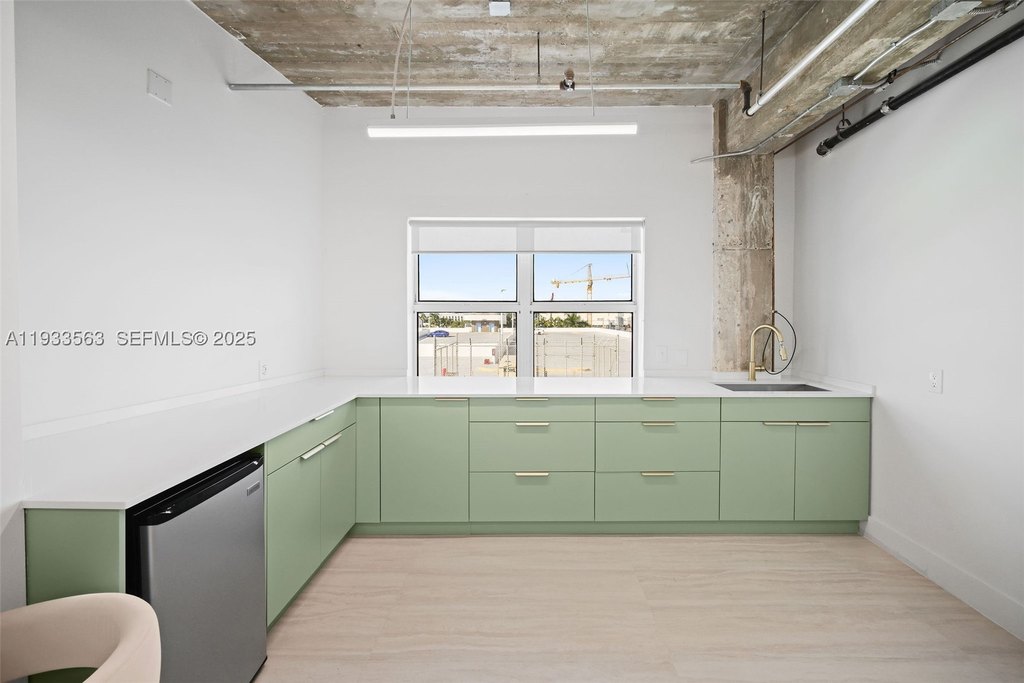
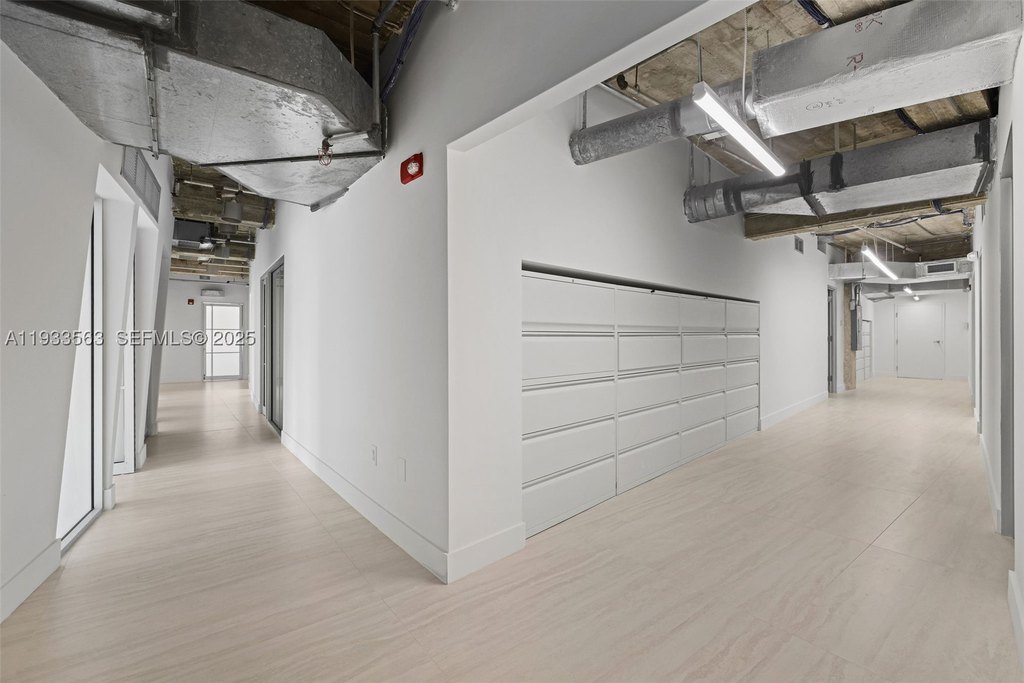
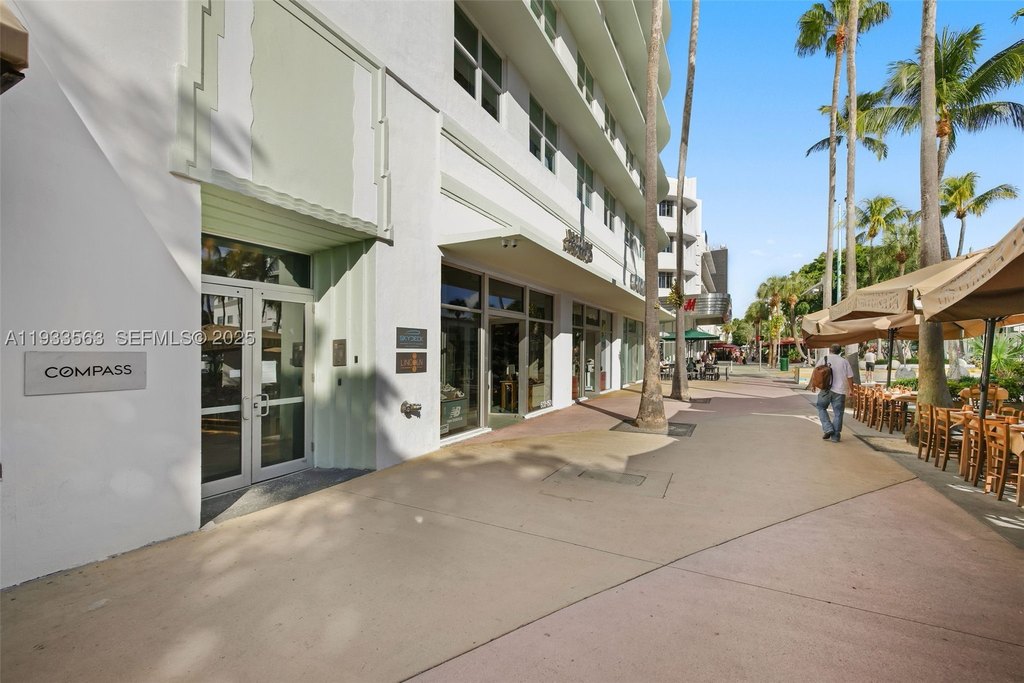
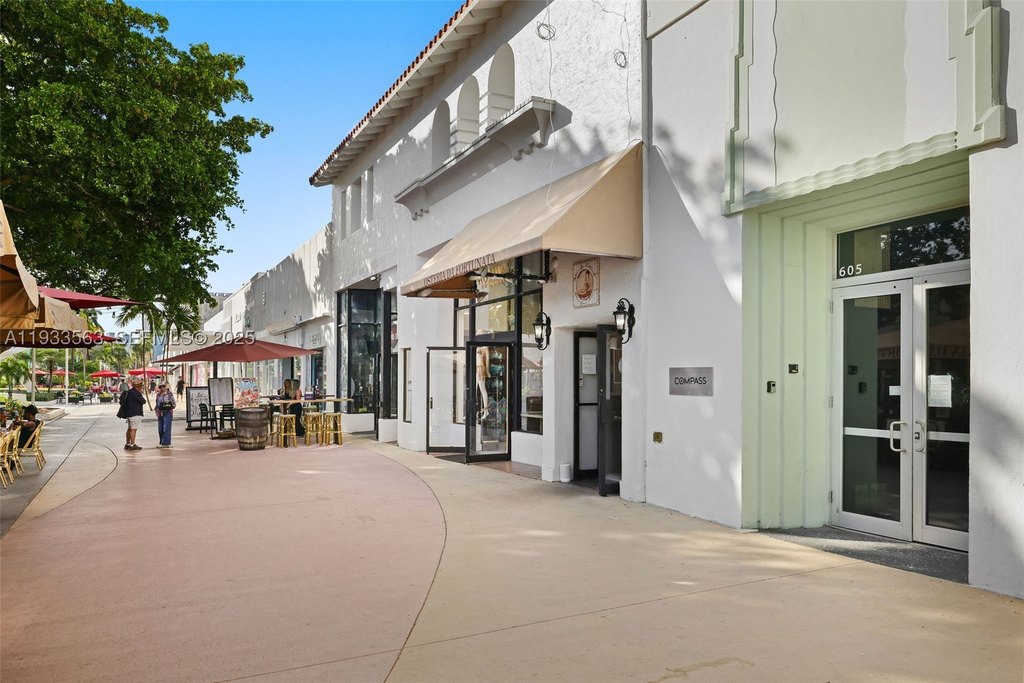
605 Lincoln Road offers an entire fifth-floor office condominium configured for modern workplace use. The lobby entrance has been recently renovated, and the office space itself was fully renovated in 2025. Interior improvements include new porcelain flooring, upgraded bathrooms, a brand-new modern kitchen, custom millwork, and updated lighting. The layout provides 18 private offices, including two executive suites, plus a conference room. A secure elevator opens directly into a private reception area, supporting a controlled, exclusive entry experience. The single-tenant configuration can also be reconfigured for multi-tenant use if desired, while abundant natural light helps create a bright work environment.
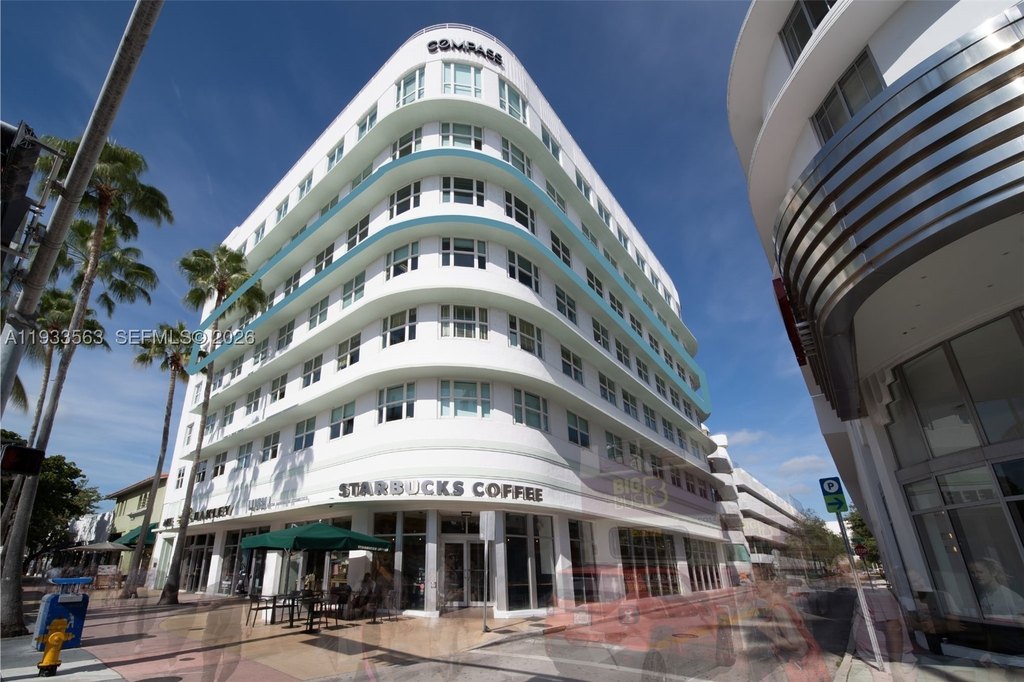
The property is located on Lincoln Road in Miami Beach, within the area known for outdoor shopping, dining, and entertainment. Parking is available through the City of Miami Beach in the adjacent public parking garage. The remarks also note the nearby approved convention center hotel site currently under construction for an approximately 800-room hotel.
This offering is well suited for an organization seeking a move-in-ready, professionally finished office floor with strong privacy and a secure, direct elevator entry into the reception area. With multiple private offices and a built-in conference room, the space supports both client-facing teams and internal operations, while the flexible configuration can accommodate different workplace setups.
The property is located on Lincoln Road in Miami Beach, within the area known for outdoor shopping, dining, and entertainment. Parking is available through the City of Miami Beach in the adjacent public parking garage. The remarks also note the nearby approved convention center hotel site currently under construction for an approximately 800-room hotel.
This offering is well suited for an organization seeking a move-in-ready, professionally finished office floor with strong privacy and a secure, direct elevator entry into the reception area. With multiple private offices and a built-in conference room, the space supports both client-facing teams and internal operations, while the flexible configuration can accommodate different workplace setups.
Key Highlights
- Entire 5th‑floor office condo for sale, approximately 9,800 SF, in a 1932 block construction building
- Fully renovated in 2025 with new porcelain flooring, upgraded bathrooms, brand‑new modern kitchen, custom millwork, and updated lighting
- Flexible layout with 18 private offices (including two executive suites) plus a conference room
Financial Insights For Office B
Simulate Cap Rate and NOI
NOI Build-Up
- Vacancy
- income lost from leasable area expected to sit empty during the year — subtracted from gross rent.
- EGI (Effective Gross Income)
- gross rent minus vacancy losses — the realistic income before paying operating costs.
- OpEx (Operating Expenses)
- recurring costs to operate the property (property tax, insurance, utilities, maintenance, management) — excludes financing and capital improvements.
- NOI (Net Operating Income)
- income a property generates after operating costs but before financing and taxes.
| Component | $ | $/SF |
|---|---|---|
| Gross rent | $446.9k | $45.60 |
| − Vacancy | −$100.5k | −$10.26 |
| EGI | $346.3k | $35.34 |
| − OpEx | −$86.6k | −$8.84 |
| NOI | $259.7k | $26.51 |
9,800 SF · lease $45.60/SF/yr · vacancy 22.50% · expense 25.00%
Alternative Uses
Best Use
Office B
$3.71M
$3.25M – $4.33M
NOI $259,749 @ 7.0% cap · market cap 5.19%
Second Best
—
—
no second resolved use
Theoretical Best
Office A
$4.97M
$4.35M – $5.80M
NOI $348,037 @ 7.0% cap · market cap 6.96%
Zoning and permitted uses should be independently verified with authorities.
Property Analytics
Property Profile
Location Intelligence
Current Use








Frequently Asked Questions
What type of property is this?
Office units - Fully renovated fifth-floor office condo with secure private elevator access, 18 offices, and upgraded finishes throughout.
Where is this office units located?
The property is located at 605 Lincoln Rd Miami Beach, FL.
What is the asking price?
The asking price for this property is $5,000,000.
What are key features of this property?
This property features: Entire 5th‑floor office condo for sale, approximately 9,800 SF, in a 1932 block construction building; Fully renovated in 2025 with new porcelain flooring, upgraded bathrooms, brand‑new modern kitchen, custom millwork, and updated lighting; Flexible layout with 18 private offices (including two executive suites) plus a conference room


