Updated Duplex with Screened
5719 14TH Street E Bradenton, FL 34203
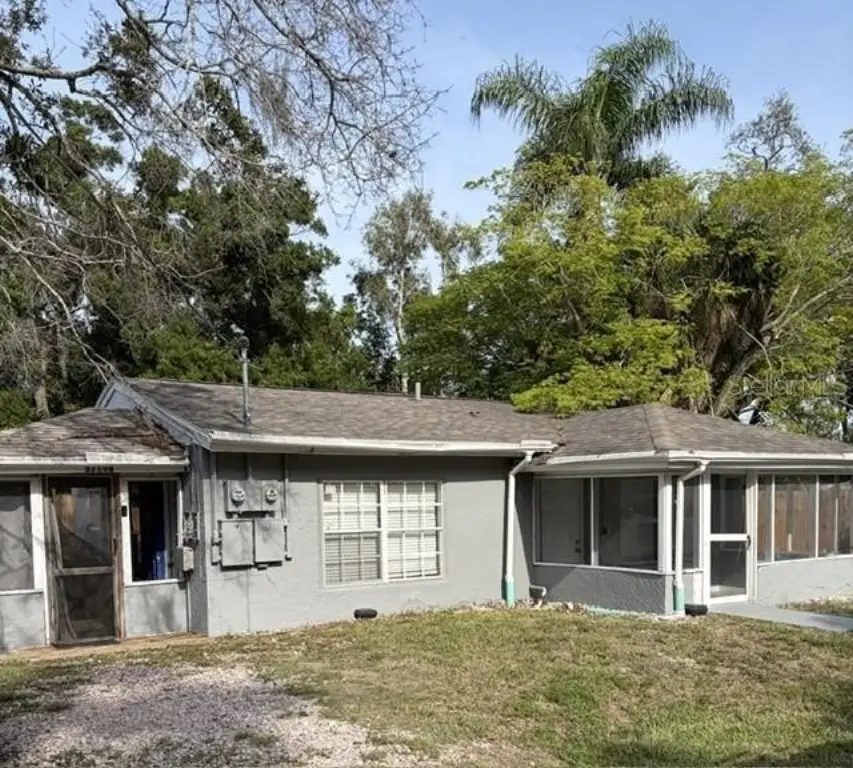
5719 14TH Street E, Bradenton, FL, 34203
$299,900
For Sale
$299,900
MULTI_FAMILY - BRADENTON, FL
Property Size978 SF
Lot Size0.16 Acres
Price / SF$306.65
Days on Market15
Property Features for 5719 14TH Street E
General Information
- Property type
- Residential Multi Family
- Property subtype
- Duplex
- Zoning
- RSF6
- Bedrooms
- 3
- Bathrooms
- 2
- Rooms
- Bathroom 1, Bedroom 1, Bathroom 2, Bedroom 2, Bedroom 3
- Pets allowed
- Yes
- Interior features
- Eat-in Kitchen
- Exterior features
- Fence
- Fencing
- Fenced
- Appliances
- Electric Water Heater
- Standard status
- Active
- APN
- 5810300003
- Size
- 978 SF
- Lot size
- 0.16 Acres
Taxes and HOA fees
- Tax Year
- 2025
- Tax Description
- BEG AT A PT 260 FT E OF NW COR NE1/4 OF NE1/4 OF SE1/4 SEC 13, THENCE S 255 FT TO POB, THENCE S 75 FT; E 100 FT,THENCE N 75 FT, THENCE W 100 FT TO POB, LESS W 10 FT FOR D/W P-50-S PI#58103.0000/3
- Tax Annual Amount
- 2998
Utilities
- Utilities
- Cable Available
- Sewer type
- Public Sewer
- Heating system
- Central
- Cooling system
- Central Air
- Water source
- Public
Building Details
- Year built
- 1949
- Floors in Building
- 1
- Number of units
- 2
- Flooring type
- Tile - Ceramic
- Building materials
- Stucco, Frame
- Roof type
- Shingle
Listing agency
CHARLES RUTENBERG REALTY INC
(727) 538-9200
Listed by
Mark Hartman · License #3111305
(727) 643-4508
Added: Jul 7 Updated: Jul 20 at 9:04PM Checked: Jul 21 at 8:06PM
MLS# TB8526672
Copyright © 2026 Stellar MLS. All rights reserved. All information provided by the listing agent/broker is deemed reliable but is not guaranteed and should be independently verified.
Investment Insights
Based on property information with market context.
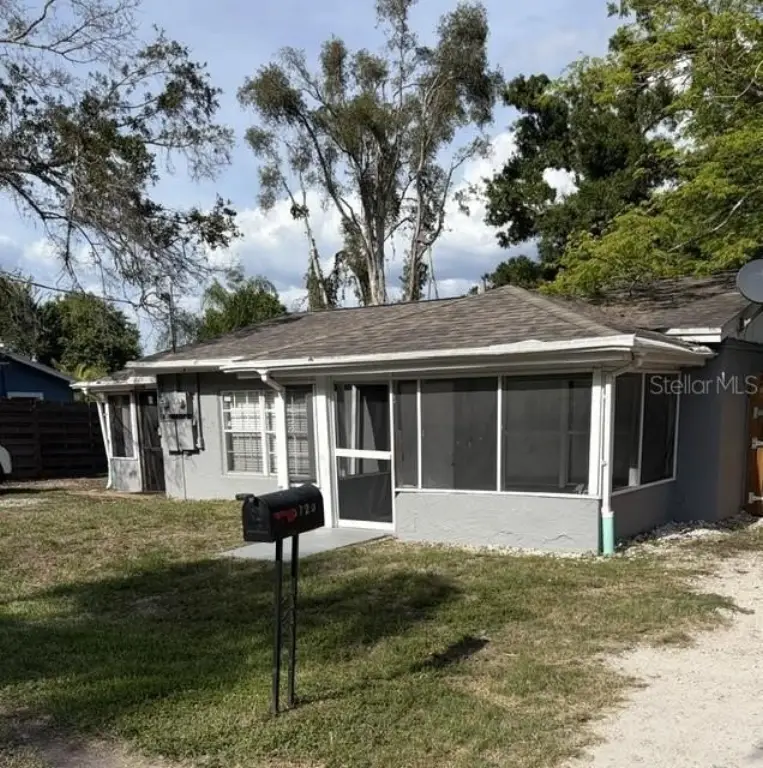
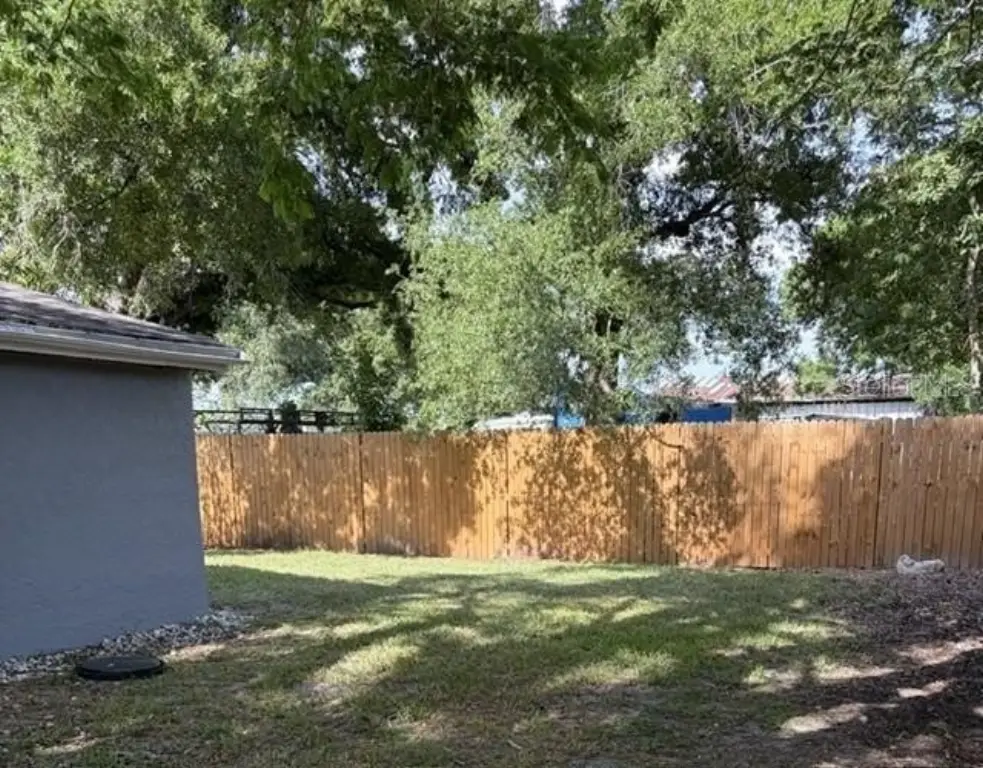
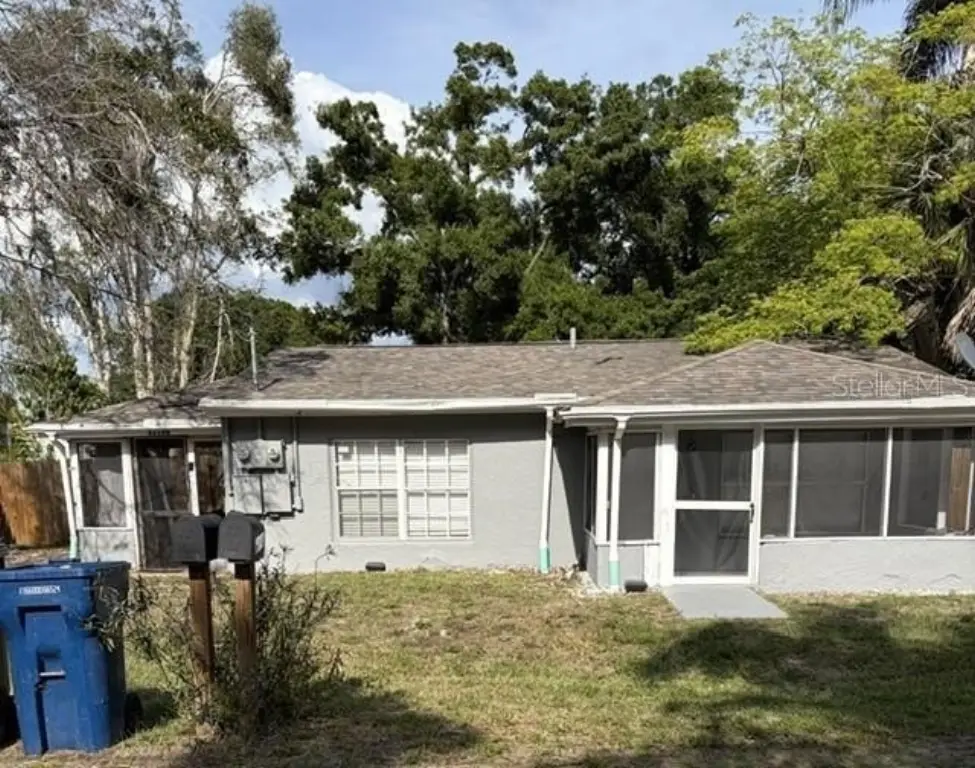
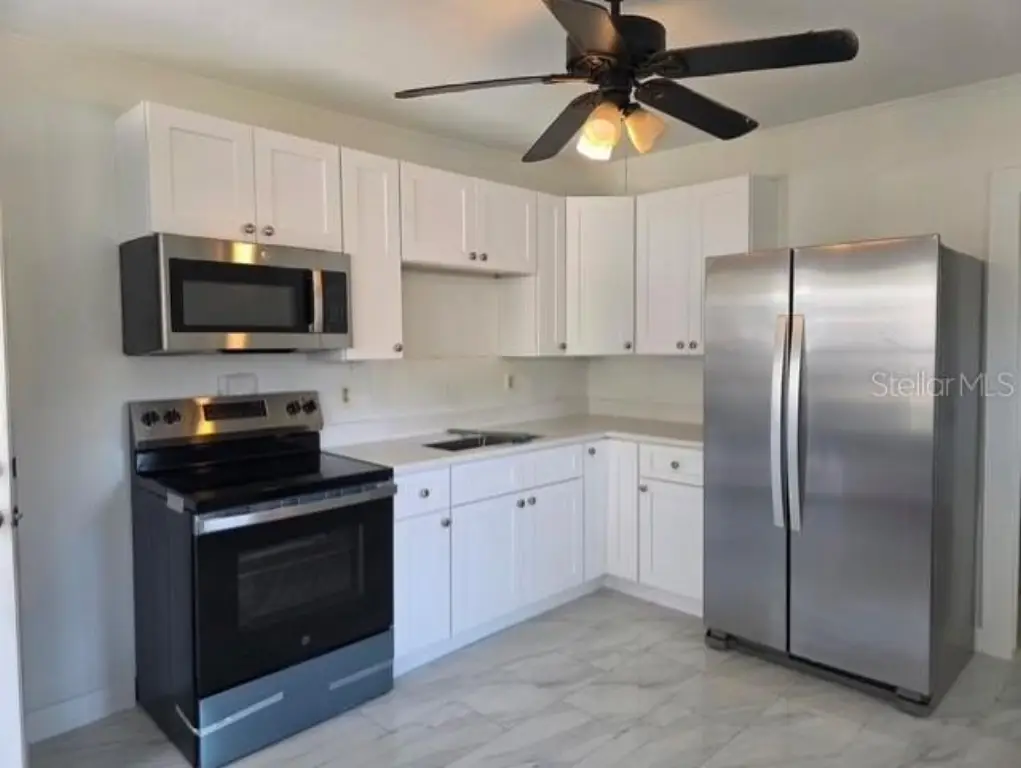
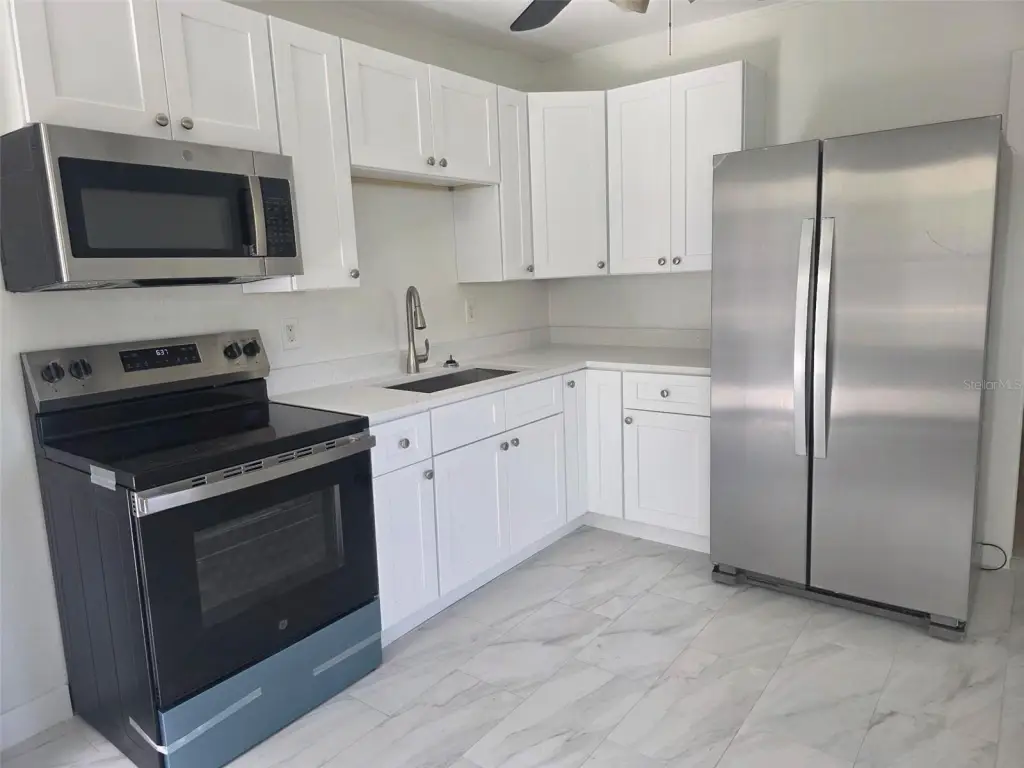
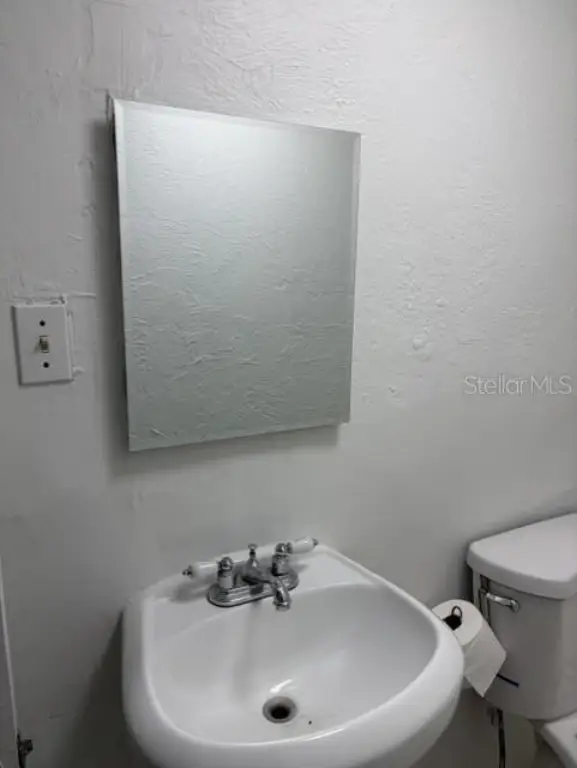
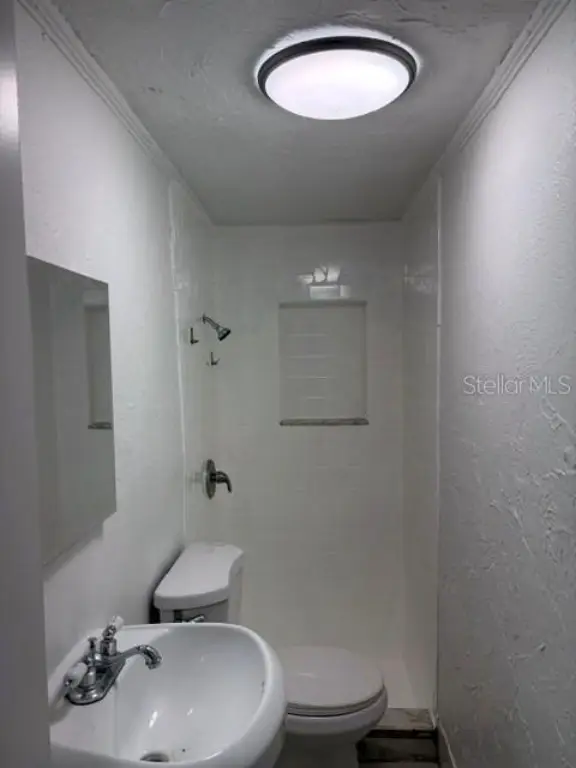
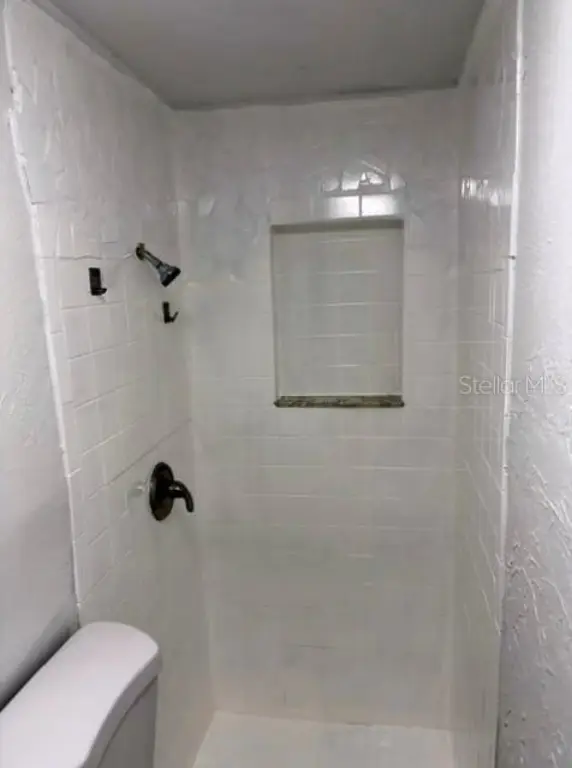
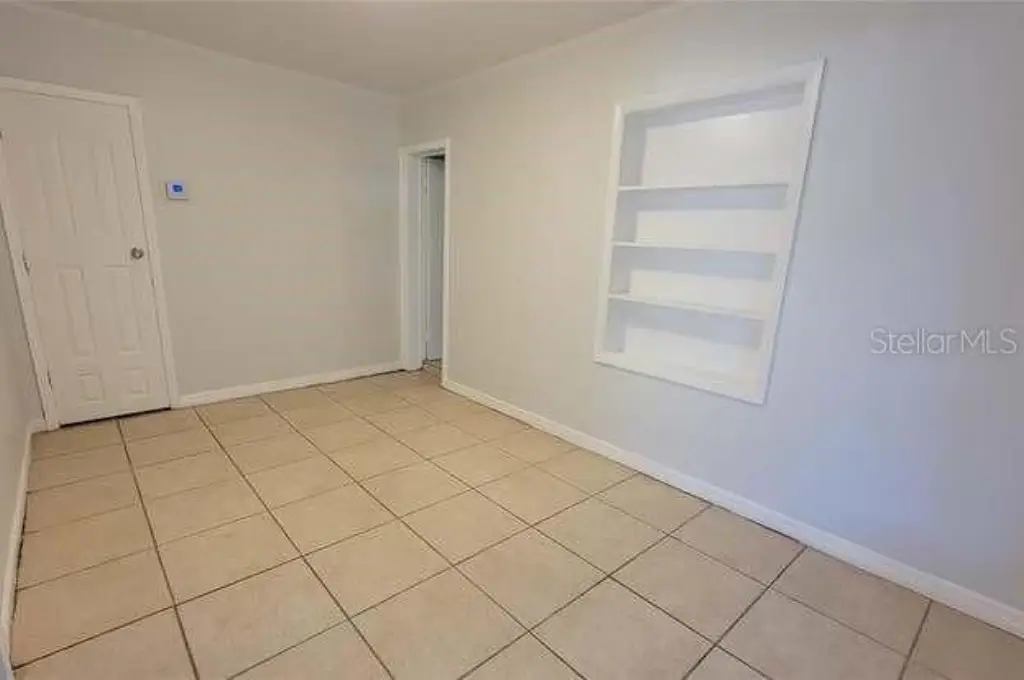
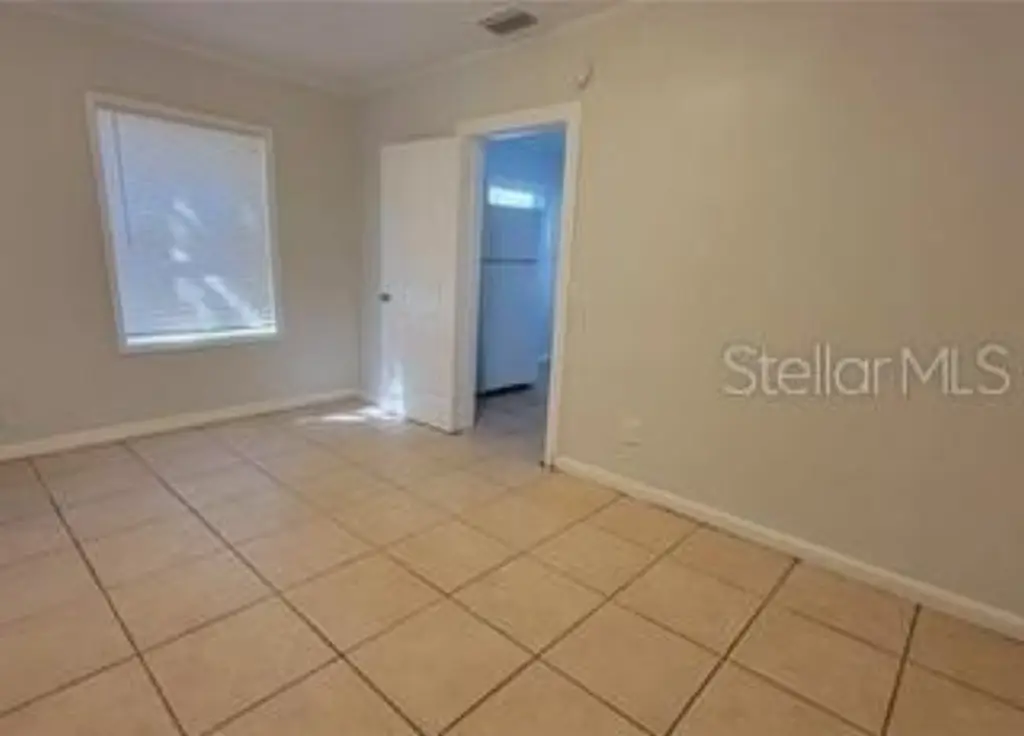
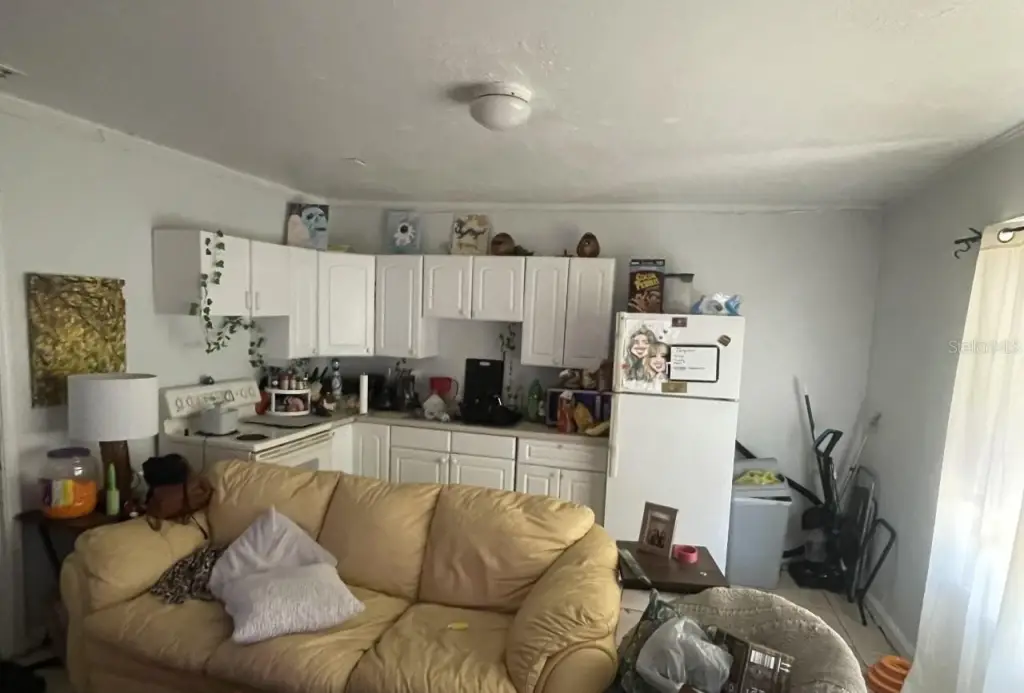
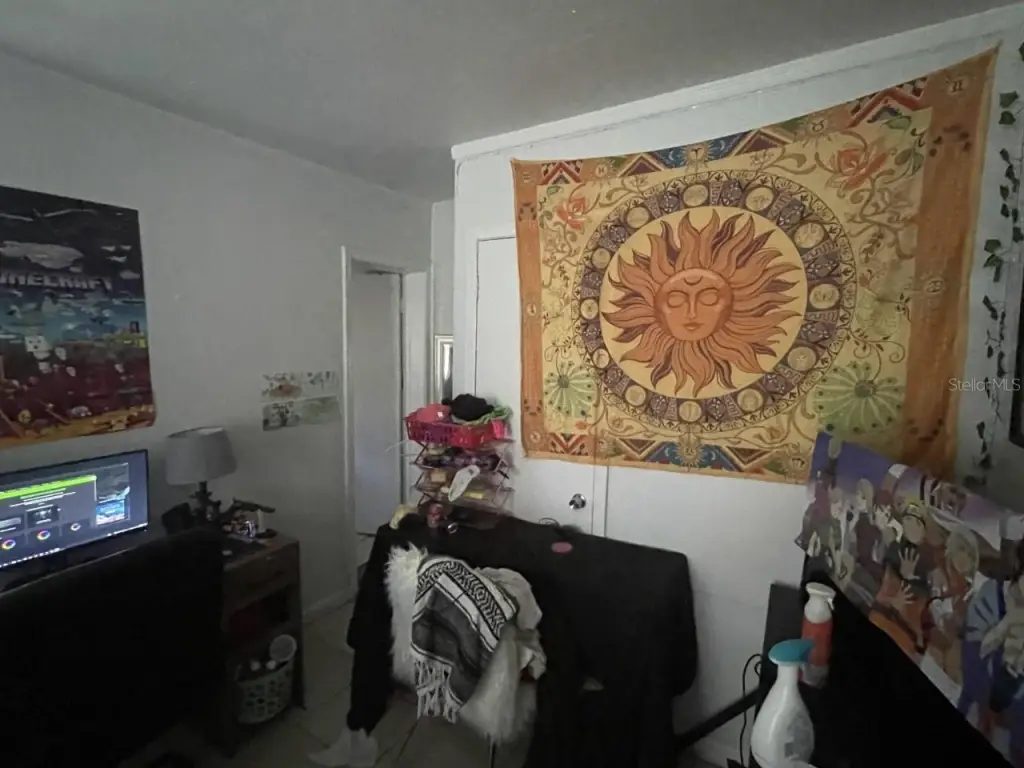
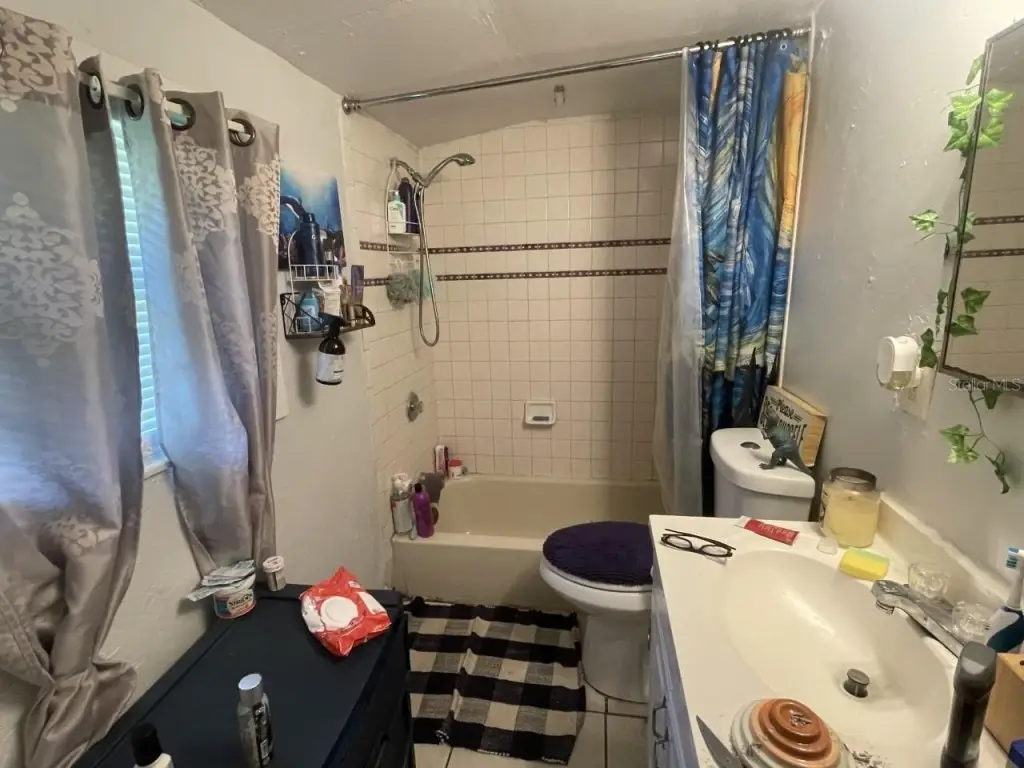
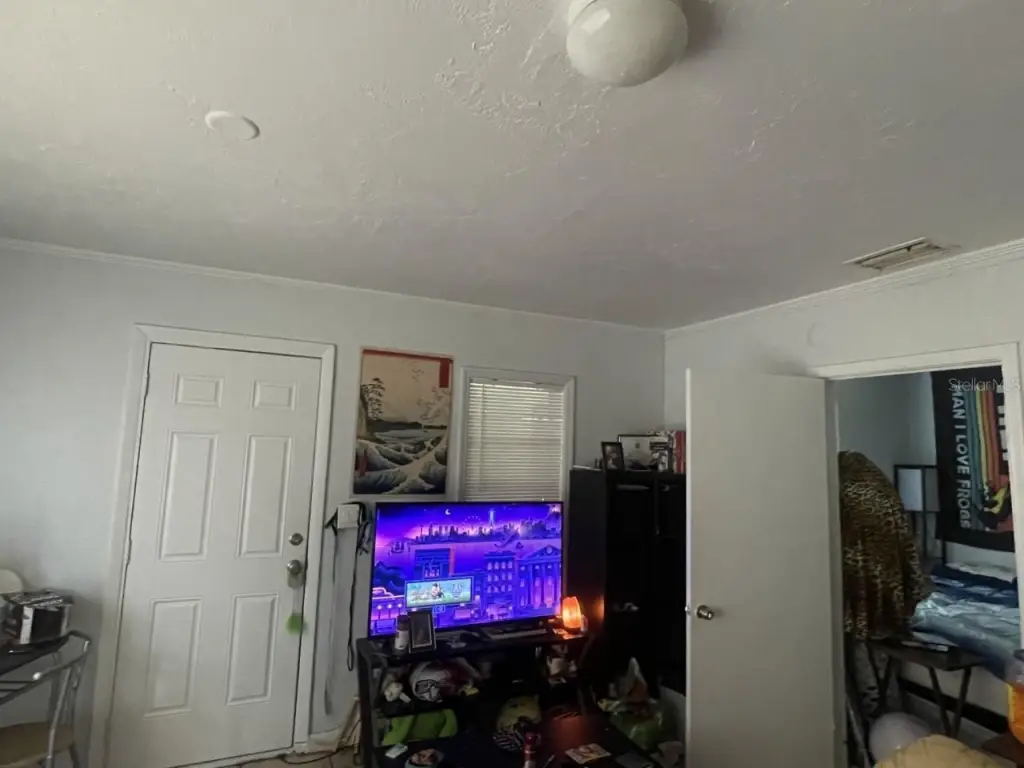
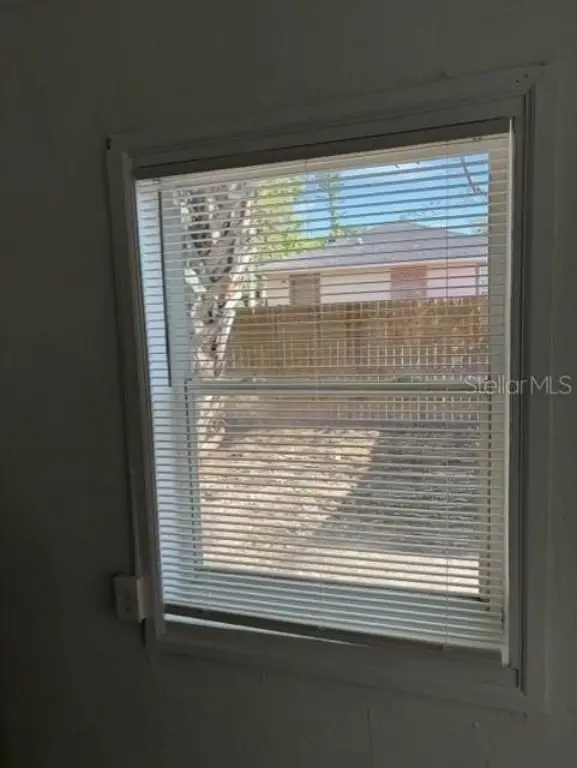
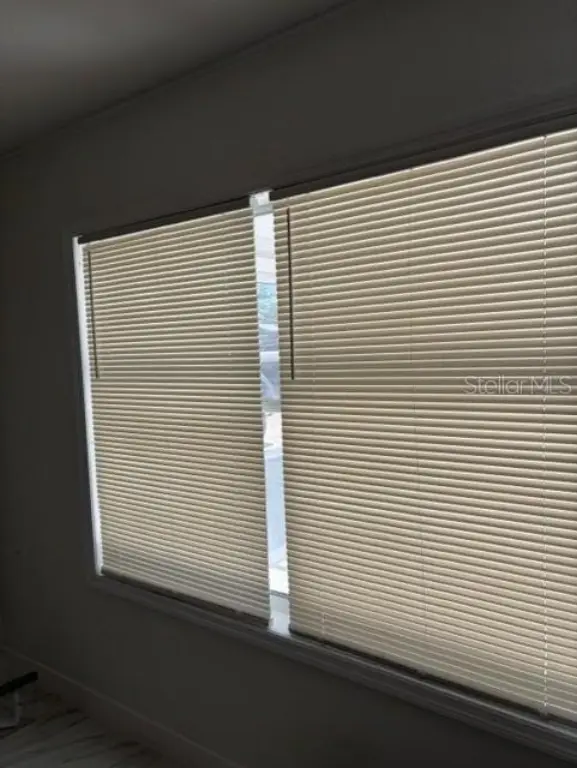
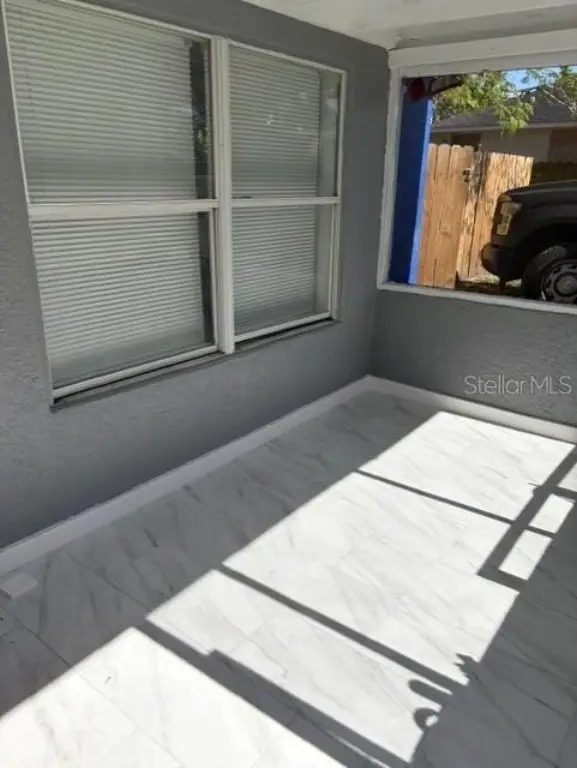
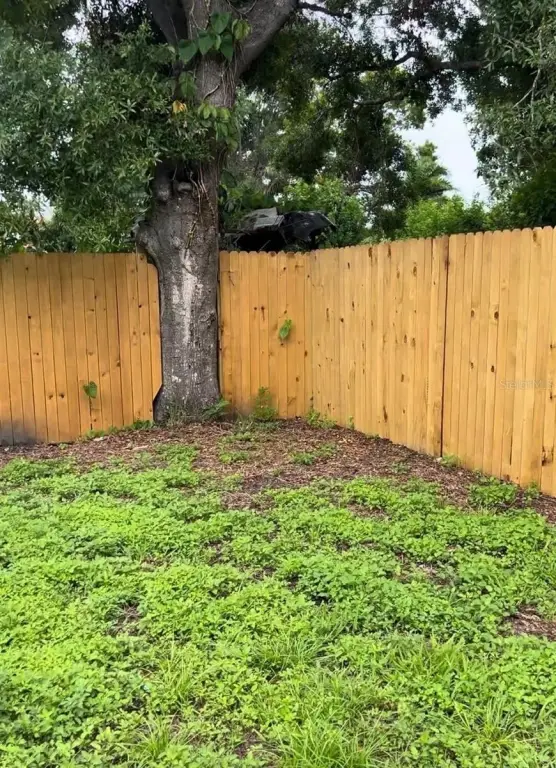
This updated duplex features newer roof and newer central HVAC systems for both sides. Interior finishes include ceramic tile flooring flowing room to room, and each unit offers a screened-in lanai that extends covered outdoor living space. The property also includes a generously sized backyard with a newly enclosed fence for added privacy. Unit B has been refreshed with a brand new kitchen remodel, including new cabinets, oven/range, stainless steel refrigerator, quartz countertops, stainless sink and faucet, and new tile flooring. Unit B’s bath has been resurfaced with an updated shower and newer commode, and the screened-in lanai has been newly painted with new ceramic tile.
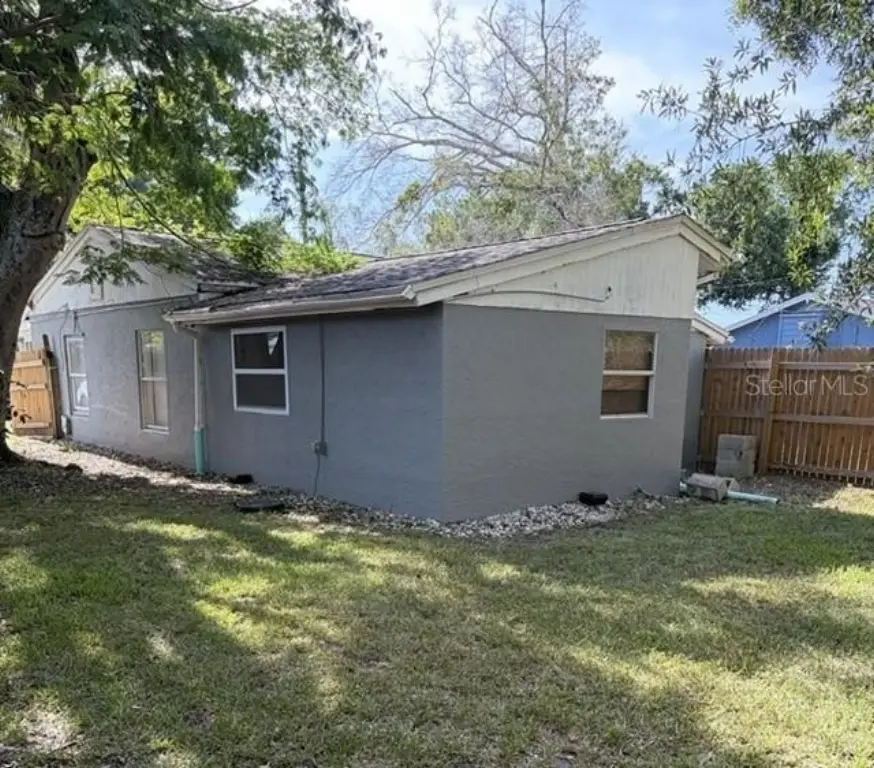
Driveway parking is available on each side for 1–2 cars. The duplex is positioned within Manatee County and is zoned RSF6. Leases are assignable, with the possibility of an owner occupying one side while renting the other, subject to lease terms and applicable requirements. The exterior stucco has been recently painted with a professionally applied elastomeric lifetime coating.
For more details, including the 2025–26 rent rolls, availability can be requested. Please do not disturb tenants.
Driveway parking is available on each side for 1–2 cars. The duplex is positioned within Manatee County and is zoned RSF6. Leases are assignable, with the possibility of an owner occupying one side while renting the other, subject to lease terms and applicable requirements. The exterior stucco has been recently painted with a professionally applied elastomeric lifetime coating.
For more details, including the 2025–26 rent rolls, availability can be requested. Please do not disturb tenants.
Key Highlights
- Duplex with 2 bedrooms and 3 bedrooms, built in 1949, offering two separate bathrooms and bedrooms by room layout
- Recently updated systems: newer central HVAC systems (both sides) plus a newer roof
- Ceramic tile flooring and eat‑in kitchen, with central heating and central air
Local Financial Insights For Multifamily LT 5
Simulate Cap Rate and NOI
NOI Build-Up
- Vacancy
- income lost from leasable area expected to sit empty during the year — subtracted from gross rent.
- EGI (Effective Gross Income)
- gross rent minus vacancy losses — the realistic income before paying operating costs.
- OpEx (Operating Expenses)
- recurring costs to operate the property (property tax, insurance, utilities, maintenance, management) — excludes financing and capital improvements.
- NOI (Net Operating Income)
- income a property generates after operating costs but before financing and taxes.
| Component | $ | $/SF |
|---|---|---|
| Gross rent | $19.4k | $19.80 |
| − Vacancy | −$1.0k | −$1.03 |
| EGI | $18.4k | $18.77 |
| − OpEx | −$5.5k | −$5.63 |
| NOI | $12.8k | $13.14 |
978 SF · lease $19.80/SF/yr · vacancy 5.22% · expense 30.00%
Alternative Uses
Best Use
Multifamily LT 5
$183.5K
$160.6K – $214.1K
NOI $12,848 @ 7.0% cap · market cap 4.28%
Second Best
Apartment 5plus
$169.1K
$147.9K – $197.2K
NOI $11,834 @ 7.0% cap · market cap 3.95%
Theoretical Best
Office A
$287.6K
$251.7K – $335.5K
NOI $20,132 @ 7.0% cap · market cap 6.71%
Zoning and permitted uses should be independently verified with local authorities.
Property Analytics
Property Profile
Location Intelligence
Current Use by Public Records
Duplexes
Similar For Sale Nearby










FAQs
What type of property is this?
Duplex - Recently updated duplex with newer roof and central HVAC on both sides, plus screened lanai space for each unit.
Where is this duplex located?
The property is located at 5719 14TH Street E Bradenton, FL.
What is the asking price?
The asking price for this property is $299,900.
What are key features of this property?
This property features: Duplex with 2 bedrooms and 3 bedrooms, built in 1949, offering two separate bathrooms and bedrooms by room layout; Recently updated systems: newer central HVAC systems (both sides) plus a newer roof; Ceramic tile flooring and eat‑in kitchen, with central heating and central air