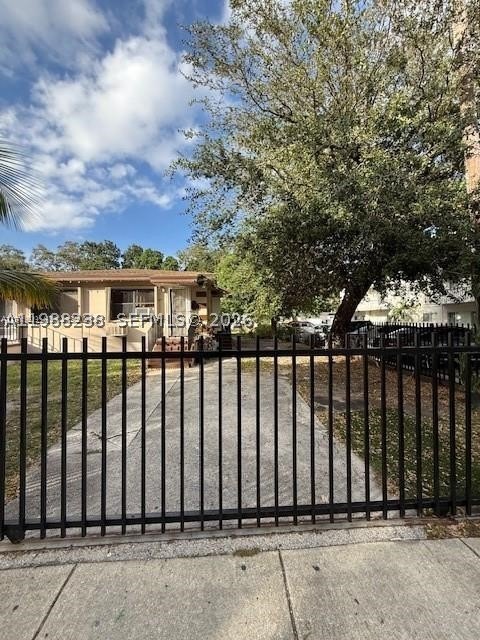
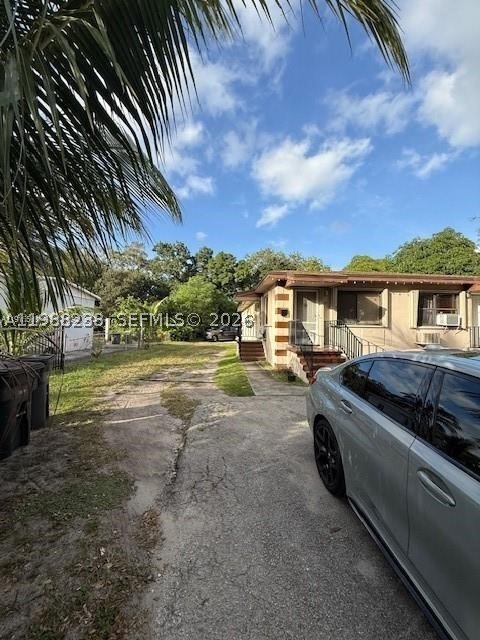
Four-Unit Residential Income
551-553 NE 133rd St North Miami, FL 33161
For Sale
$675,000
MULTI_FAMILY - Other - North Miami, FL
Property Size2,000 SF
Price / SF$337.50
Days on Market12
Property Features for 551-553 NE 133rd St
General Information
Property type
Residential Multi Family
Property subtype
Quadruplex
Parking
8
Standard status
Active
APN
06-22-30-022-0130
Size
2,000 SF
Taxes and HOA fees
Tax Year
2025
Tax Description
ALBERTA BISCAYNE 2ND REV PL PB 39-87 W1/2 LOT 5 & E25FT LOT 6 BLK 2 LOT SIZE 75.000 X 137 OR 10417-1157 0579 6
Tax Annual Amount
10058
Utilities
Utilities
Cable Available
Sewer type
Public Sewer
Heating system
Zoned, Electric (Heating)
Cooling system
Zoned, Electric
Building Details
Year built
1948
Floors in Building
1
Flooring type
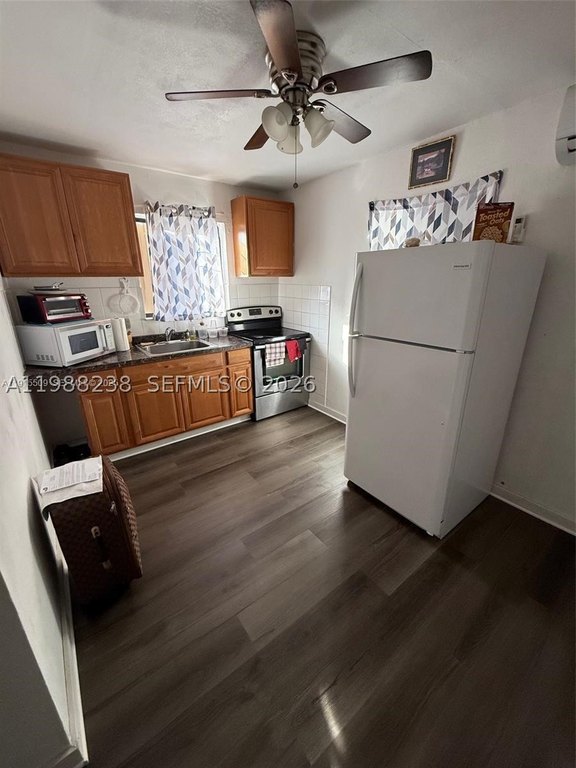
Laminate
Building materials
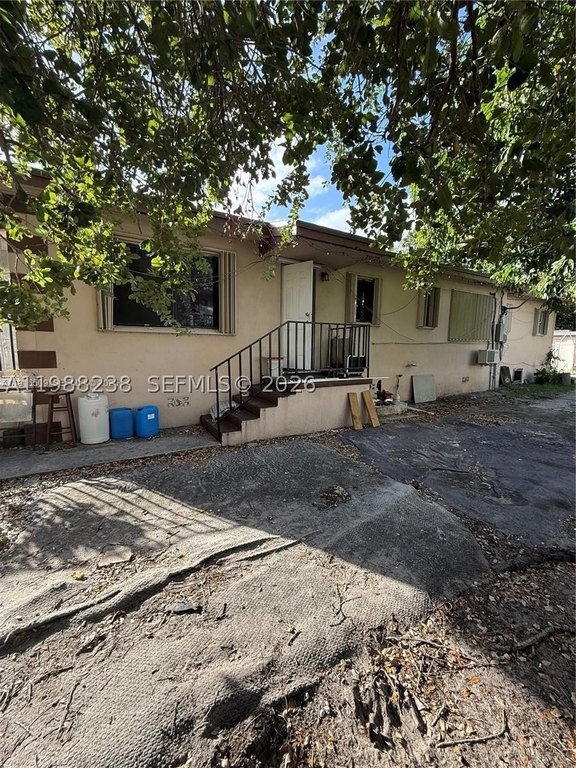
Block
Roof type
Shingle
Architectural style
Other
Listing Agency:
Elite Sales Group
(305) 554-1544
Listed By:
Marcus Da Silveira · License #3497219
(954) 243-5450
Added: Jul 16
Changed: Jul 18
Last Checked: Jul 27 at 1:06PM
MLS# A11988238
Copyright © 2026 Miami REALTORS®. All rights reserved. All information provided by the listing agent/broker is deemed reliable but is not guaranteed and should be independently verified.
Investment Insights
Based on property information with market context.
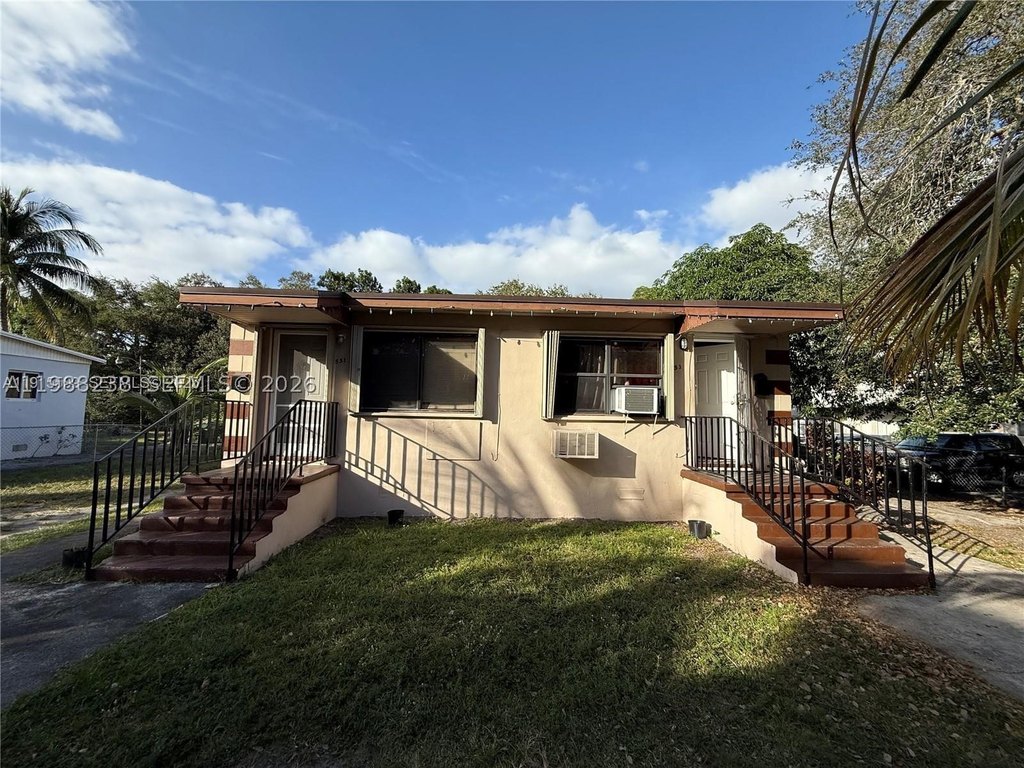
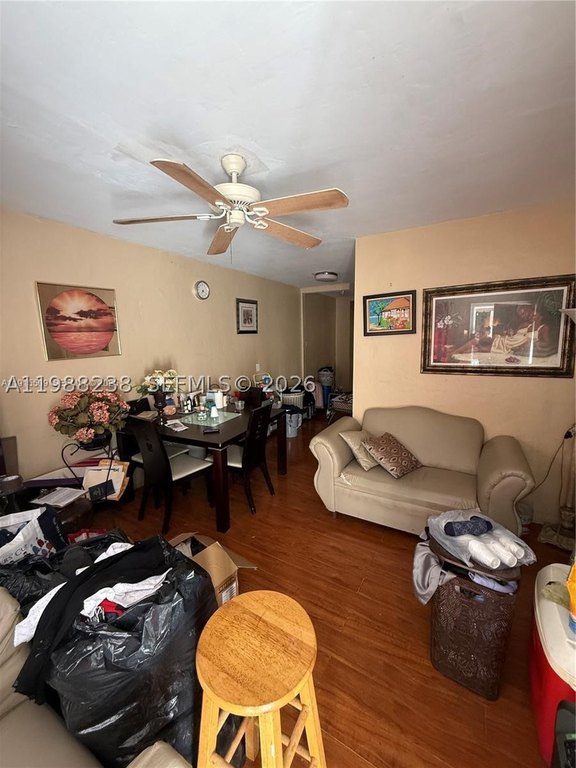
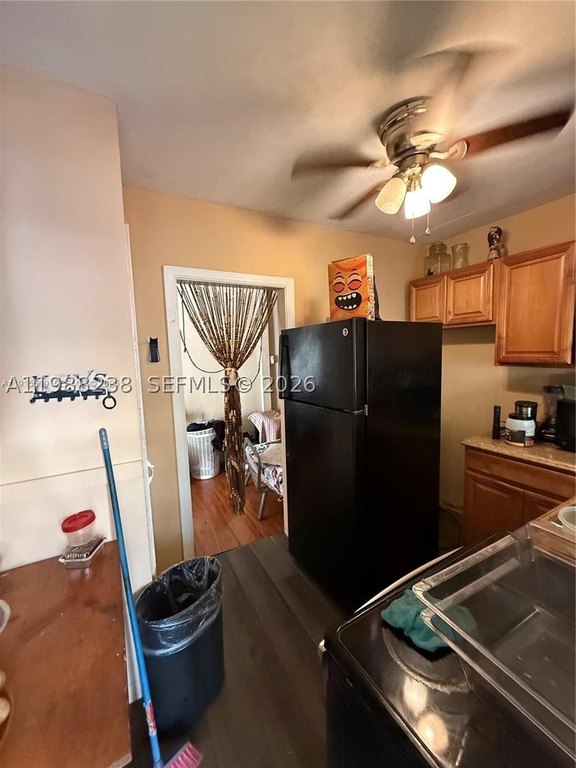
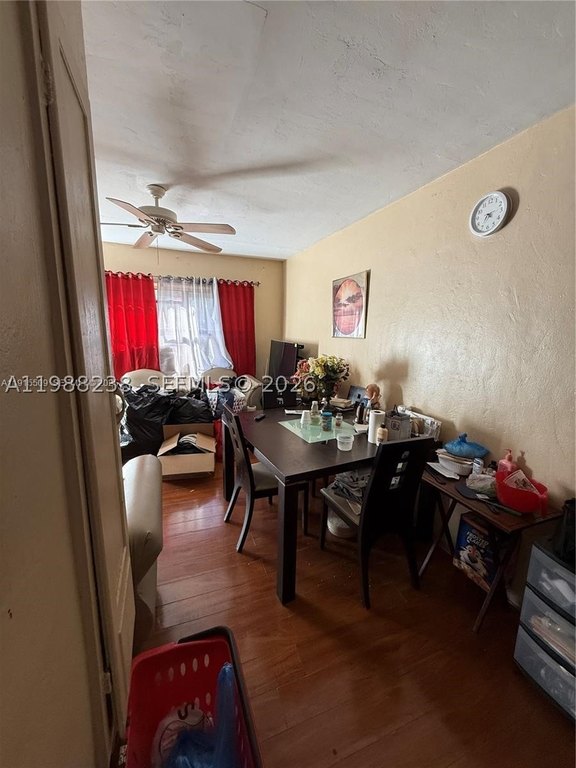
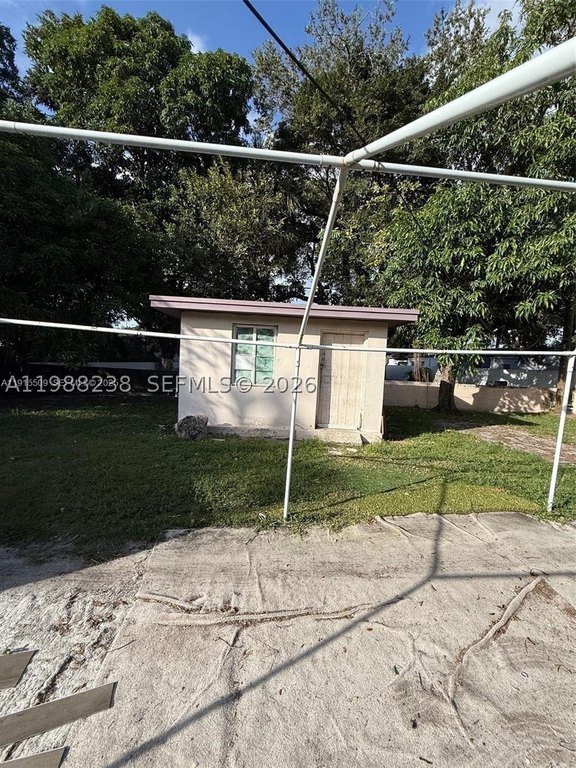
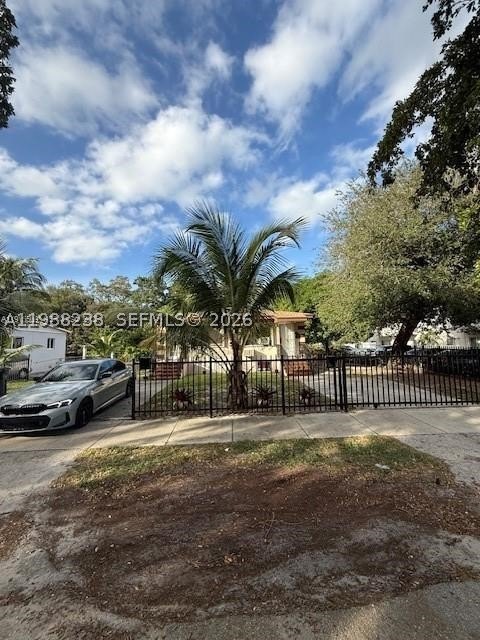
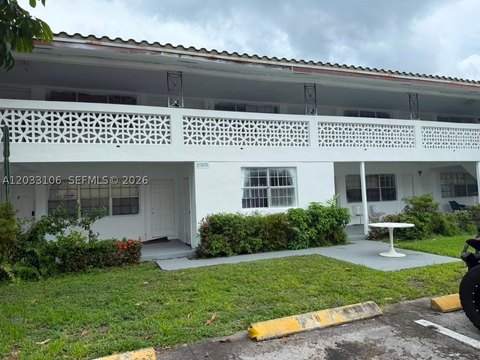
This property is a well-maintained four-unit residential income asset configured as a quadplex. It is described as having four fully rented units, supporting an operating setup with in-place tenants. The total property size is listed as 2,000 square feet.
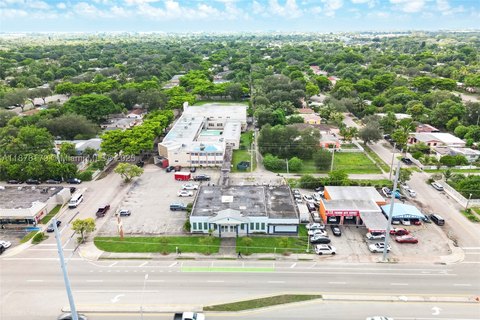
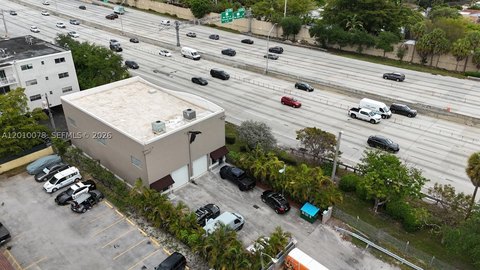
The property is located in North Miami, Florida at 551-553 NE 133rd St (33161) in Miami-Dade County. The listing notes convenient access to shopping, dining, major highways, and local beaches, positioning the asset for tenants who value everyday convenience and regional connectivity.
For buyers seeking an income property with four in-place units, this asset offers a turnkey setup as presented in the offering materials. The combination of maintained condition and current occupancy can simplify initial operational planning for an owner-operator or investor looking for a straightforward multi-unit purchase. The stated monthly rent stability and long-term tenant characterization should be confirmed during due diligence, but the current arrangement is central to the property’s appeal as marketed.
The property is located in North Miami, Florida at 551-553 NE 133rd St (33161) in Miami-Dade County. The listing notes convenient access to shopping, dining, major highways, and local beaches, positioning the asset for tenants who value everyday convenience and regional connectivity.
For buyers seeking an income property with four in-place units, this asset offers a turnkey setup as presented in the offering materials. The combination of maintained condition and current occupancy can simplify initial operational planning for an owner-operator or investor looking for a straightforward multi-unit purchase. The stated monthly rent stability and long-term tenant characterization should be confirmed during due diligence, but the current arrangement is central to the property’s appeal as marketed.
Key Highlights
- Block construction with 1948 build year
- Four fully rented units generating consistent monthly cash flow
- Zoned electric heating and zoned electric cooling
Financial Insights For Multifamily LT 5
Simulate Cap Rate and NOI
NOI Build-Up
- Vacancy
- income lost from leasable area expected to sit empty during the year — subtracted from gross rent.
- EGI (Effective Gross Income)
- gross rent minus vacancy losses — the realistic income before paying operating costs.
- OpEx (Operating Expenses)
- recurring costs to operate the property (property tax, insurance, utilities, maintenance, management) — excludes financing and capital improvements.
- NOI (Net Operating Income)
- income a property generates after operating costs but before financing and taxes.
| Component | $ | $/SF |
|---|---|---|
| Gross rent | $50.4k | $25.20 |
| − Vacancy | −$2.8k | −$1.39 |
| EGI | $47.6k | $23.81 |
| − OpEx | −$14.3k | −$7.14 |
| NOI | $33.3k | $16.67 |
2,000 SF · lease $25.20/SF/yr · vacancy 5.50% · expense 30.00%
Alternative Uses
Best Use
Multifamily LT 5
$476.3K
$416.8K – $555.7K
NOI $33,340 @ 7.0% cap · market cap 4.94%
Second Best
Apartment 5plus
$439.4K
$384.5K – $512.7K
NOI $30,759 @ 7.0% cap · market cap 4.56%
Theoretical Best
Office A
$1.01M
$887.9K – $1.18M
NOI $71,028 @ 7.0% cap · market cap 10.52%
Zoning and permitted uses should be independently verified with authorities.
Property Analytics
Property Profile
Location Intelligence
Current Use






Frequently Asked Questions
What type of property is this?
Quadplex - Well-maintained quadplex with four fully rented units generating steady rental operations.
Where is this quadplex located?
The property is located at 551-553 NE 133rd St North Miami, FL.
What is the asking price?
The asking price for this property is $675,000.
What are key features of this property?
This property features: Block construction with 1948 build year; Four fully rented units generating consistent monthly cash flow; Zoned electric heating and zoned electric cooling


