Rural Waterfront Land with
For Sale
$520,000
475 FISHER Road, Ocklawaha, FL 32179
Land, OCKLAWAHA, FL
Property Size1,800 SF
Lot Size39.31 Acres
Price / SF$288.89
Days on Market551
Property Features for 475 FISHER Road
General Information
Property type
Land
Property subtype
Other
Zoning
A1
Directions
Head south on Maricamp, Turn left onto SE 114th St Rd, Turn left onto SE Hwy 464C, Turn right onto SE 113th St, Turn right onto Fisher Rd, destination will be on the left
Subdivision
32179 - Ocklawaha
Standard status
Active
APN
39740-003-07
Lot size
39.31 Acres
Taxes and HOA fees
Tax Year
2024
Tax Description
SEC 36 TWP 16 RGE 24 TRACT 7: BEING MORE PARTICULARLY DESC AS: COM AT THE SW COR OF SEC 36 TH S 89-46-55 E 960.86 FT TH CONT S 89-46-55 E 2520.03 FT TH N 35-33-23 W 956.11 FT TO THE POC OF A CURVE CONCAVE NELY HAVING A RADIUS OF 1761.08 FT A CENTRAL ANGLE OF 11-54-11 TH NWLY ALONG ARC OF CURVE 365.86 FT THRU A CHORD BEARING & DISTANCE OF N 29-36-18 W 365.20 FT TH N 23-39-12 W 1018.26 FT TO THE POB TH CONT N 23-39-12 W 389.07 FT TH S 77-08-21 W 2571.15 FT TO A PT BEING ON A CURVE CONCAVE NELY HAV ING A RADIUS OF 700 FT A CENTRAL ANGLE OF 27-00-39 TH SELY ALONG CURVE AN ARC DISTANCE OF 330 FT THRU A CHORD BEARING & DISTANCE OF S 35-57-09 E 326.95 FT TH N 78-59-35 E 2517.09 FT TO THE POB & TRACT 8: BEING MORE PARTICULALRY DESCR AS: COM AT
Tax Annual Amount
661
Legal Description
SEC 36 TWP 16 RGE 24 TRACT 7: BEING MORE PARTICULARLY DESC AS: COM AT THE SW COR OF SEC 36 TH S 89-46-55 E 960.86 FT TH CONT S 89-46-55 E 2520.03 FT TH N 35-33-23 W 956.11 FT TO THE POC OF A CURVE CONCAVE NELY HAVING A RADIUS OF 1761.08 FT A CENTRAL ANGLE OF 11-54-11 TH NWLY ALONG ARC OF CURVE 365.86 FT THRU A CHORD BEARING & DISTANCE OF N 29-36-18 W 365.20 FT TH N 23-39-12 W 1018.26 FT TO THE POB TH CONT N 23-39-12 W 389.07 FT TH S 77-08-21 W 2571.15 FT TO A PT BEING ON A CURVE CONCAVE NELY HAV ING A RADIUS OF 700 FT A CENTRAL ANGLE OF 27-00-39 TH SELY ALONG CURVE AN ARC DISTANCE OF 330 FT THRU A CHORD BEARING & DISTANCE OF S 35-57-09 E 326.95 FT TH N 78-59-35 E 2517.09 FT TO THE POB & TRACT 8: BEING MORE PARTICULALRY DESCR AS: COM AT
Utilities
Utilities
Electricity Available
Sewer type
Septic Tank
Water source
Well
Listing Agency:
DEACON AND SOLDIER PROPERTIES
(352) 502-2230
Listed By:
Rasha Elmallah · License #3338711
(832) 455-9090
Added: Apr 14, 2025
Changed: Oct 16
Last Checked: Oct 16 at 9:06PM
MLS# OM699363
Copyright © 2026 Stellar MLS. All rights reserved. All information provided by the listing agent/broker is deemed reliable but is not guaranteed and should be independently verified.

Ask AI about this property
Review the available facts, identify missing information and prepare questions for the agent.
Investment Insights
Based on property information with market context.
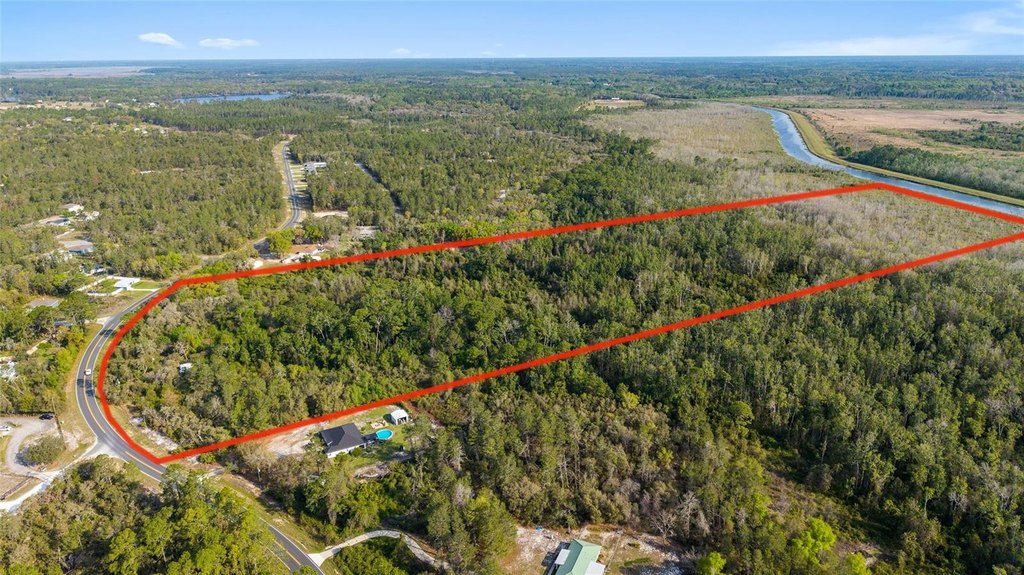
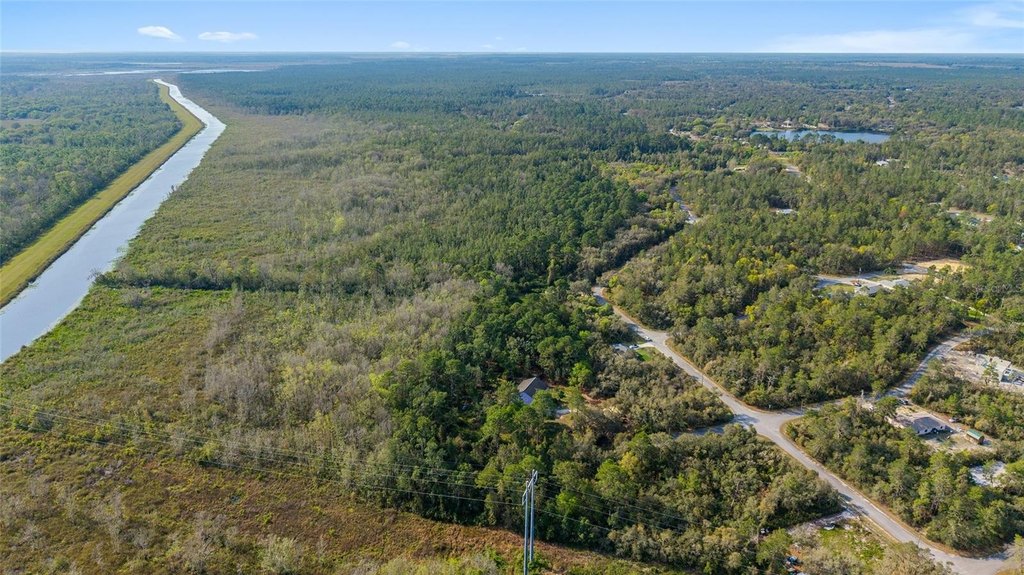
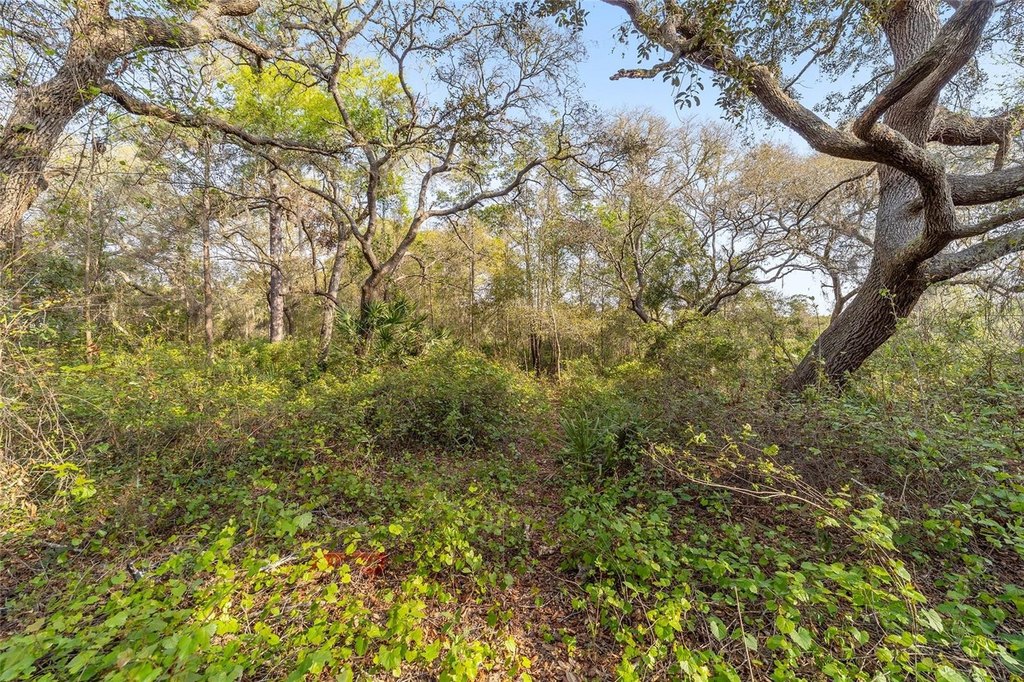
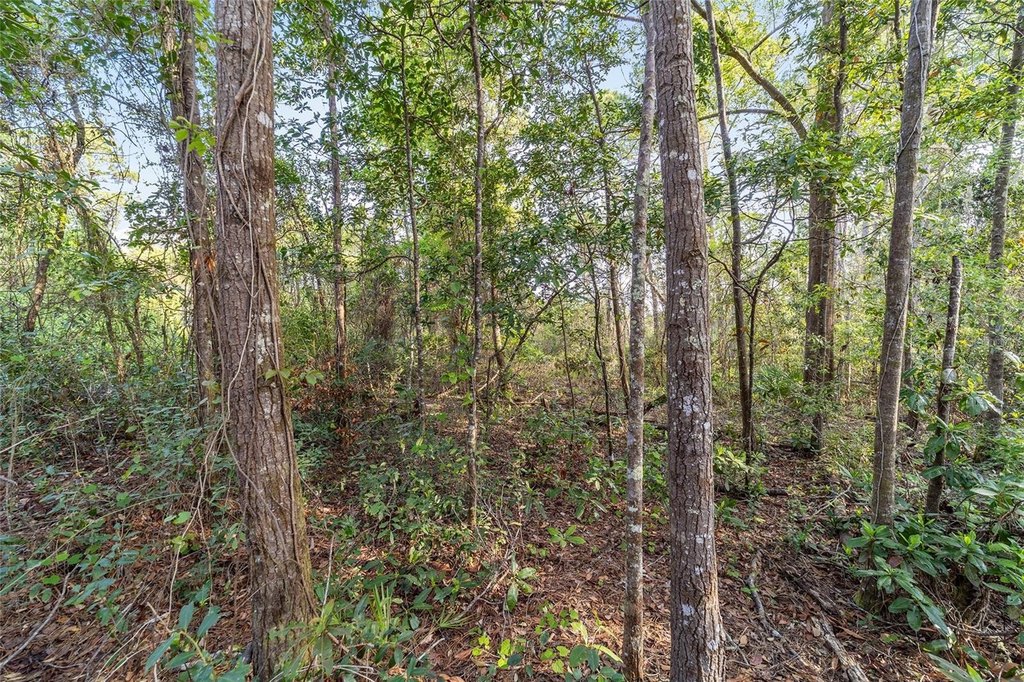
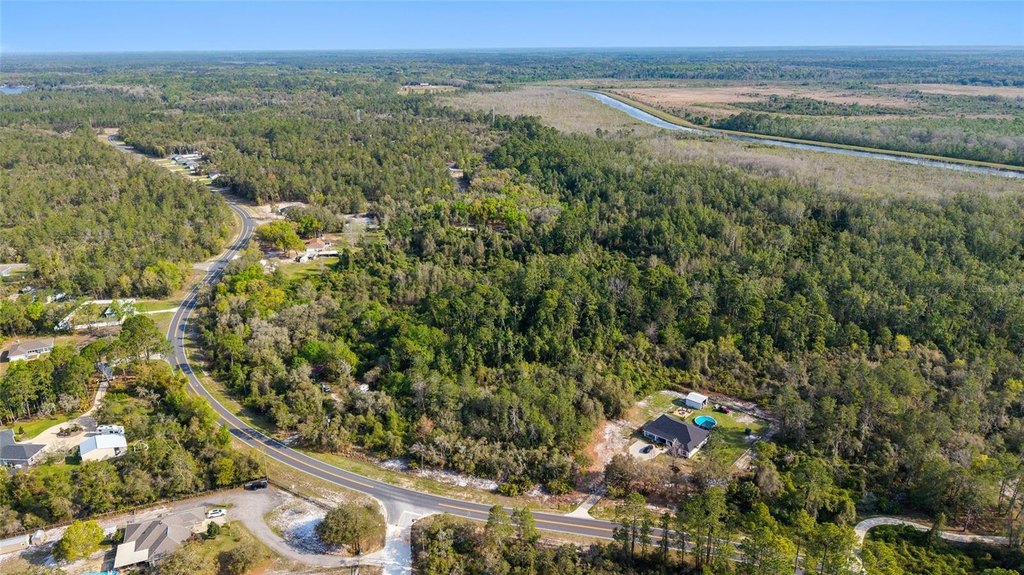
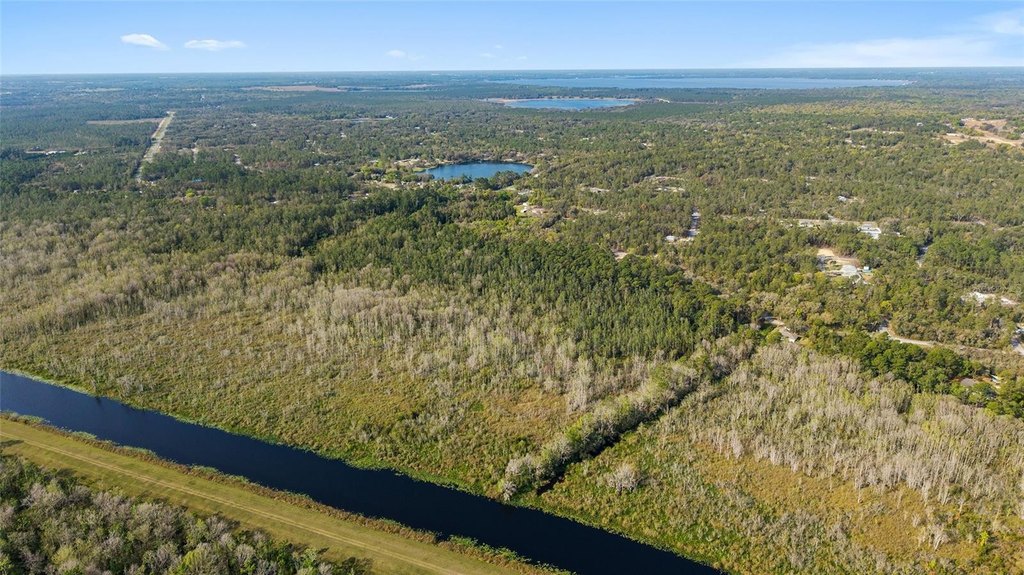
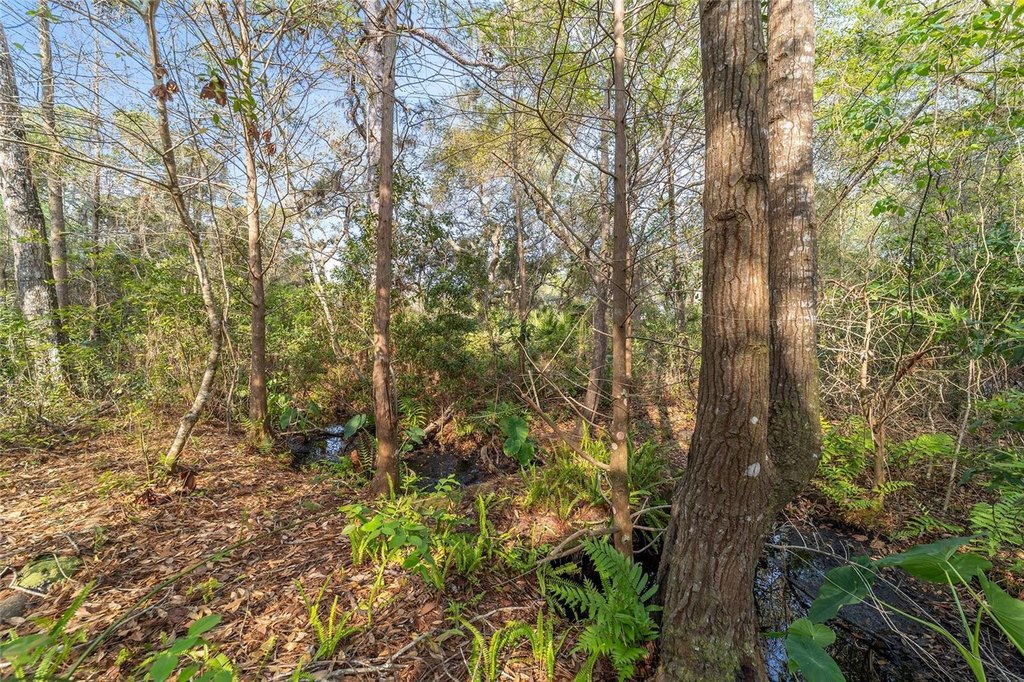
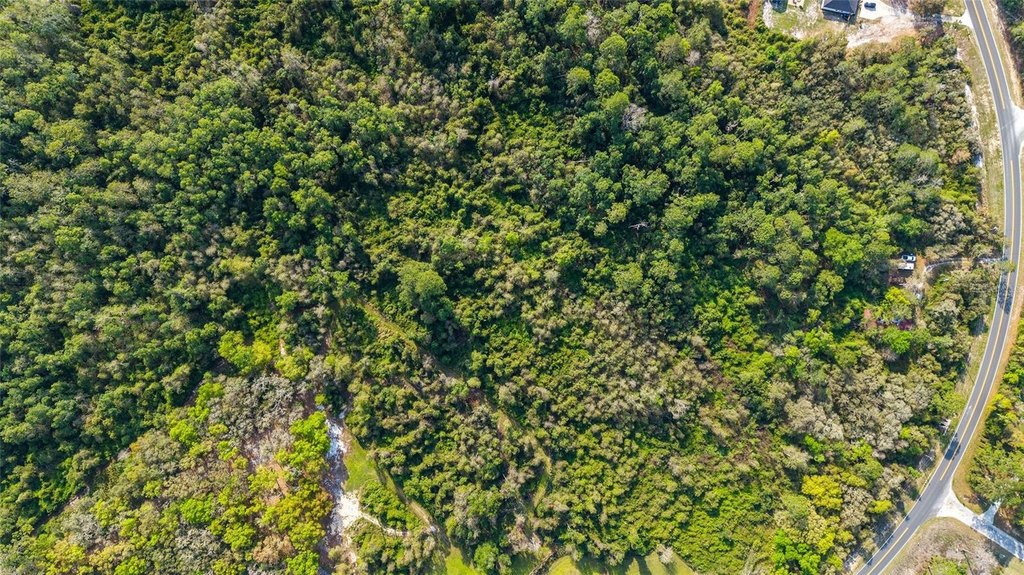
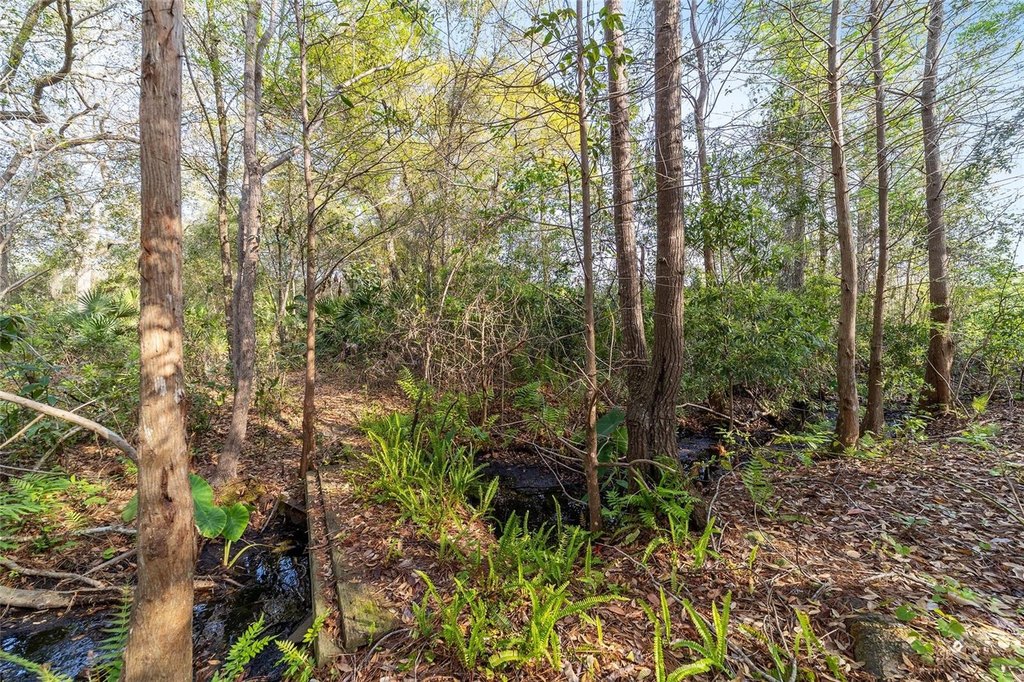
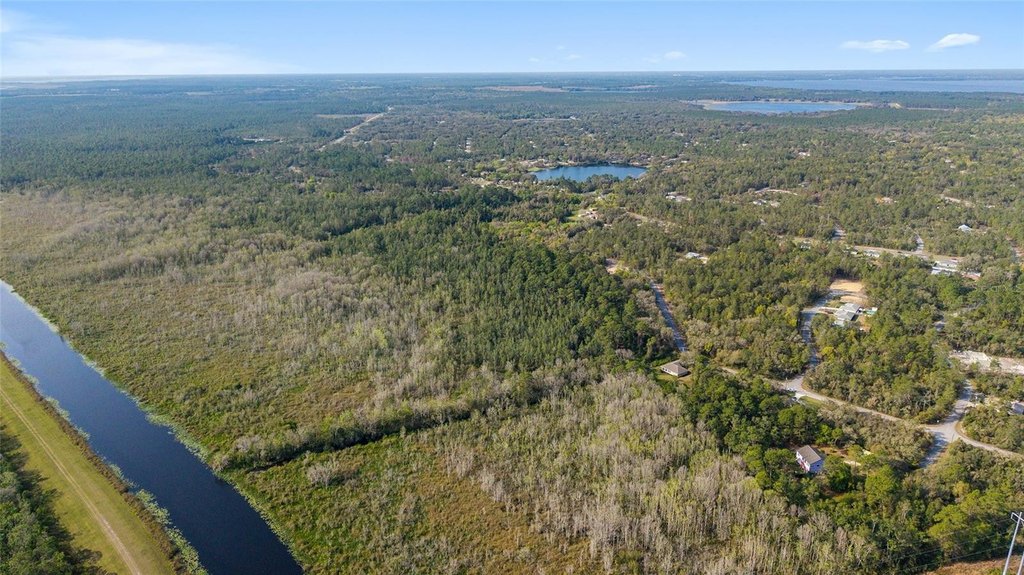
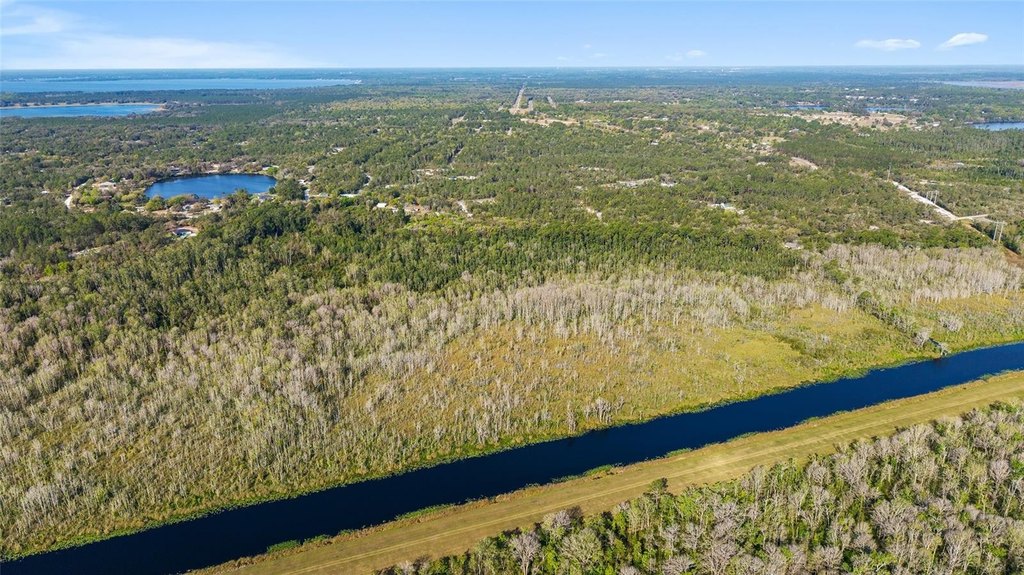
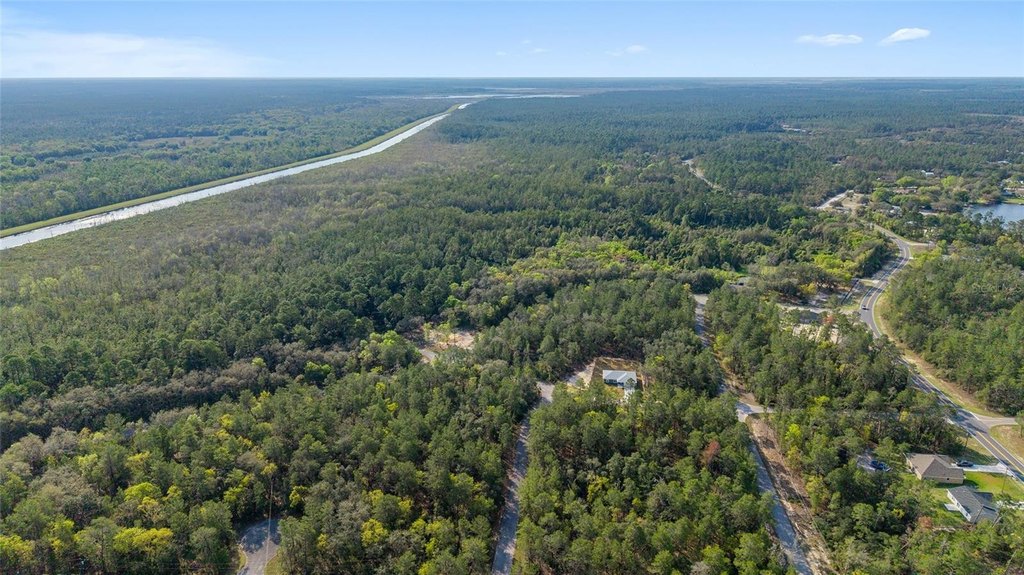
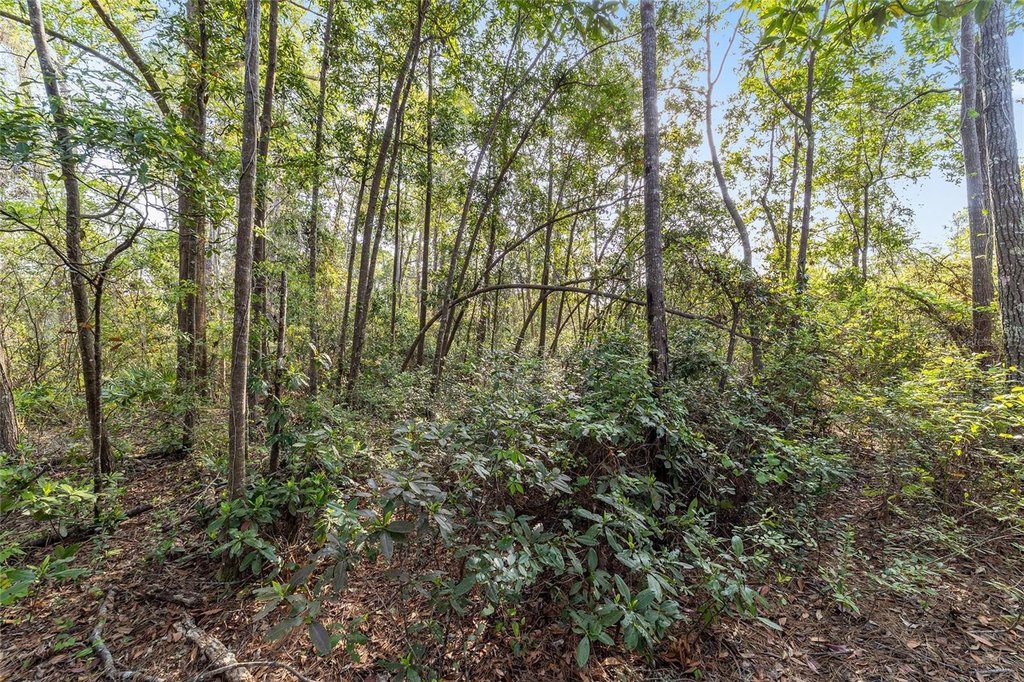
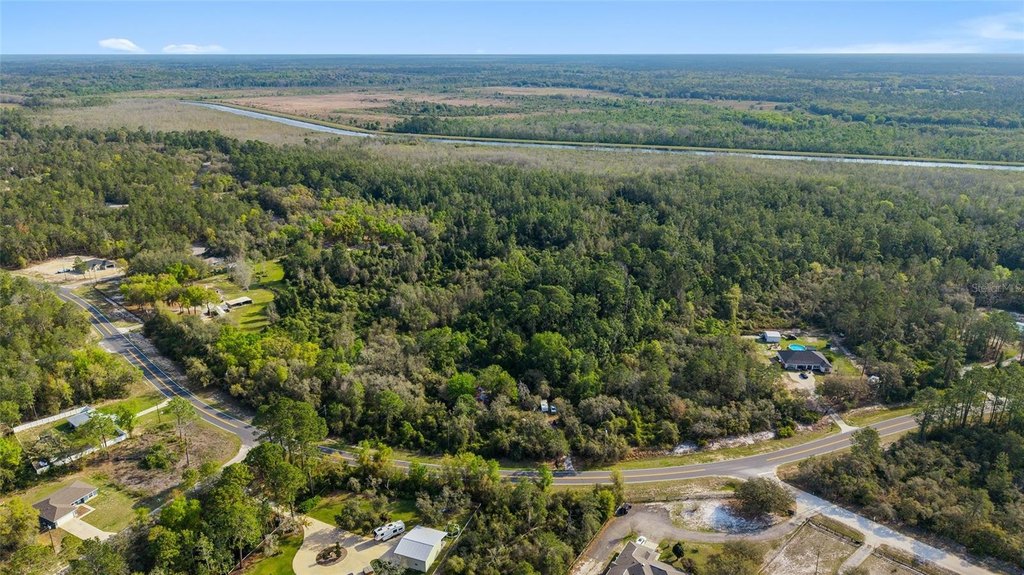
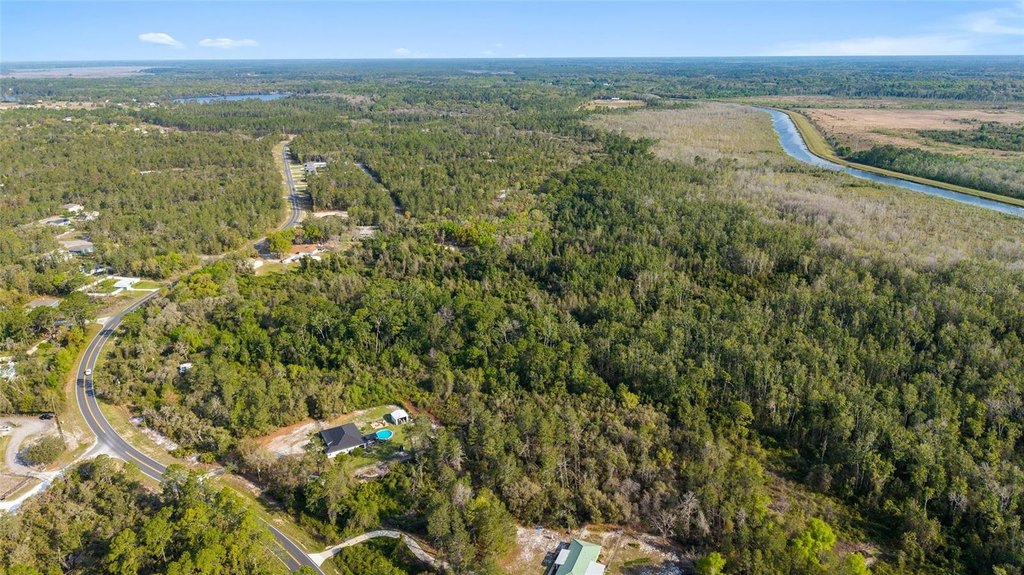
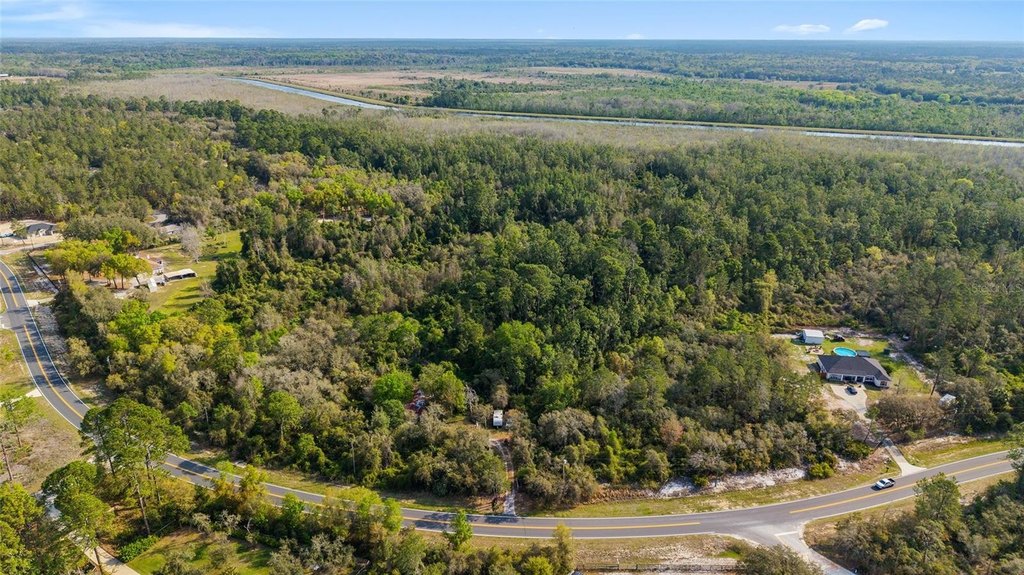
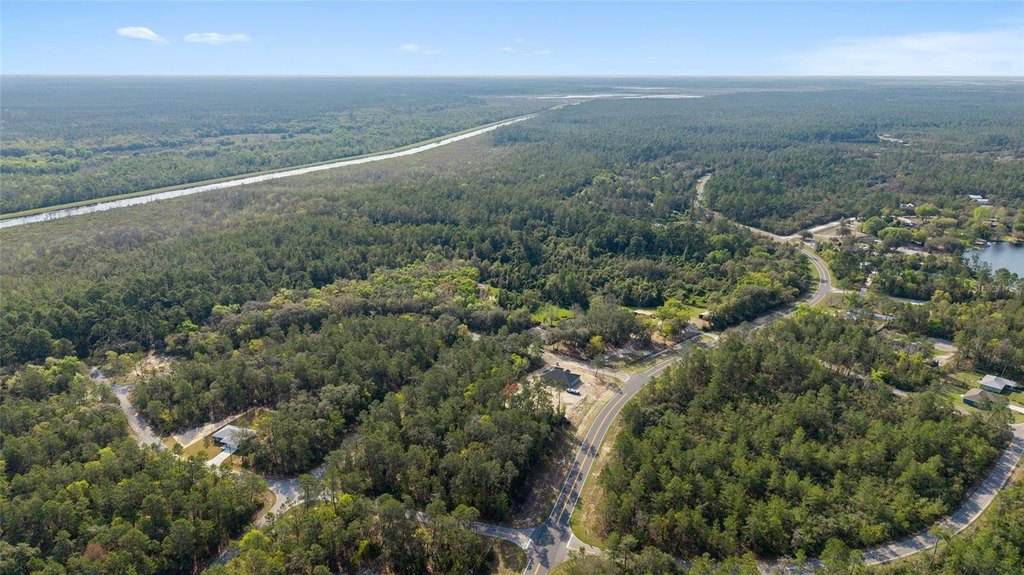
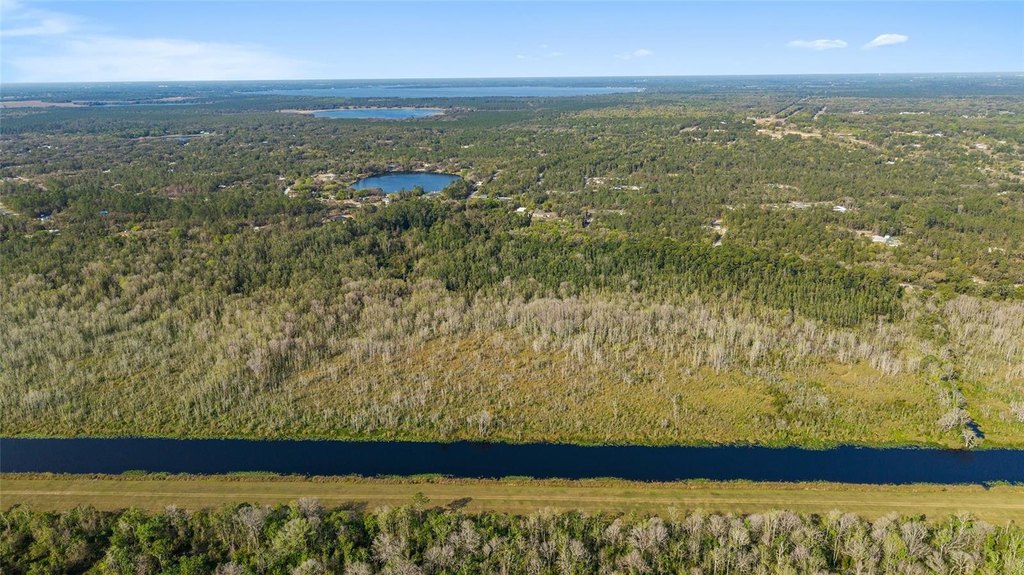
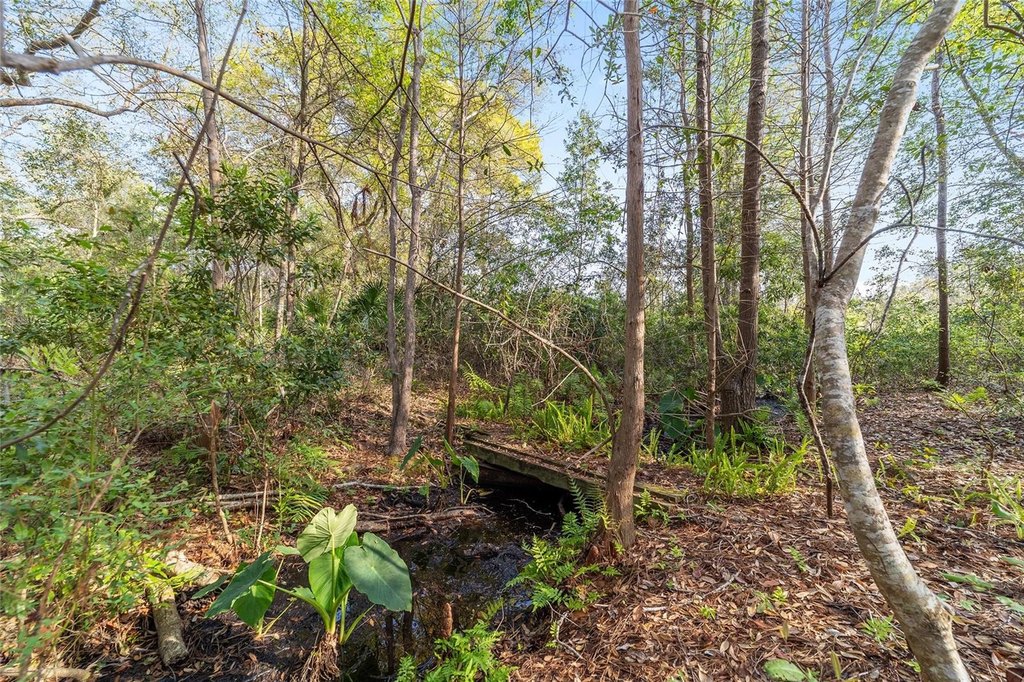
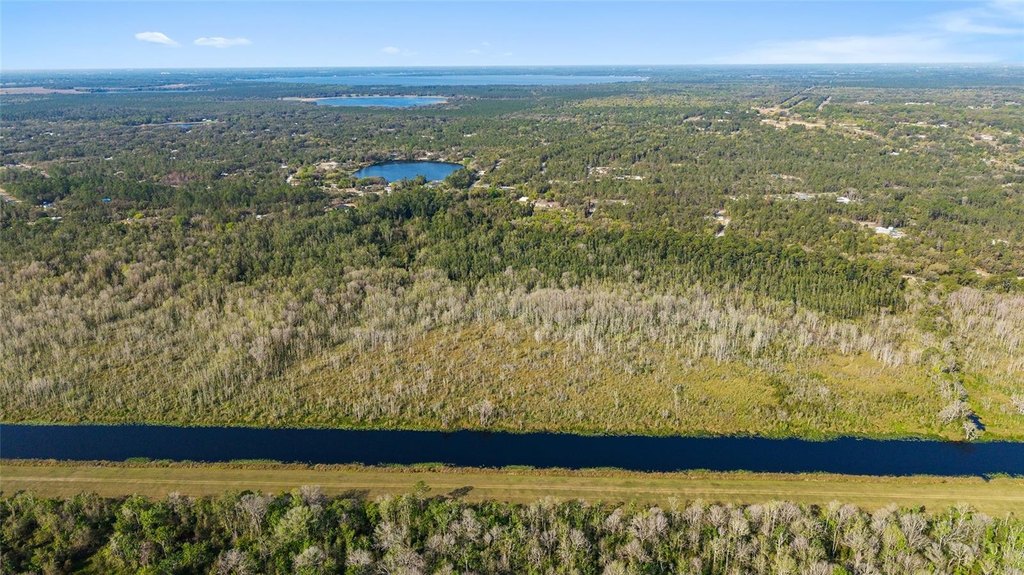
This A1-zoned property offers a rural setting on 39.31 acres with over 700 feet of Ocklawaha River frontage and legal access. A creek runs through the property, and the parcel includes nearly 1,800 SF of an existing manufactured home that would need extensive renovations.
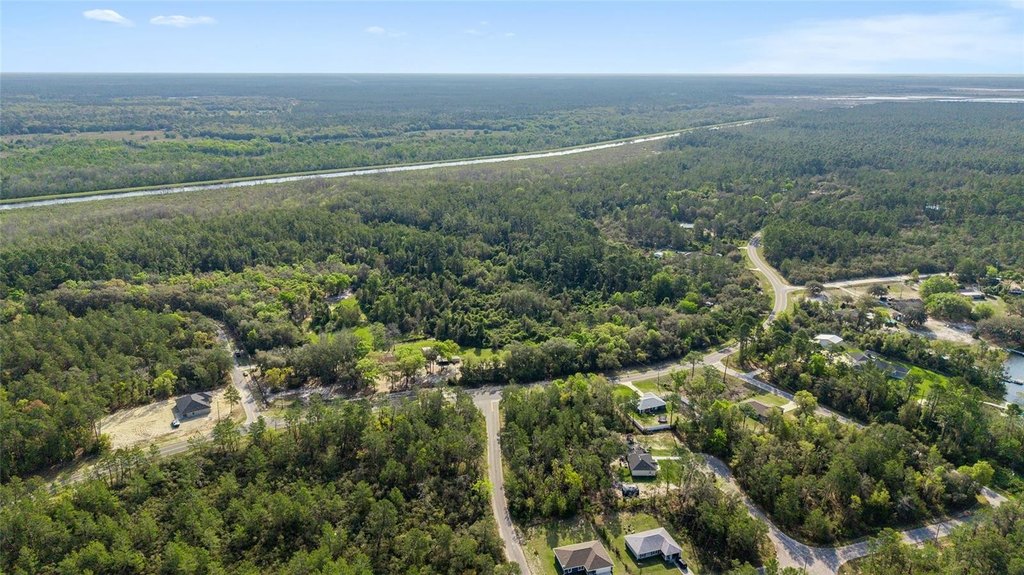
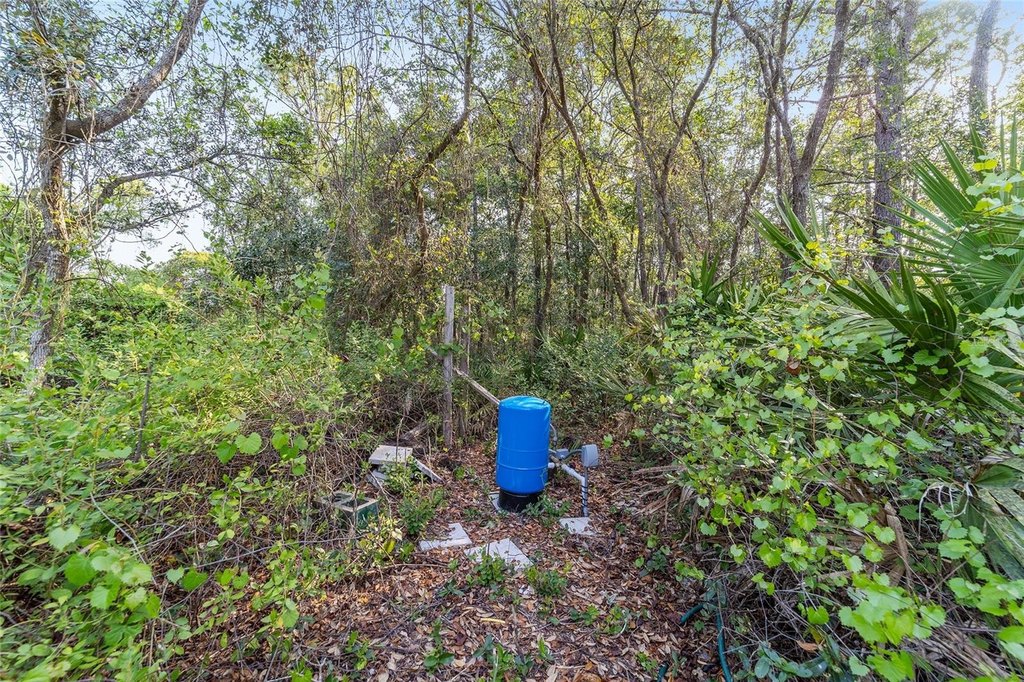
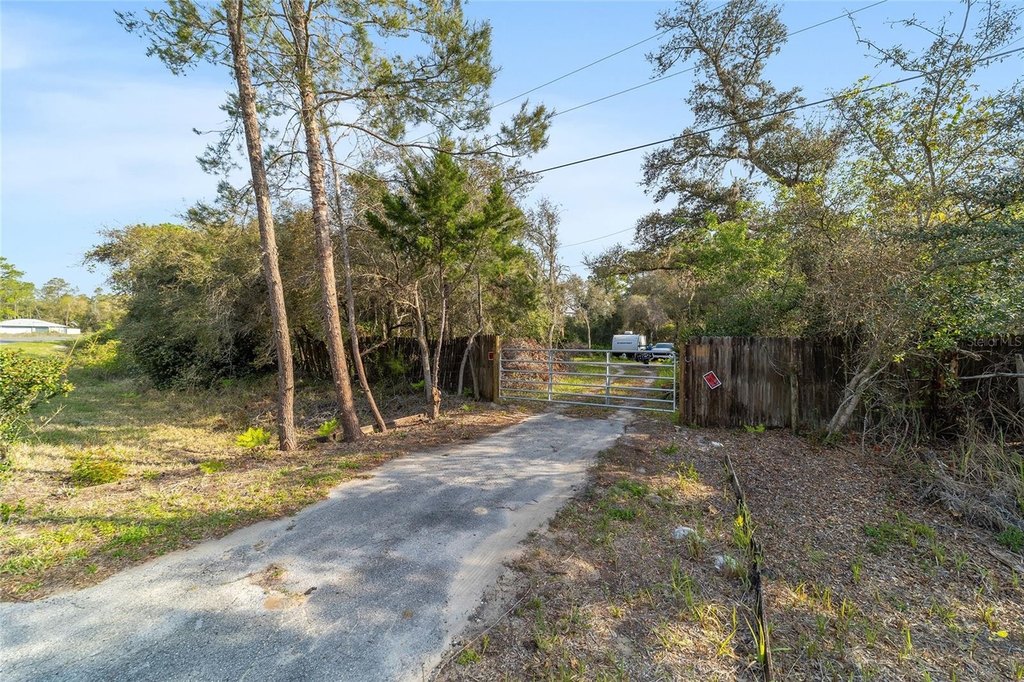
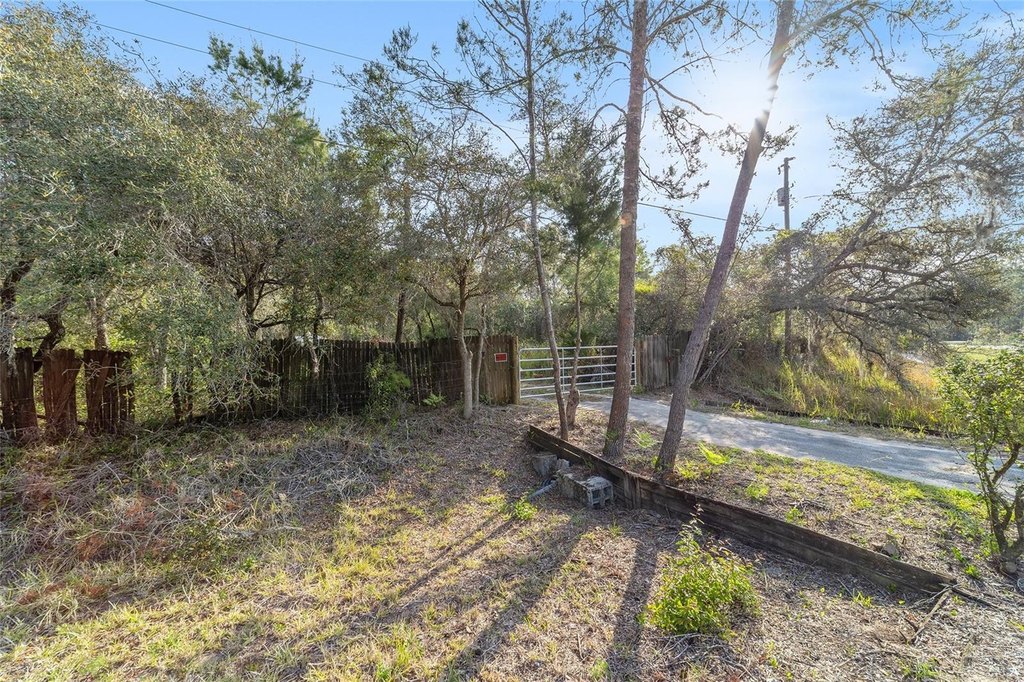
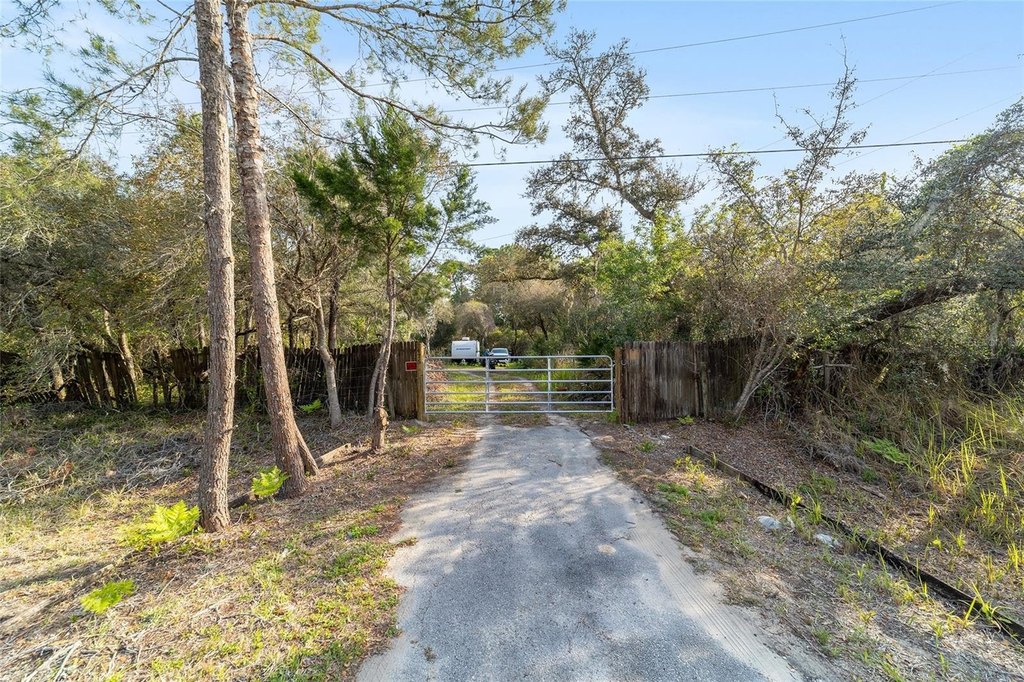
The property also features over 600 feet of newly paved road frontage and includes a septic system and well. Bear Lake is located directly across the street, and the property is described as being near Ocala National Forest and minutes from Lake Weir.
With its combination of waterfront and internal creek frontage, this property provides a large land base for continued development, landscaping, or a future build while retaining existing utilities already installed.
The property also features over 600 feet of newly paved road frontage and includes a septic system and well. Bear Lake is located directly across the street, and the property is described as being near Ocala National Forest and minutes from Lake Weir.
With its combination of waterfront and internal creek frontage, this property provides a large land base for continued development, landscaping, or a future build while retaining existing utilities already installed.
Key Highlights
- 39.31‑acre rural property with over 600' of newly paved road frontage and legal access.
- Over 700' of Ocklawaha River frontage.
- Utilities include electricity available; water is provided by a well and sewer is a septic tank.
Financial Insights
Estimated NOI and Cap Rate
NOI / Yr
$26,159
Cap Rate
5.03%
Suggested Prices Based on Cap Rates
Cap Rate 5%
$523,180
$523.2K
Cap Rate 7%
$373,700
$373.7K
Cap Rate 9%
$290,656
$290.7K
Market Conditions
NOI Build-Up for 1,800 SF
Gross rent
$50.8K $28.20/SF
− Vacancy
−$3.2K −$1.78/SF
EGI
$47.6K $26.42/SF
− OpEx
−$21.4K −$11.89/SF
NOI
$26.2K $14.53/SF
Area
Marion County, FL
Vacancy
6.30%
Lease Rate
$28.20 /SF/Yr
Expense Ratio
45.00%
Simulate Cap Rate and NOI
Suggested Prices Based on Cap Rates
Cap Rate 5%
$523,180
Cap Rate 7%
$373,700
Cap Rate 9%
$290,656
Alternative Uses
Best Use
Apartment 5plus
$373.7K
$327.0K – $436.0K
NOI $26,159 @ 7.0% cap · market cap 5.03%
Second Best
—
—
no second resolved use
Theoretical Best
Office A
$982.9K
$860.1K – $1.15M
NOI $68,806 @ 7.0% cap · market cap 13.23%
Zoning and permitted uses should be independently verified with authorities.
How Realmo checks its estimates
Property Analytics
Unlock full access to Insights
Subscribe to Realmo Intelligence
Open Analytics
Current Use
Lease Details
Yes
Paved road access
Location Intelligence
Trade Area within ½ mile
6
Businesses Nearby
Explore this area
Business Placement
Demographics for 32179, FL
9,075
Population
5,204
Households
1.7
Avg Household Size
50
Median Age
13%
College-Educated
84%
High-School Grad
75.1 sq mi
ZIP Area
121
Density / Sq Mi
$48,214
Median Household Income
$31,453
Median Earnings
$1,075
Median Rent
$162,700
Median Home Value
Check the figures for this property
Cap Rate, Value Estimation, Potential NOI and more
View Realmo Analytics


Frequently Asked Questions
What type of property is this?
Waterfront Land - Rural A1-zoned land with over 700 feet of Ocklawaha River frontage, plus legal access and a creek running through.
Where is this waterfront land located?
The property is located at 475 FISHER Road Ocklawaha, FL.
What is the asking price?
The asking price for this property is $520,000.
What are key features of this property?
This property features: 39.31‑acre rural property with over 600' of newly paved road frontage and legal access.; Over 700' of Ocklawaha River frontage.; Utilities include electricity available; water is provided by a well and sewer is a septic tank.


