Wooded Hunting Acreage with
For Sale
$319,900
406 Horner Drive, Bradleyville, MO 65614
Land, Bradleyville, MO
Property Size1,376 SF
Lot Size83.00 Acres
Price / SF$232.49
Days on Market101
Property Features for 406 Horner Drive
General Information
Property type
Land
Property subtype
Other
Lot features
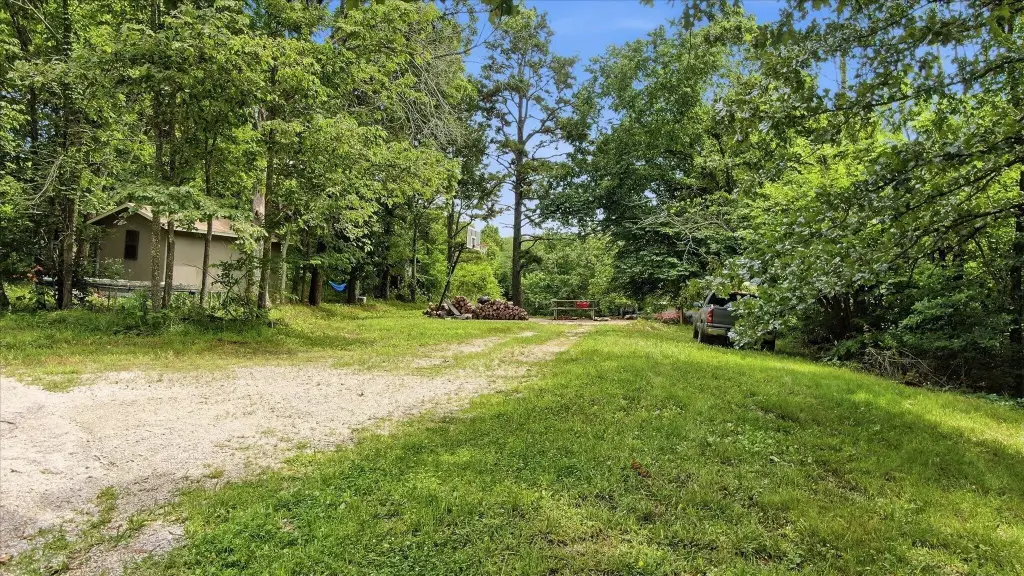
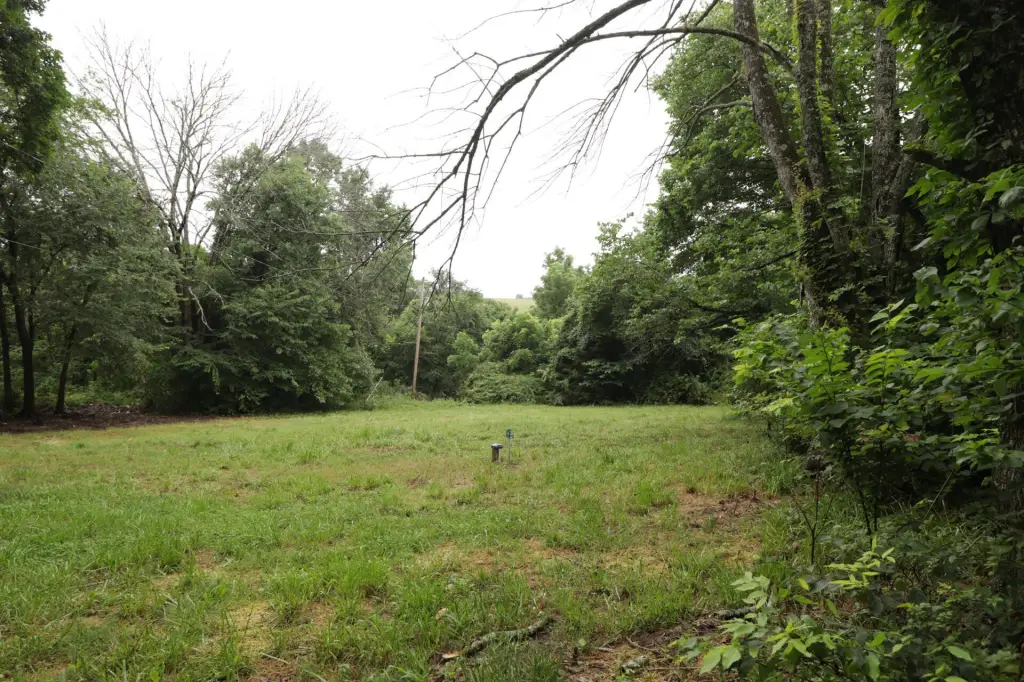
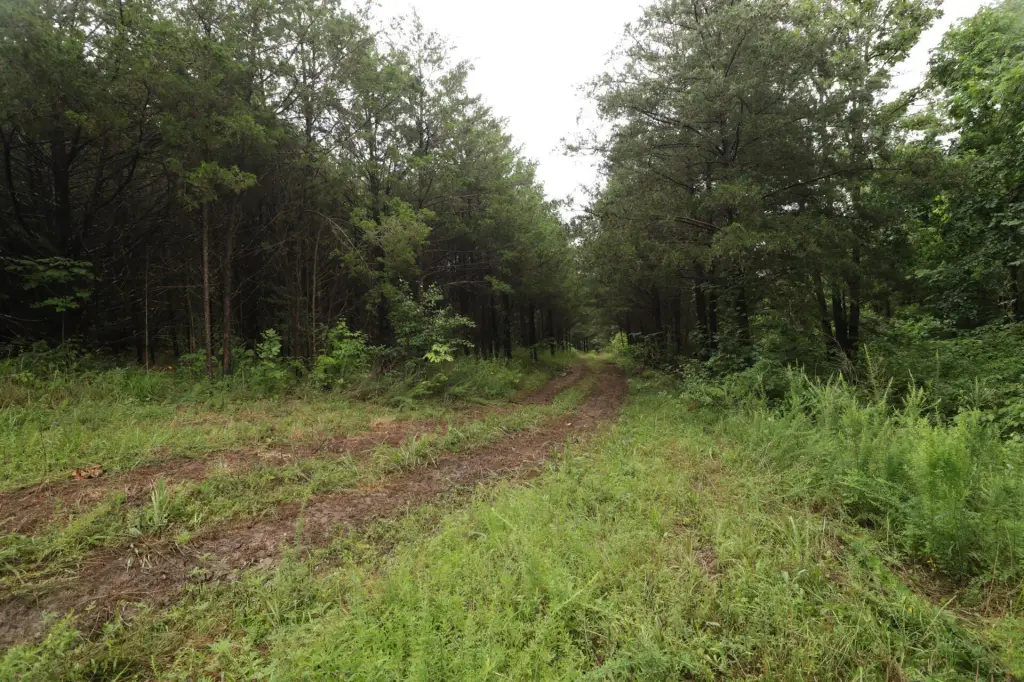
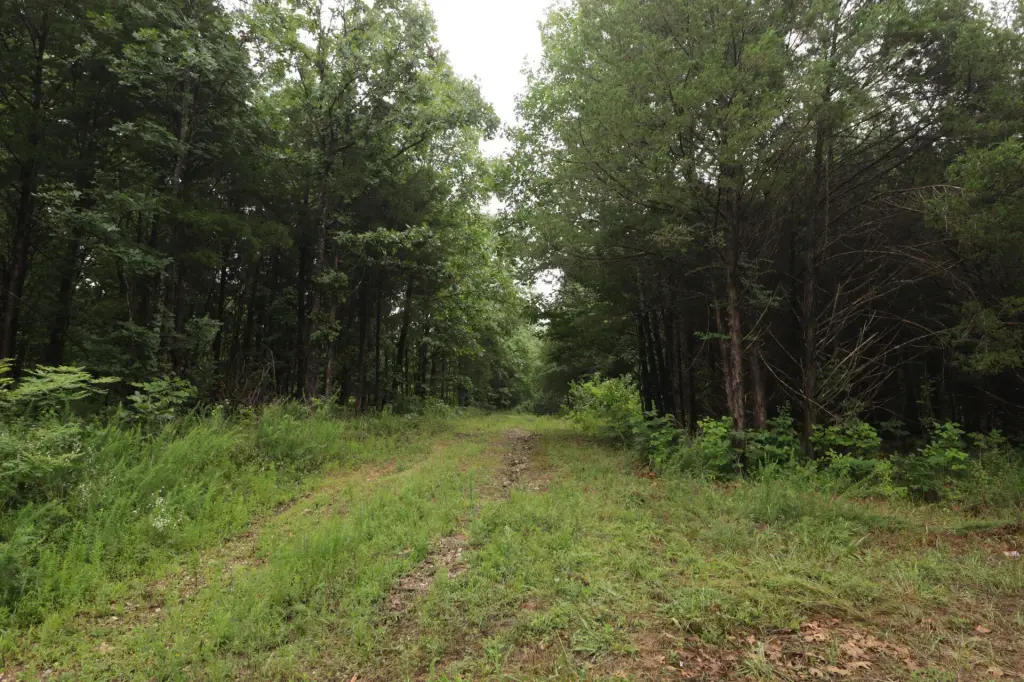
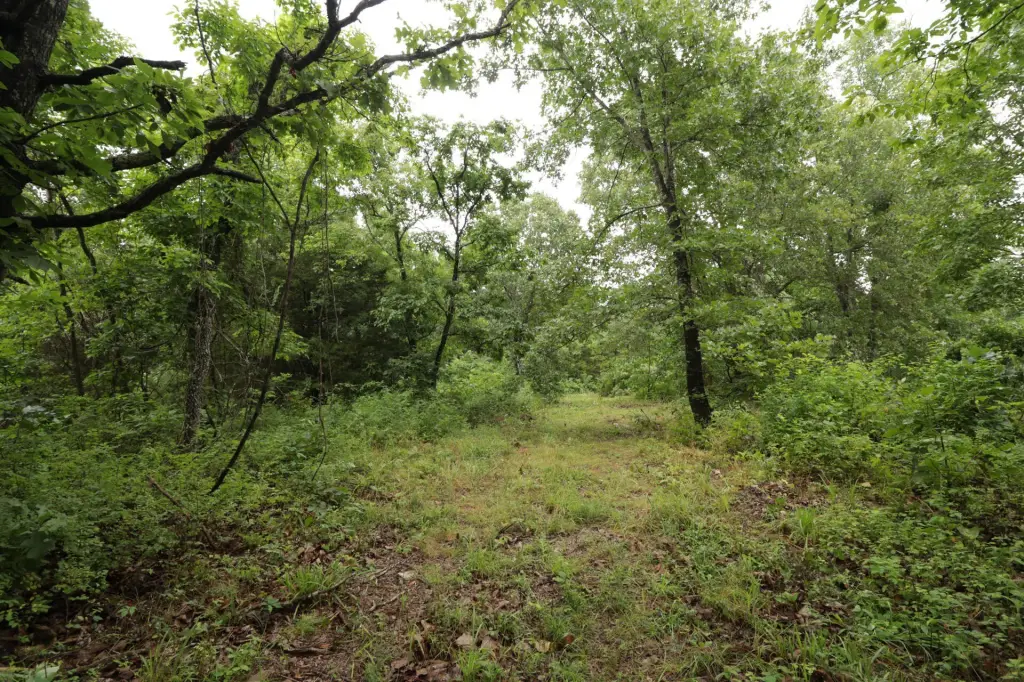
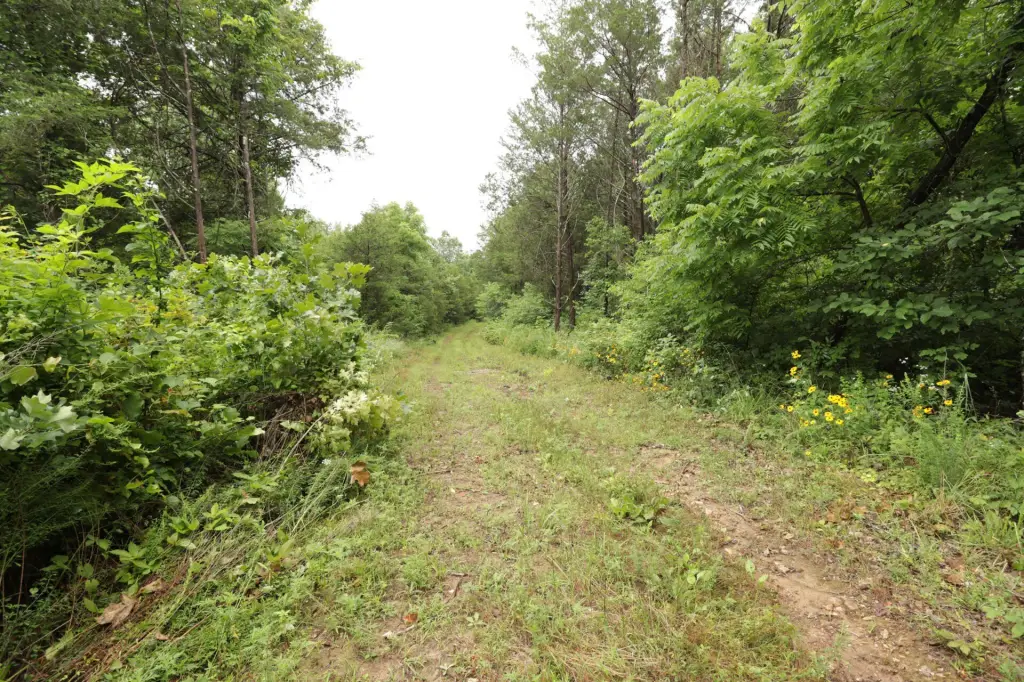
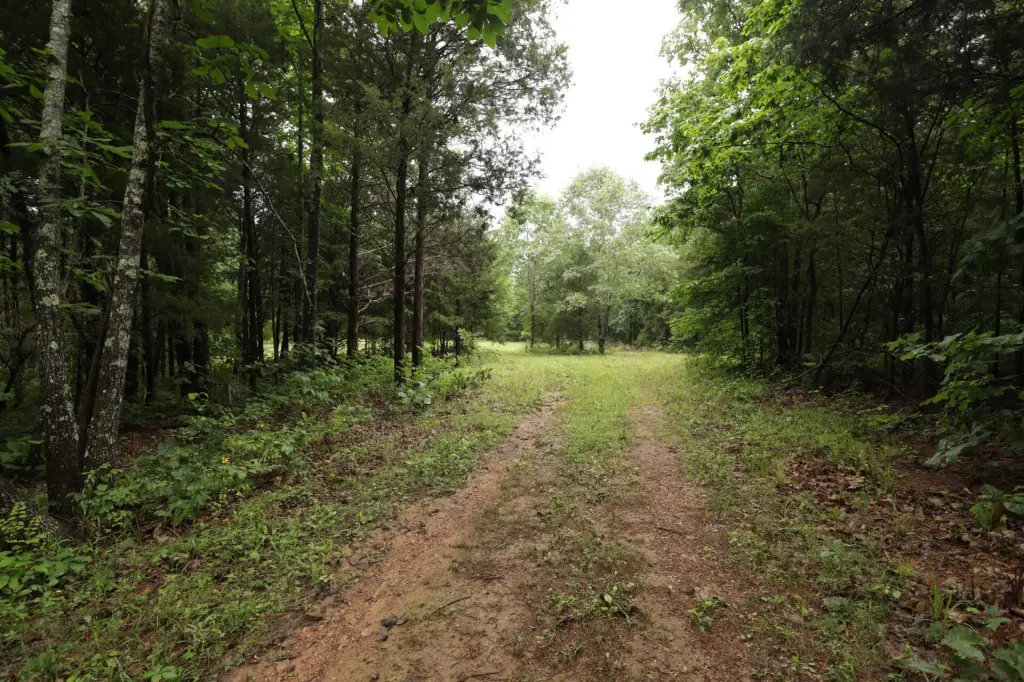
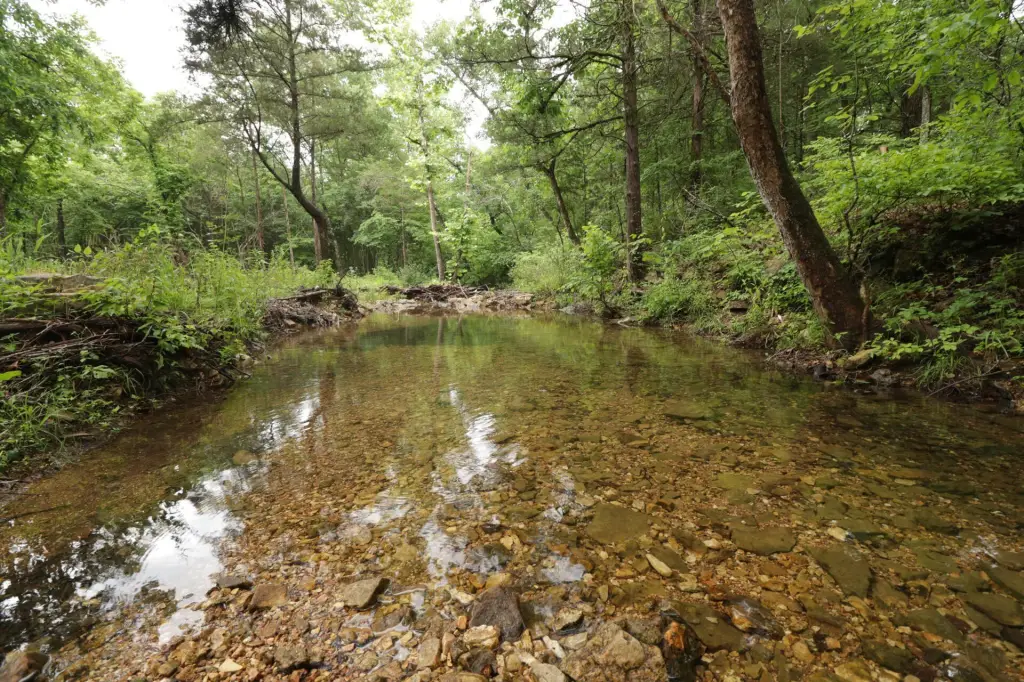
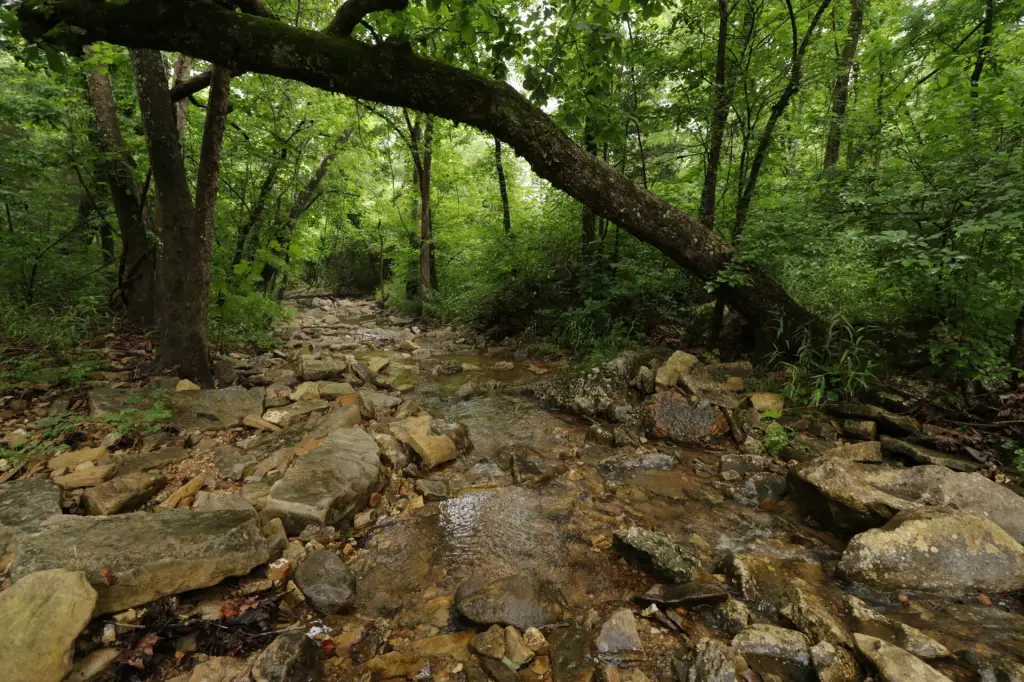
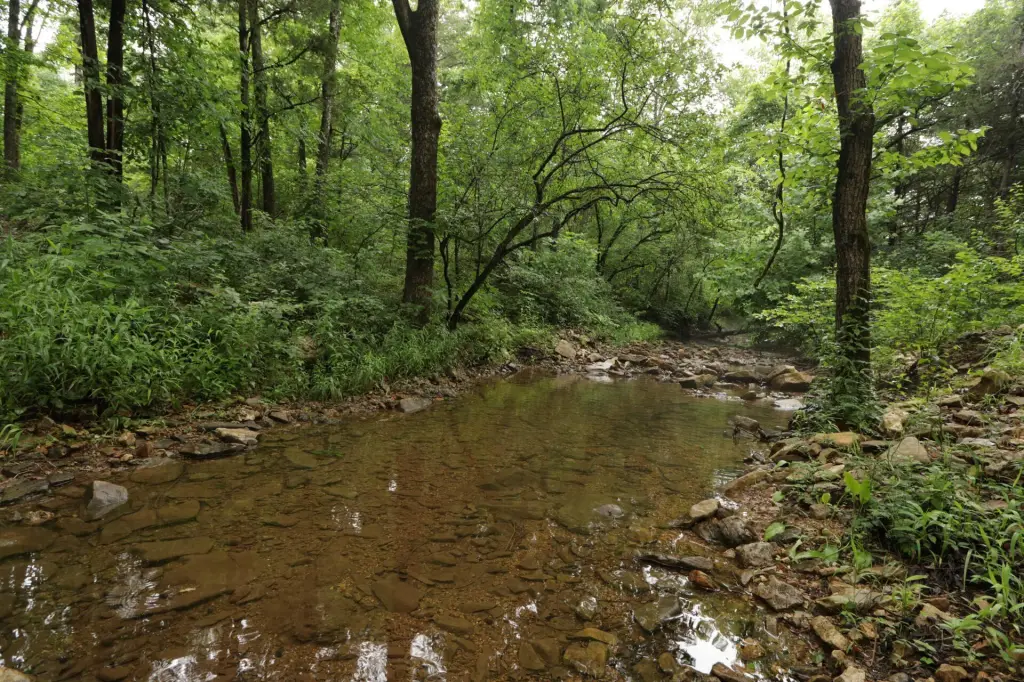
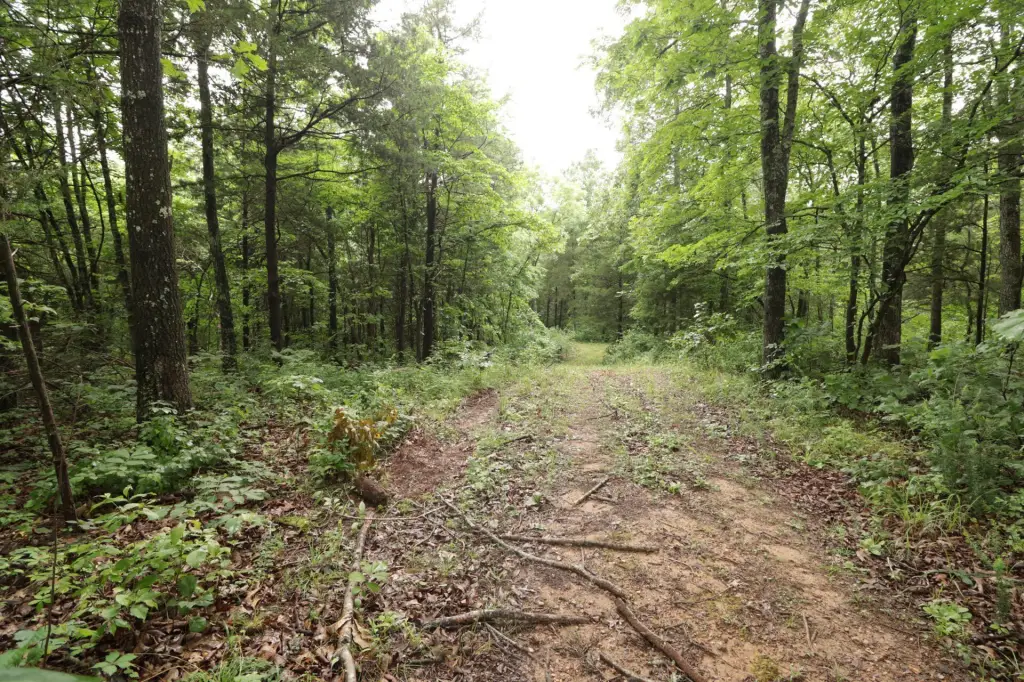
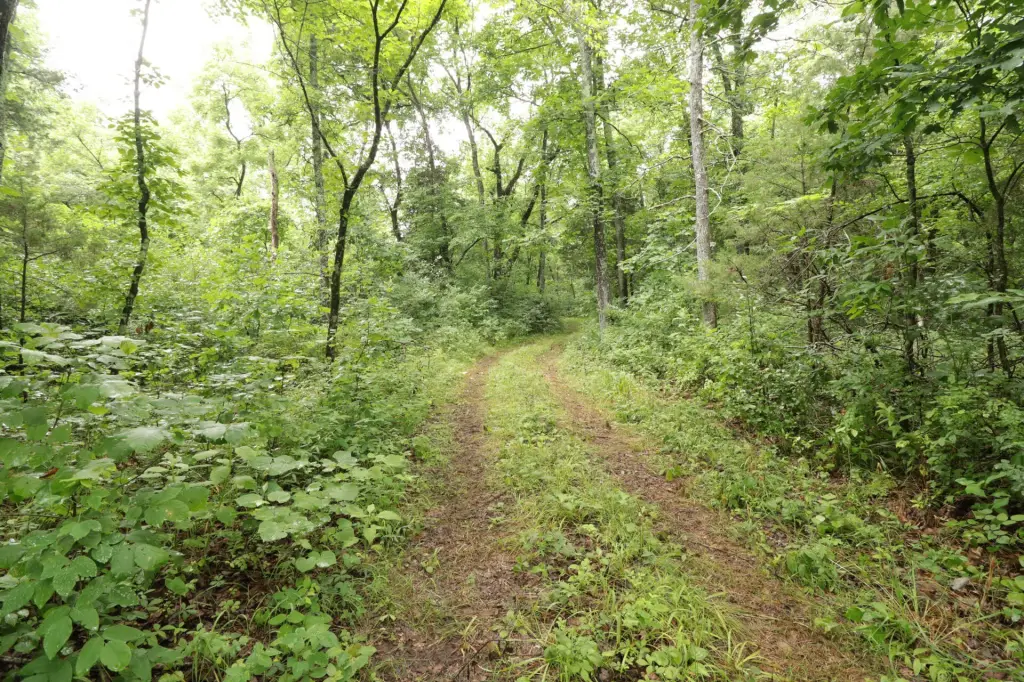
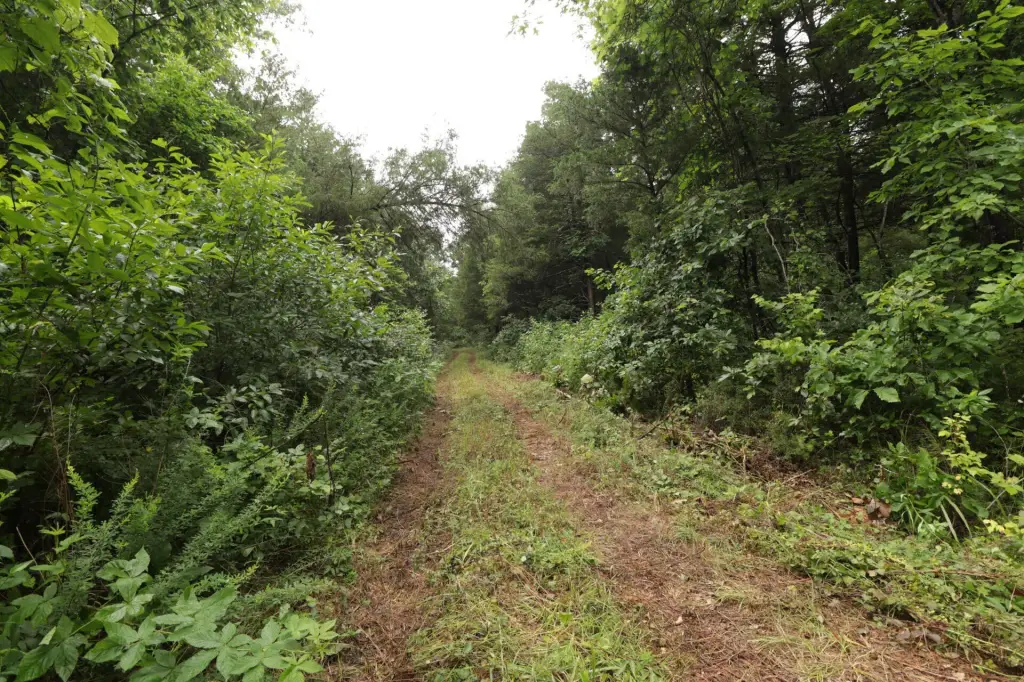
Acreage, Dead End Street, Secluded, Wet Weather Creek, Horses Allowed, Valley View, Few Trees, Mature Trees, Wooded, Adjoins National Forest, Adjoins Government Land
Elementary school
Bradleyville
Middle school
Bradleyville
High school
Bradleyville
Directions
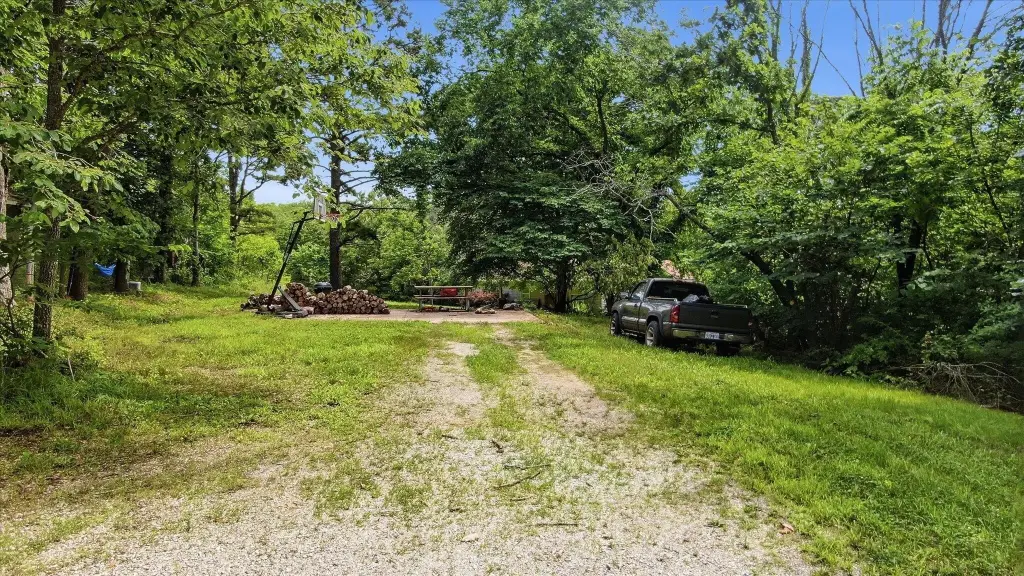
From Bradleyville High School, take hwy 125 North towards Sparta approximately 2.5 miles to Martin Rd. Turn right on Martin Rd & continue for approximately 1.25 miles to Horner Drive, turn left on Horner drive & continue until you reach the property at the end of the chip & seal road. Directional signs are in place & yard sign is at the property.
Standard status
Active
APN
240828000000004000
Lot size
83.00 Acres
Taxes and HOA fees
Tax Year
2025
Tax Description
N1/2 Sw1/4. Pt Sw1/4 Sw1/4
Tax Annual Amount
773
Legal Description
N1/2 Sw1/4. Pt Sw1/4 Sw1/4
Utilities
Utilities
Electricity Available
Listing Agency:
Sturdy Real Estate
(417) 881-3061
Listed By:
Dustin Tilley · License #2019013162
(417) 546-0061
Added: Jun 28
Changed: Sep 14
Last Checked: Oct 6 at 12:06PM
MLS# 60327603
Copyright © 2026 Southern Missouri Regional MLS, LLC (SOMO). All rights reserved. All information provided by the listing agent/broker is deemed reliable but is not guaranteed and should be independently verified.
Investment Insights
Based on property information with market context.
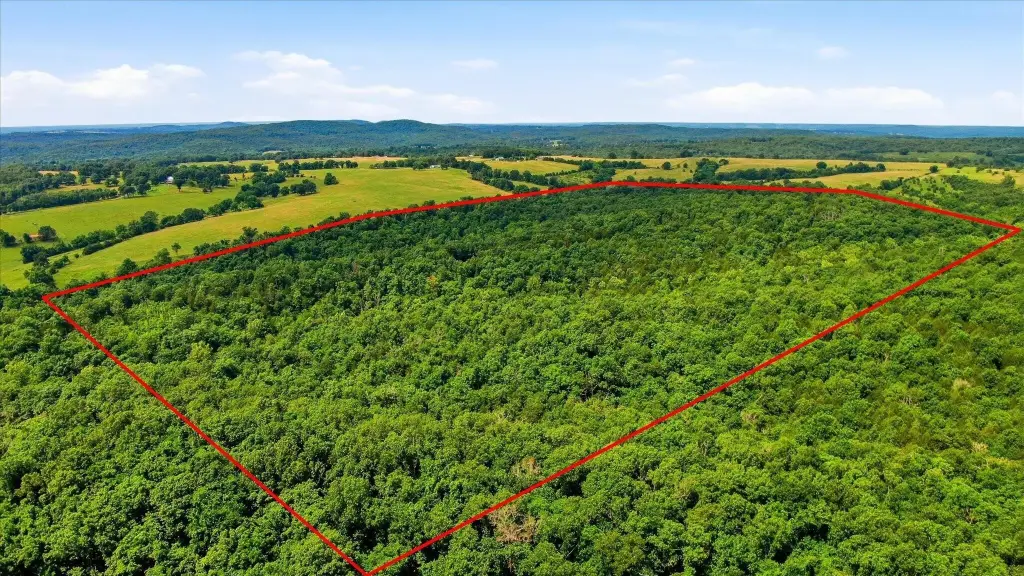
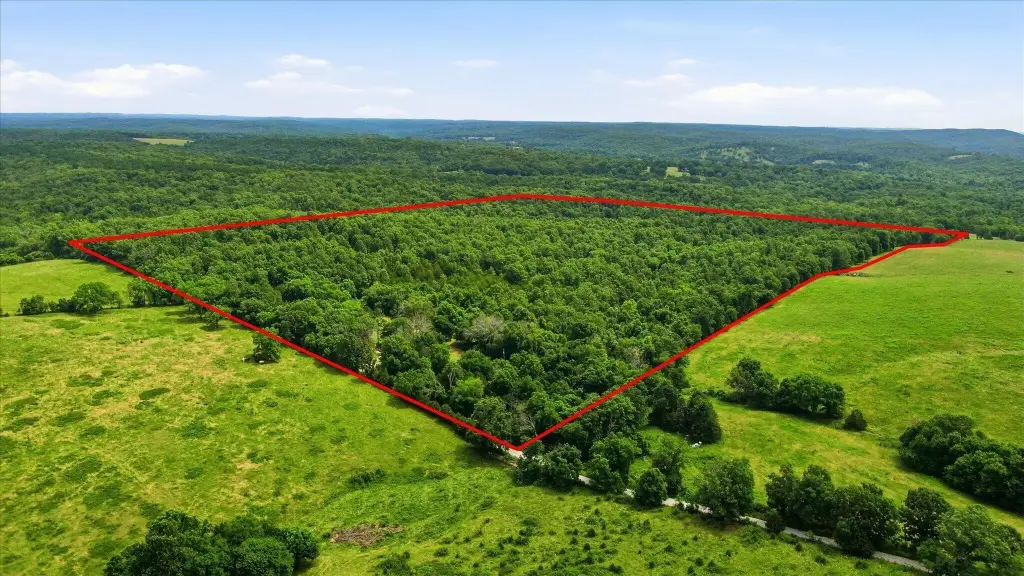
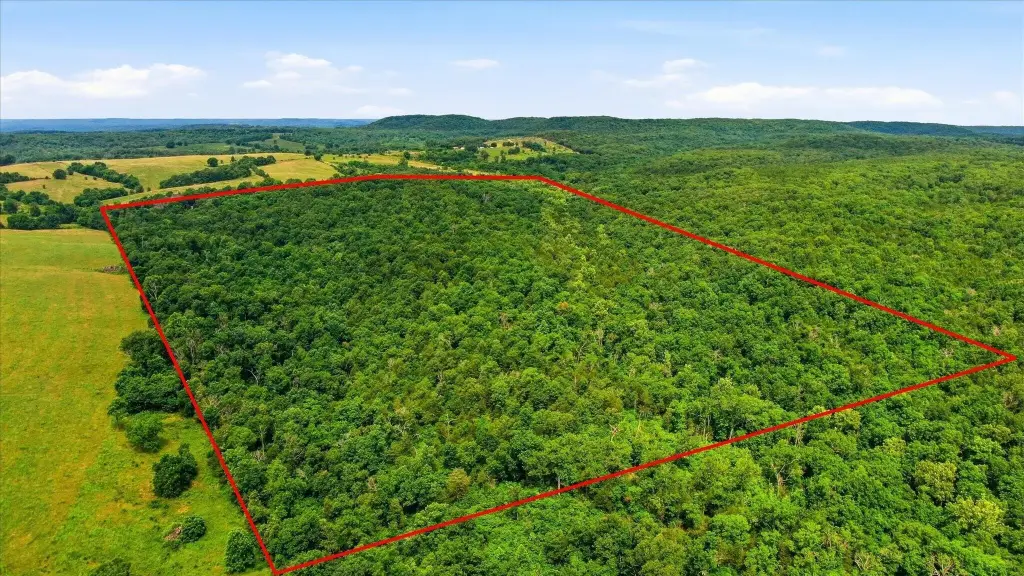
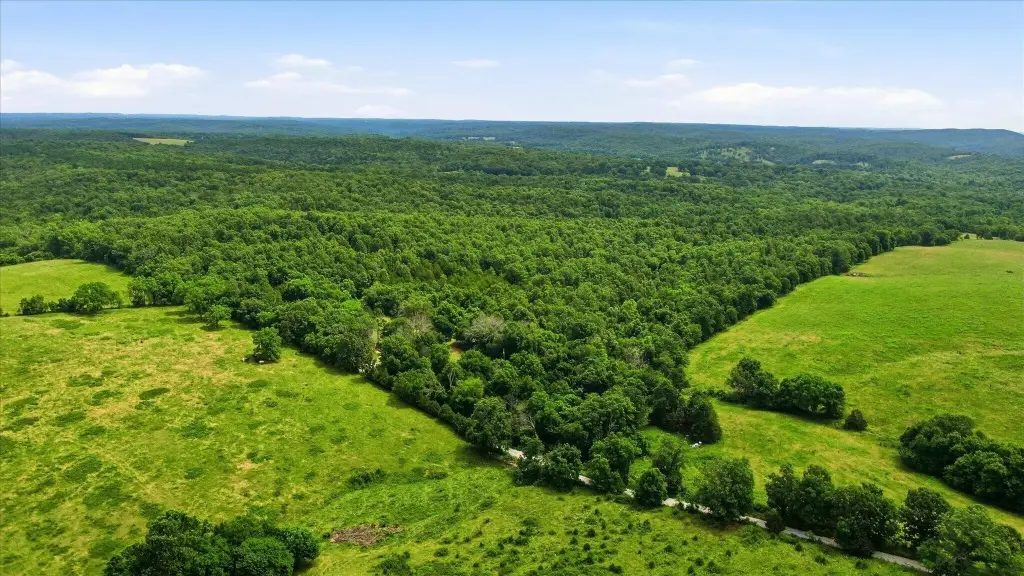
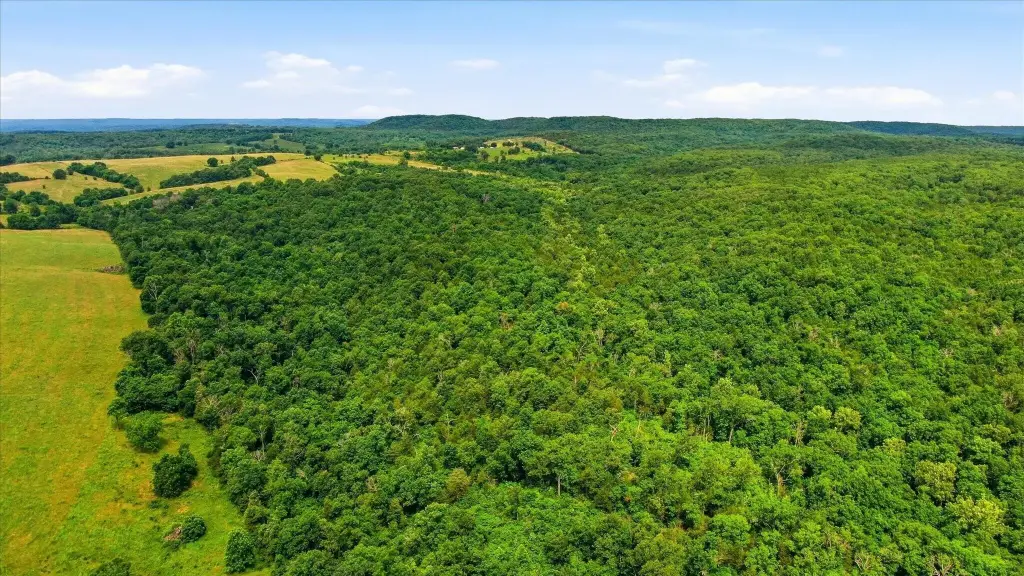
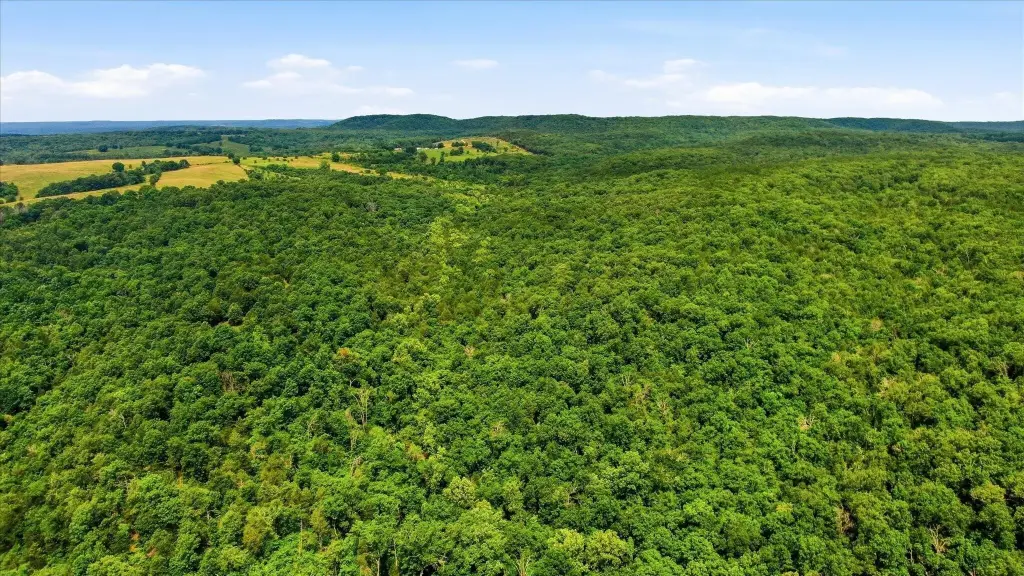
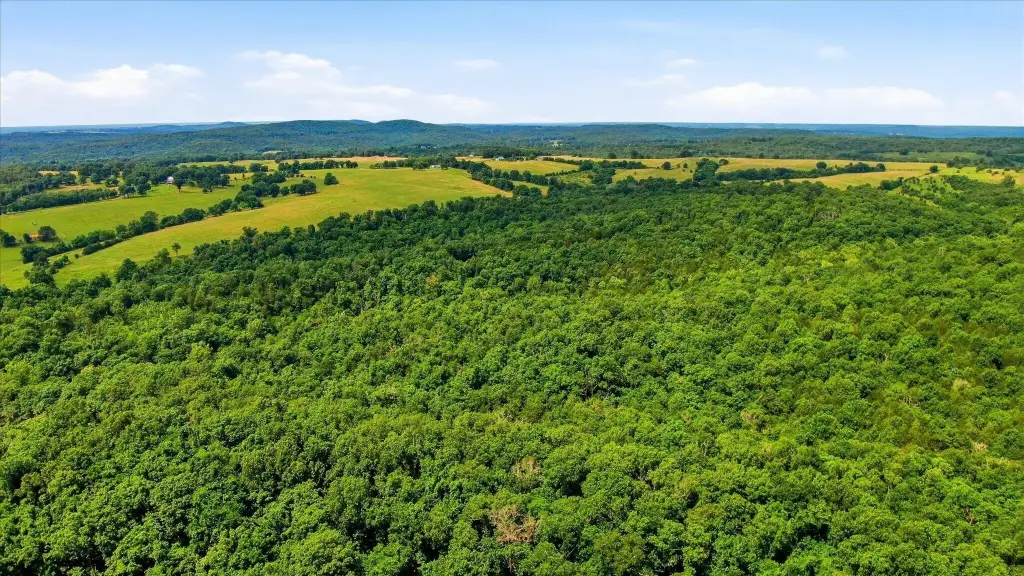
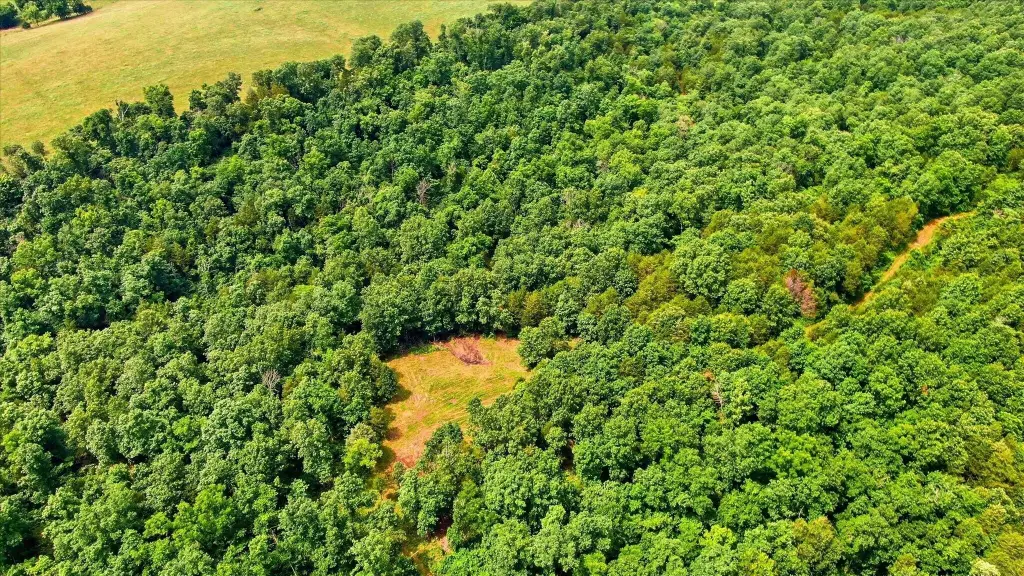
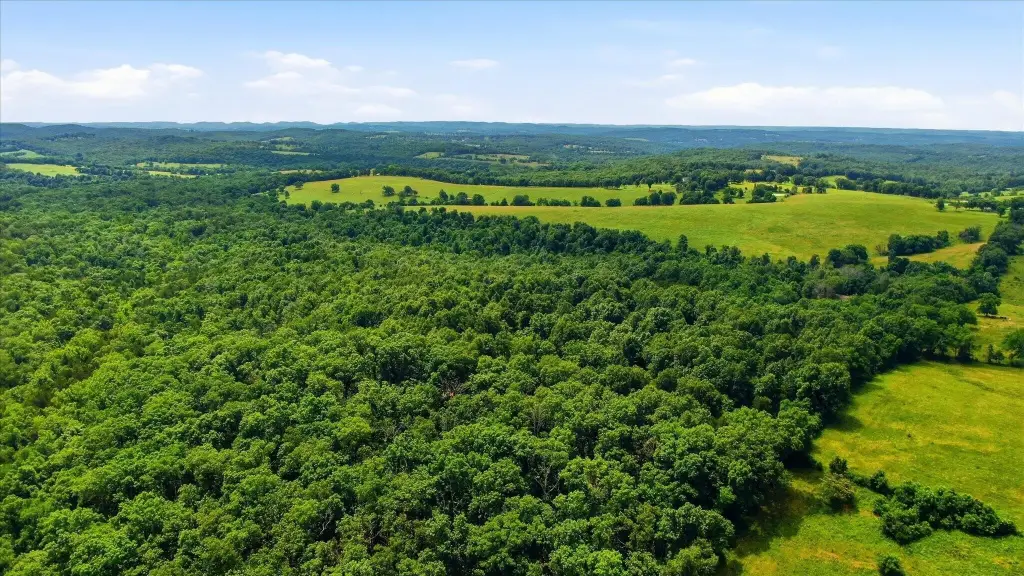
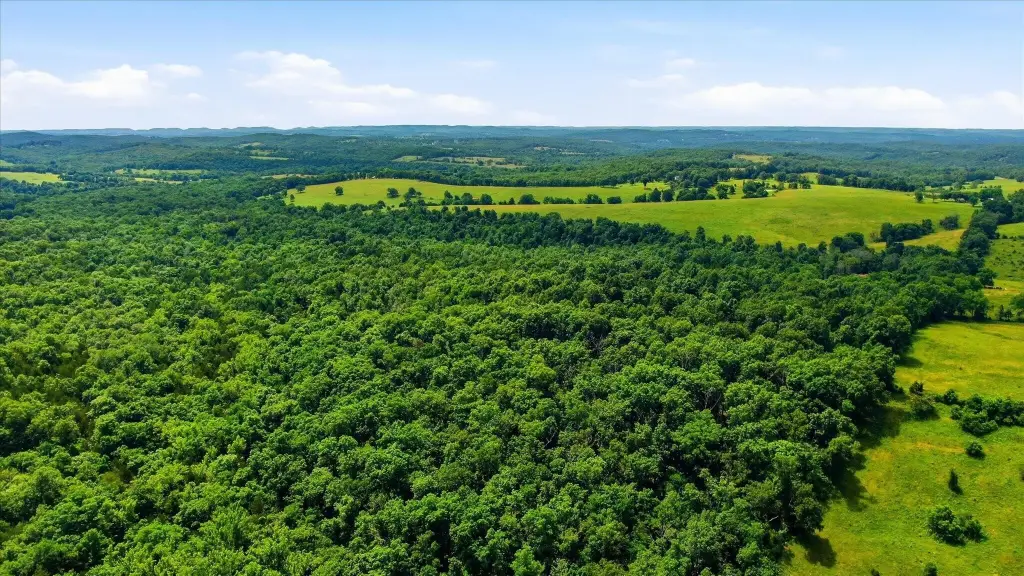
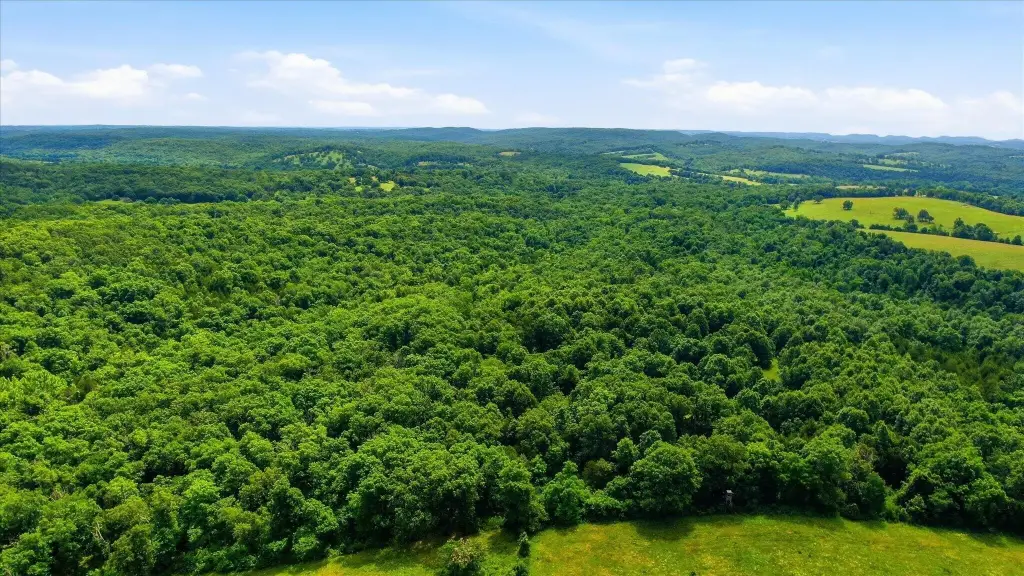
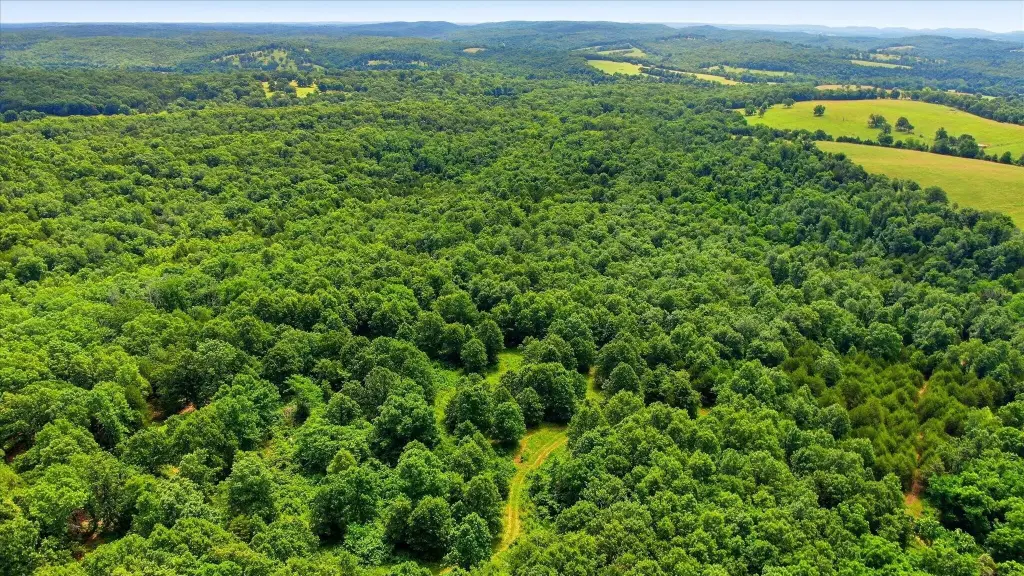
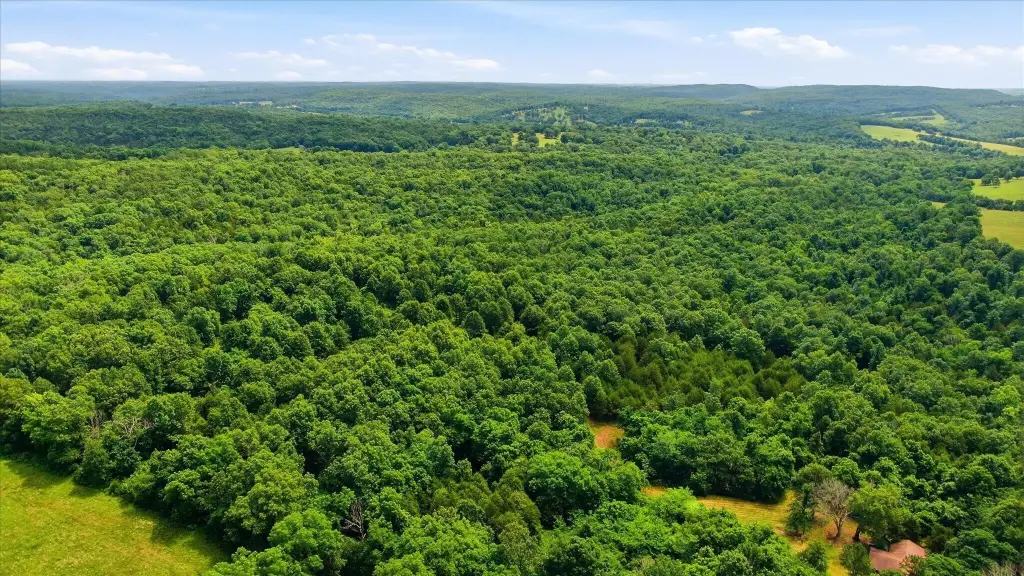
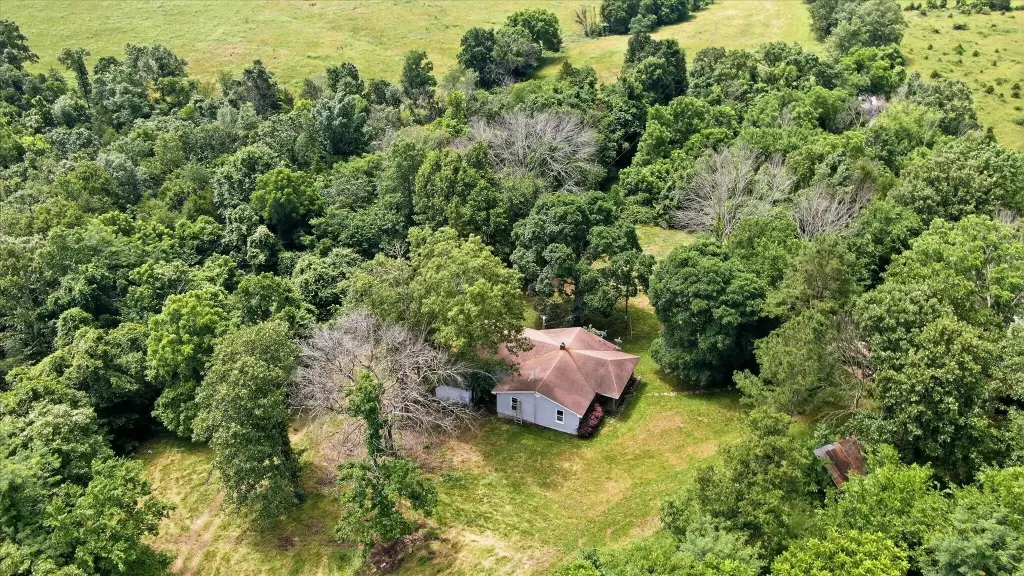
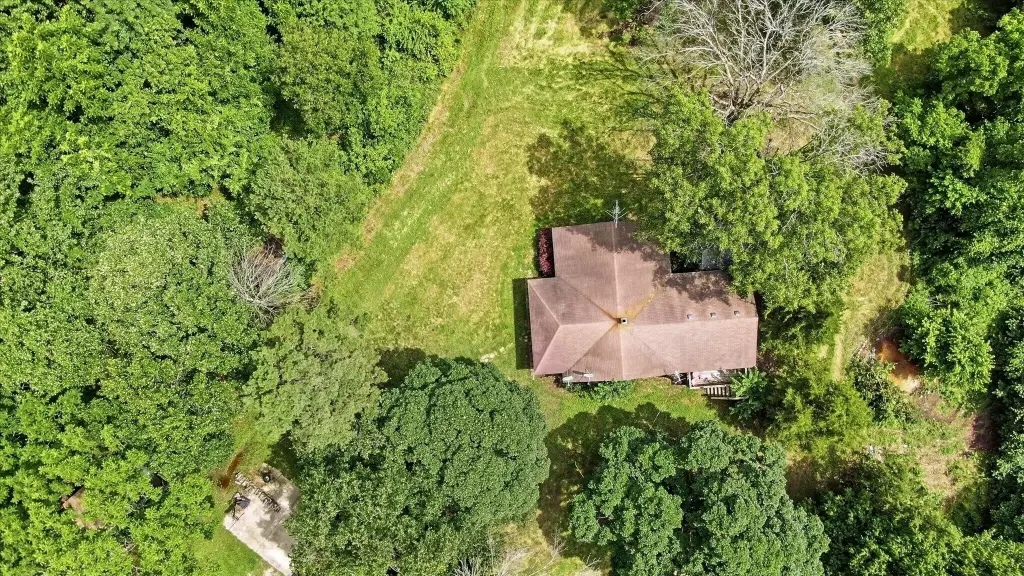
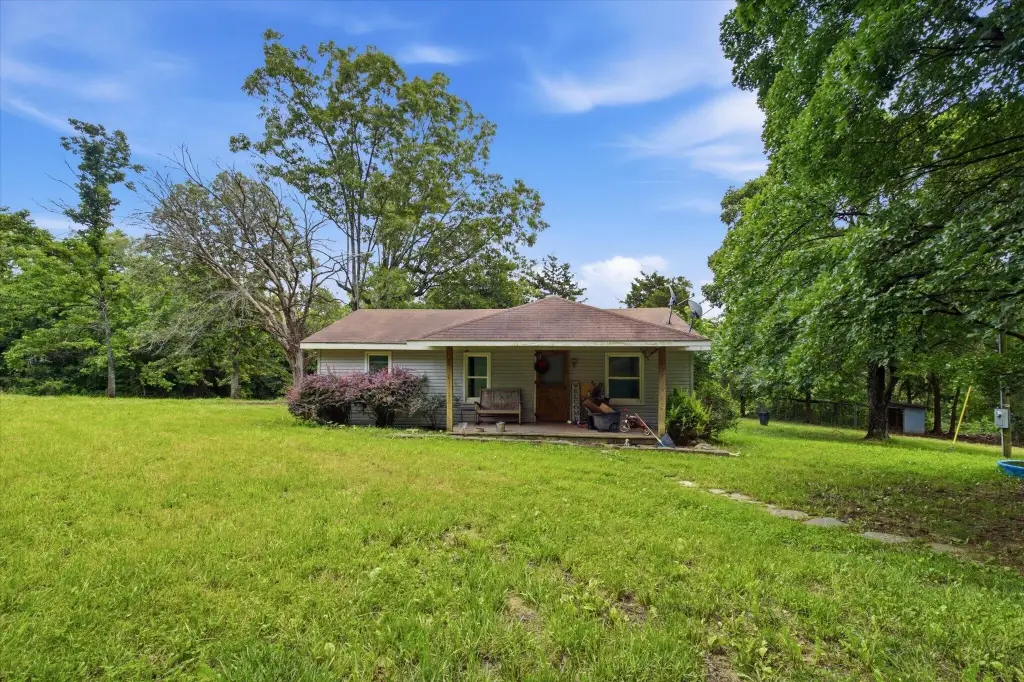
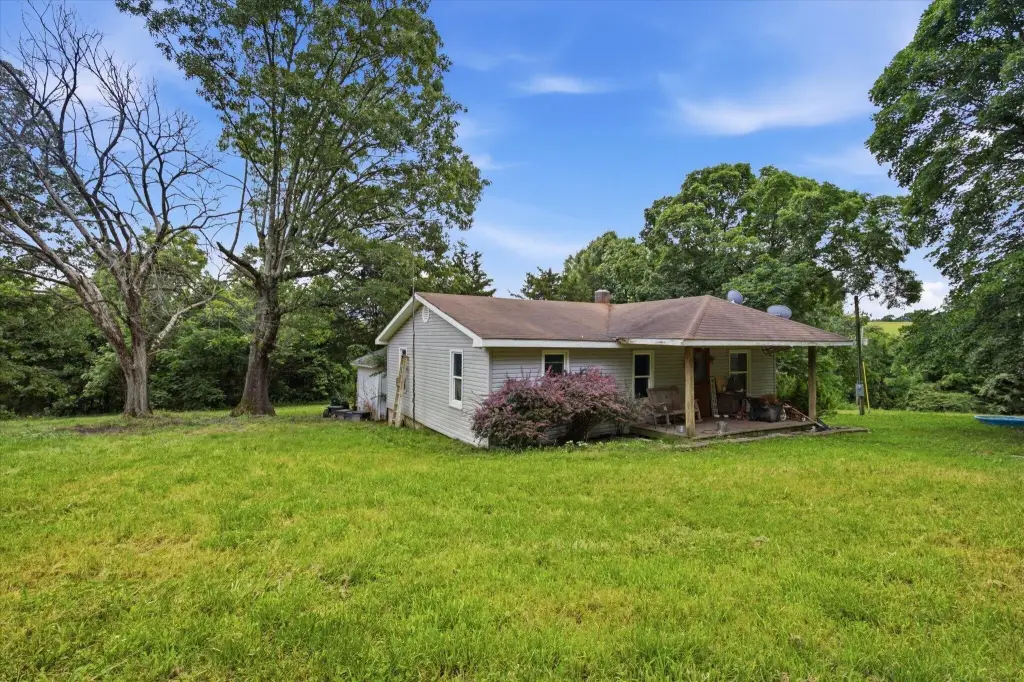
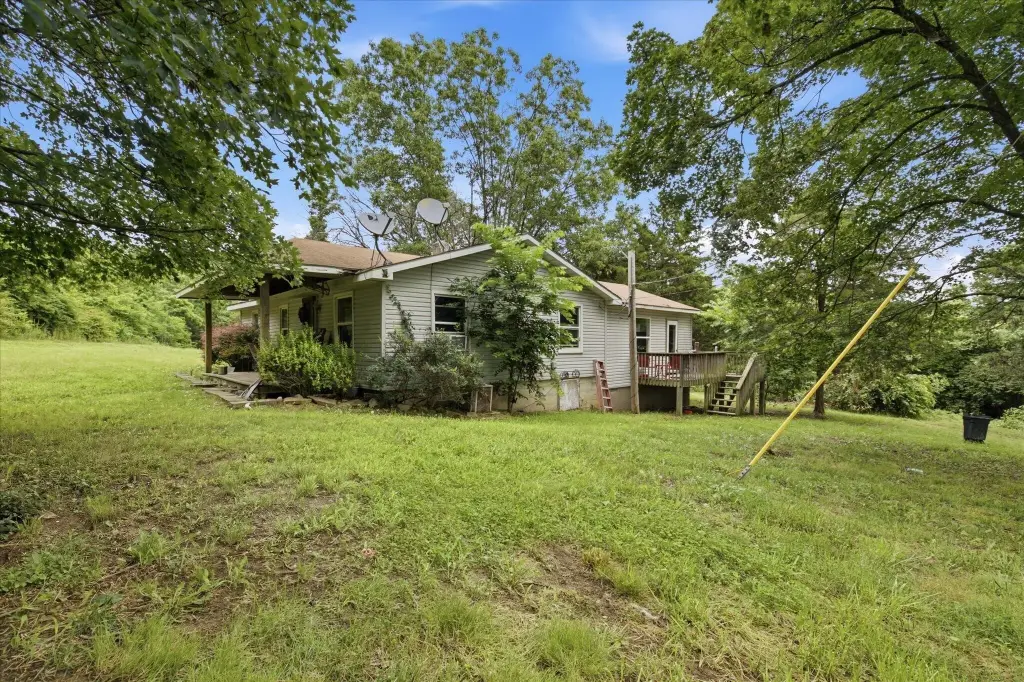
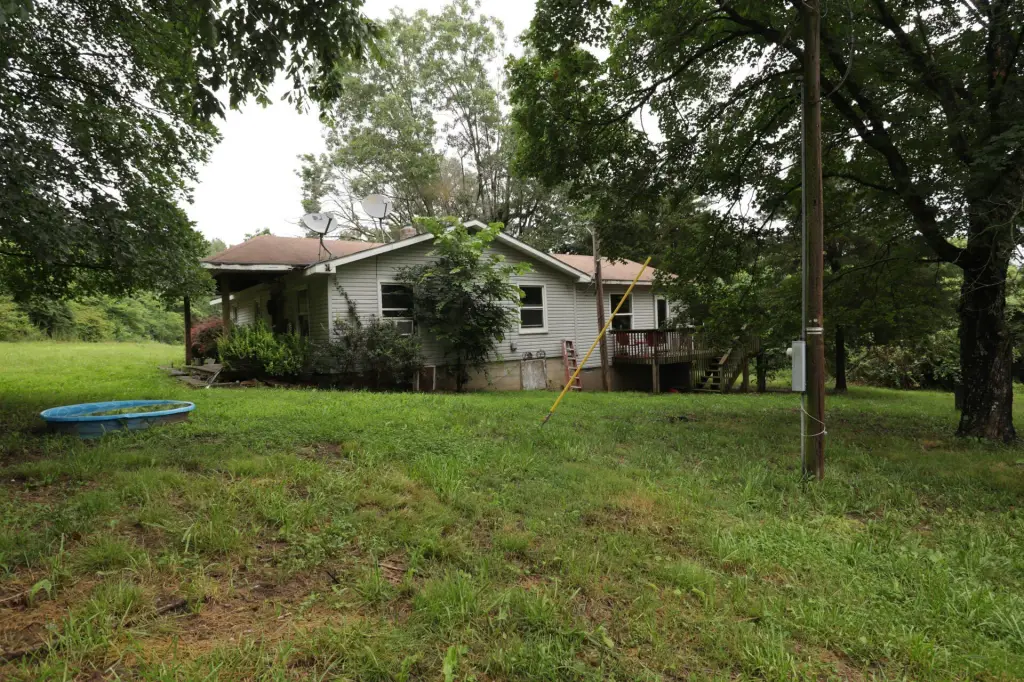
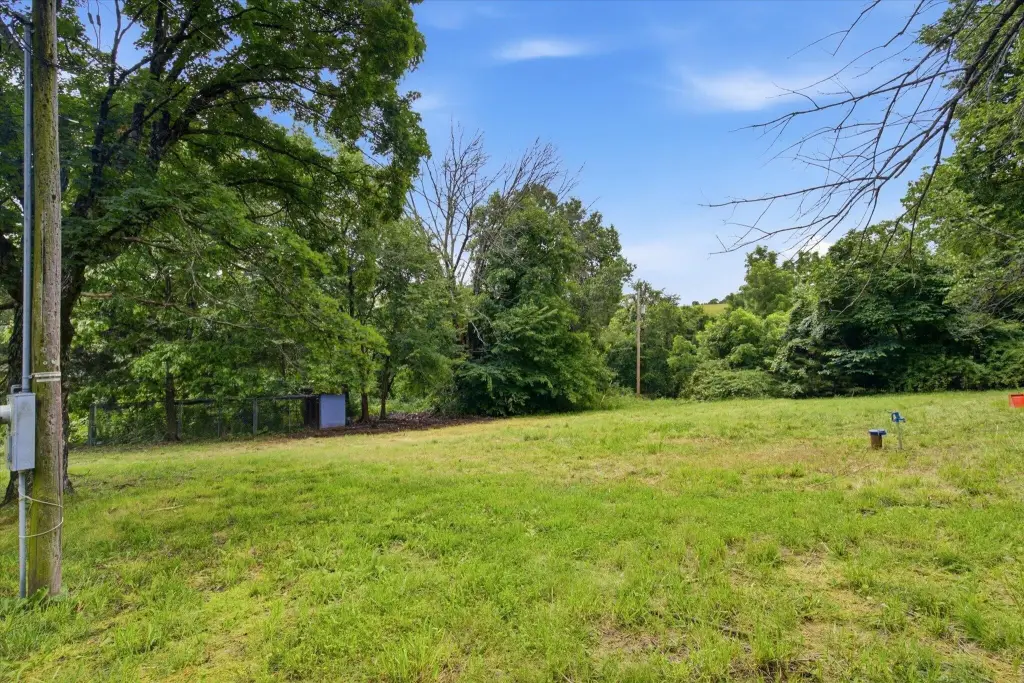
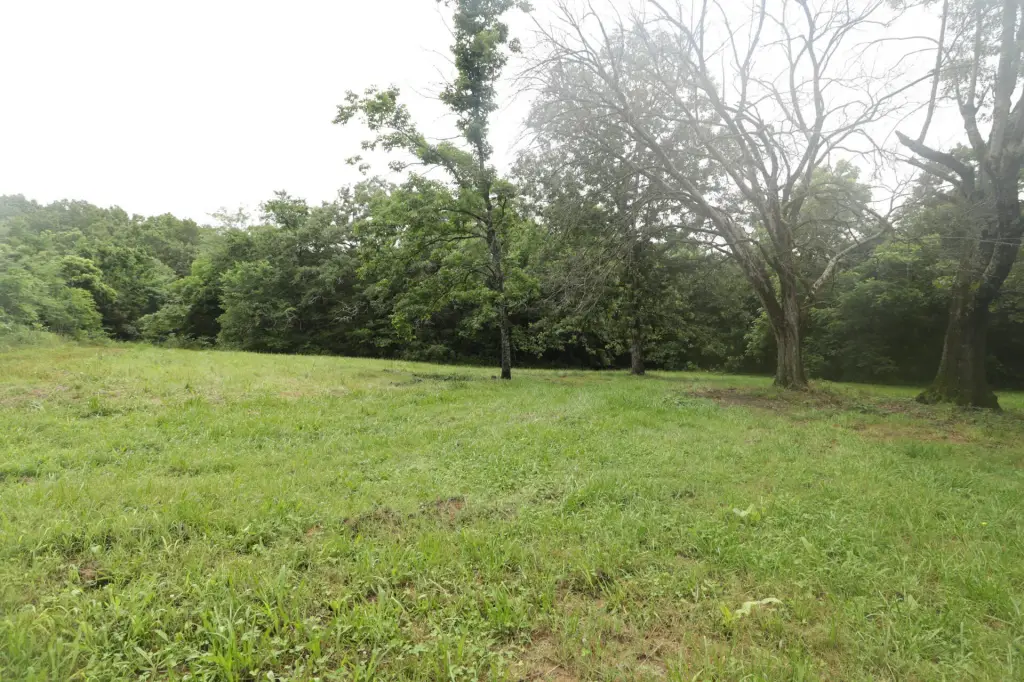
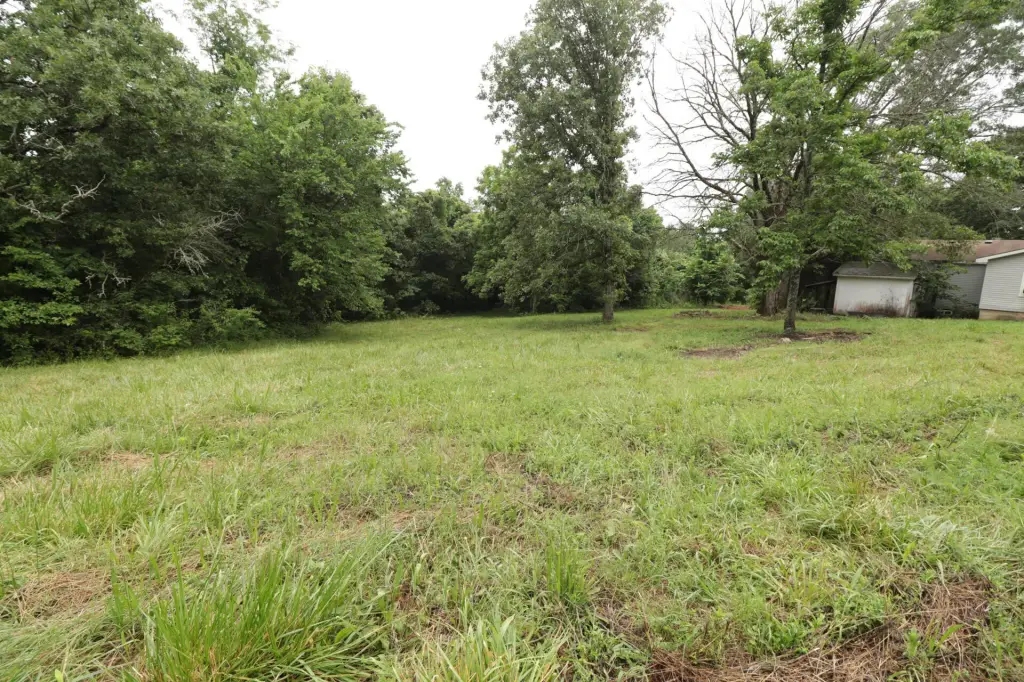
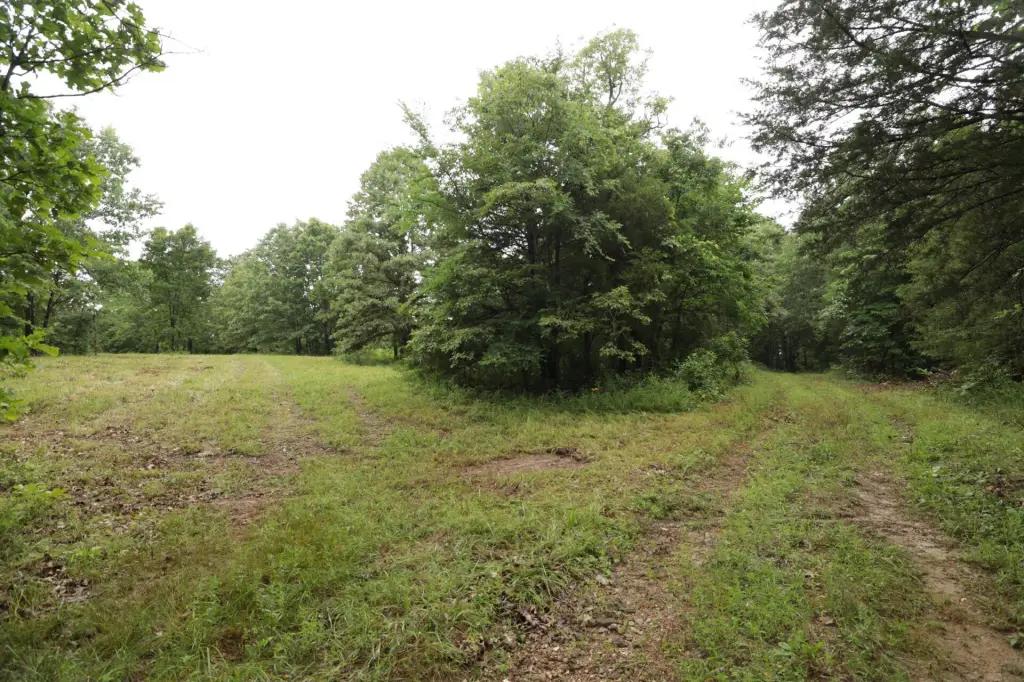
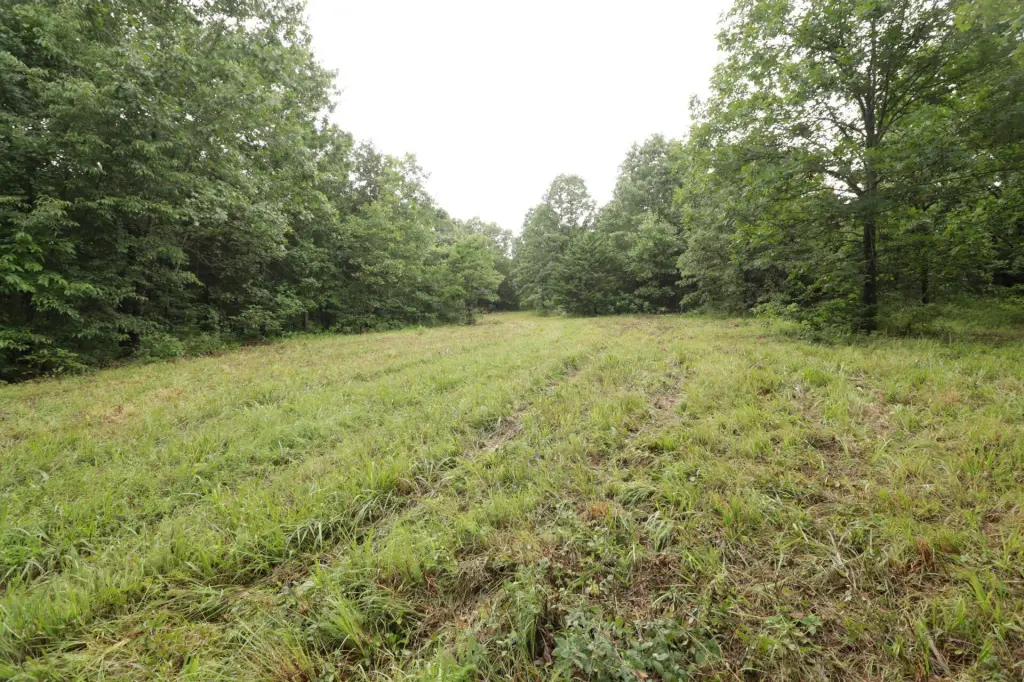
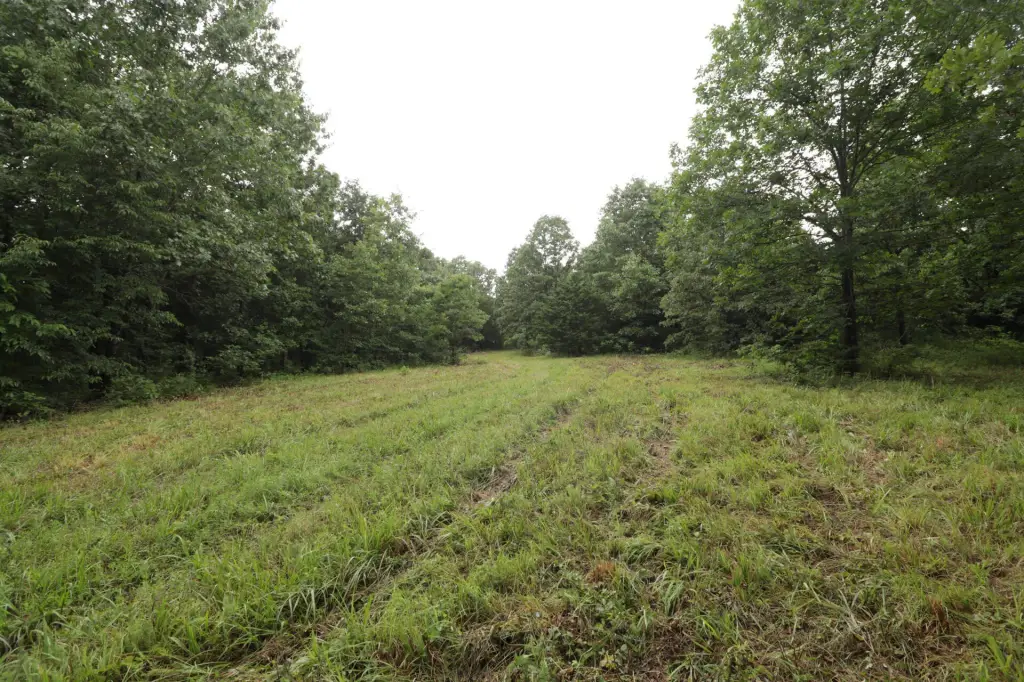
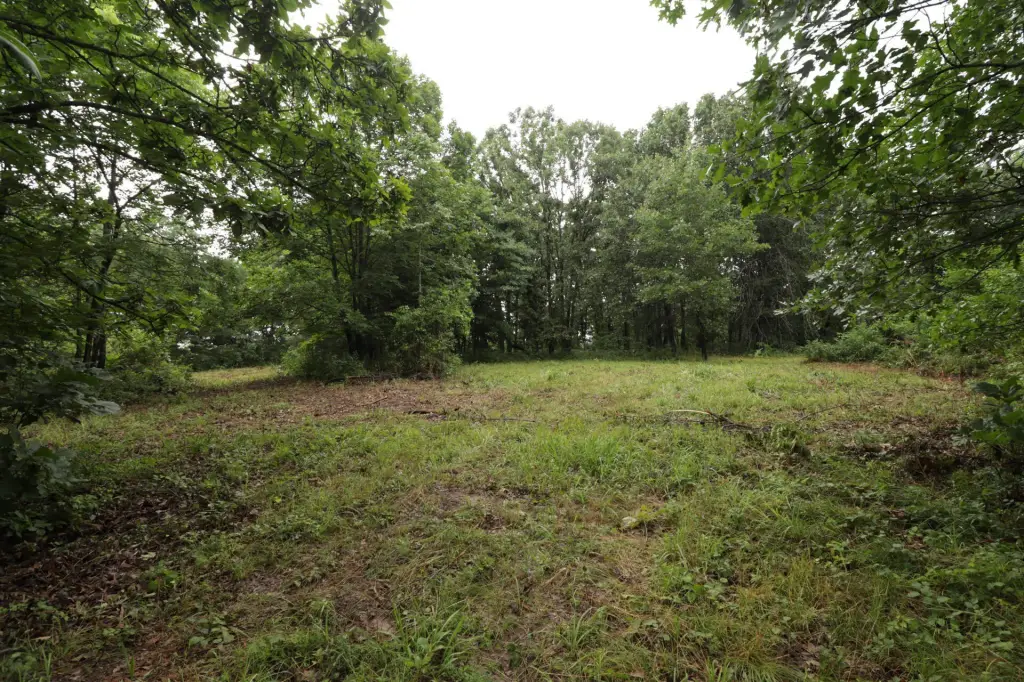
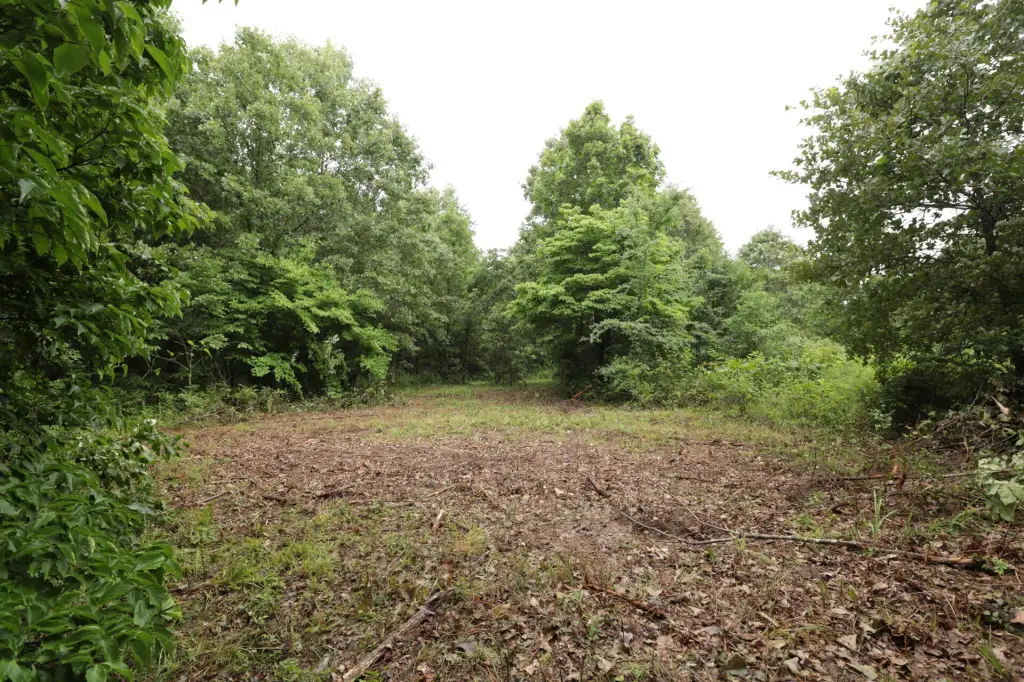
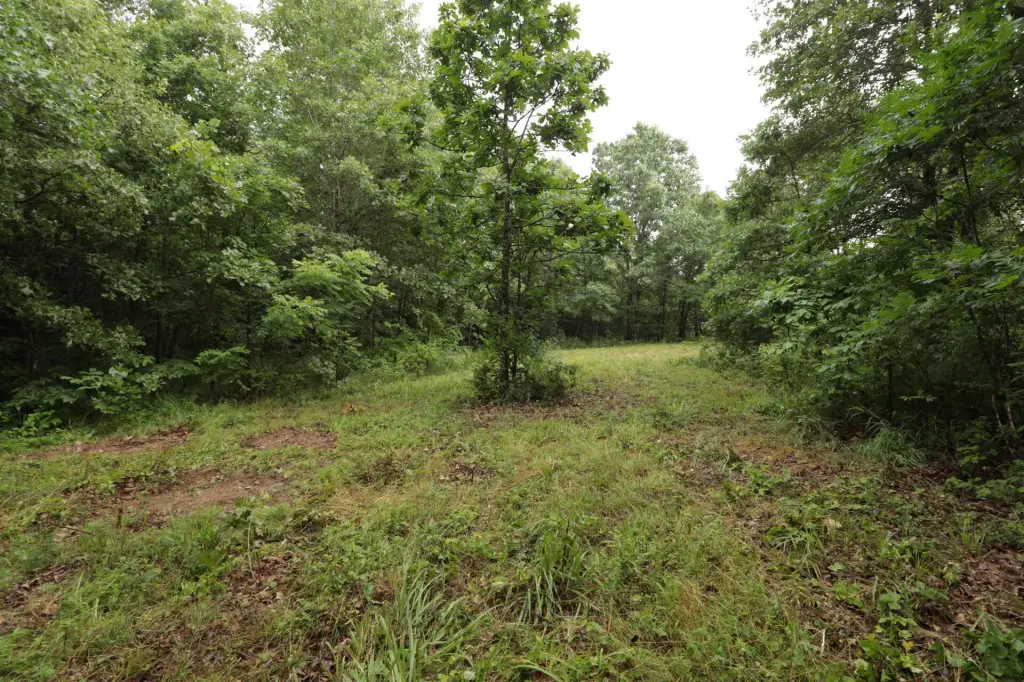
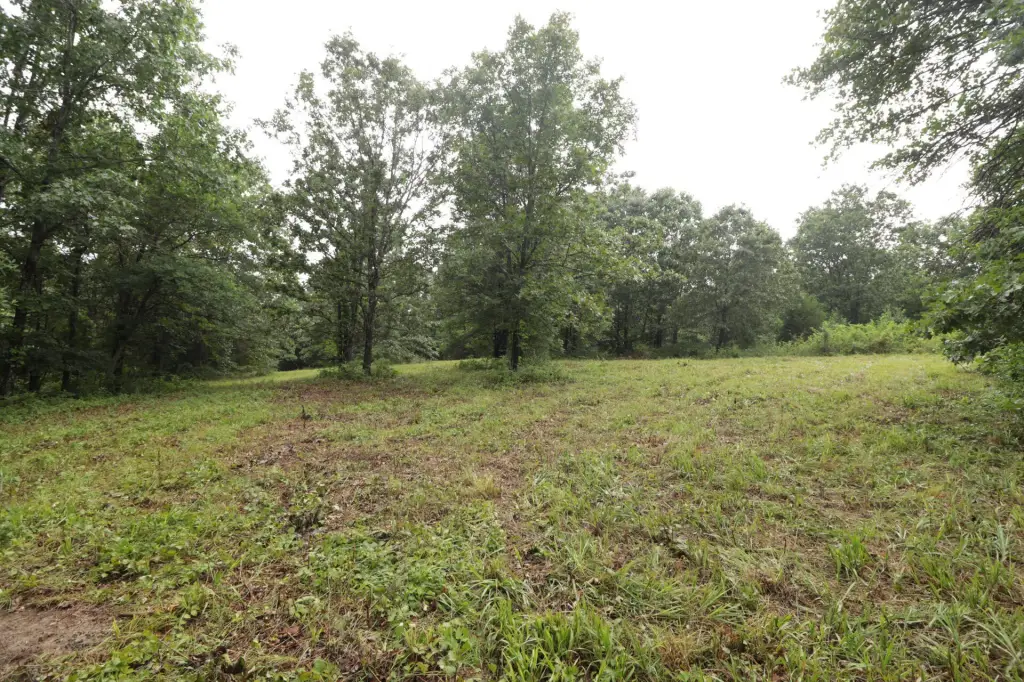
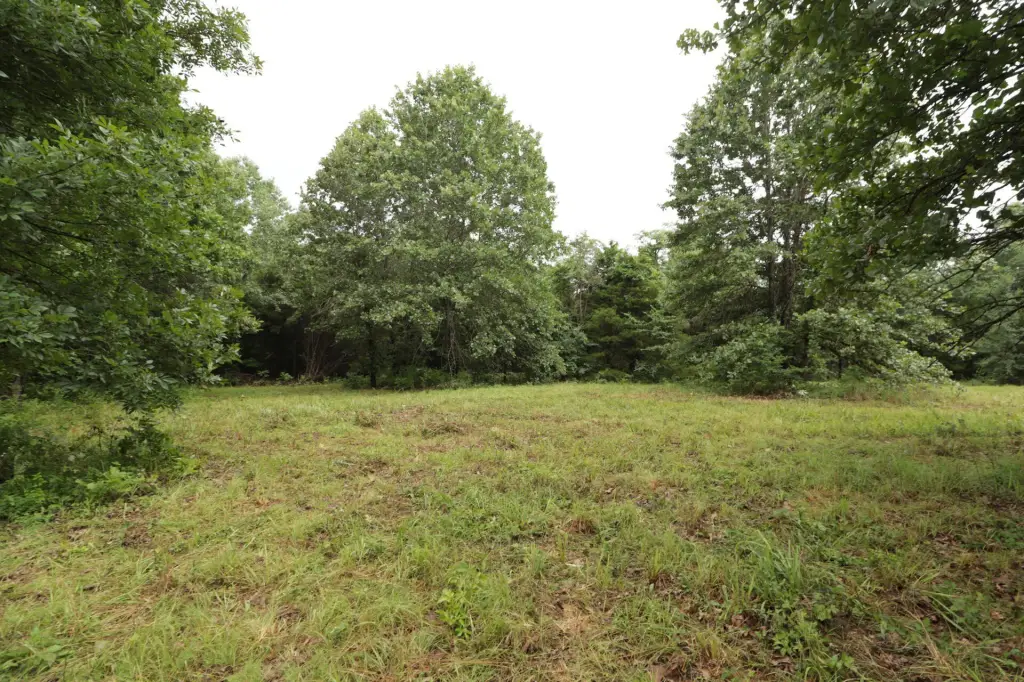
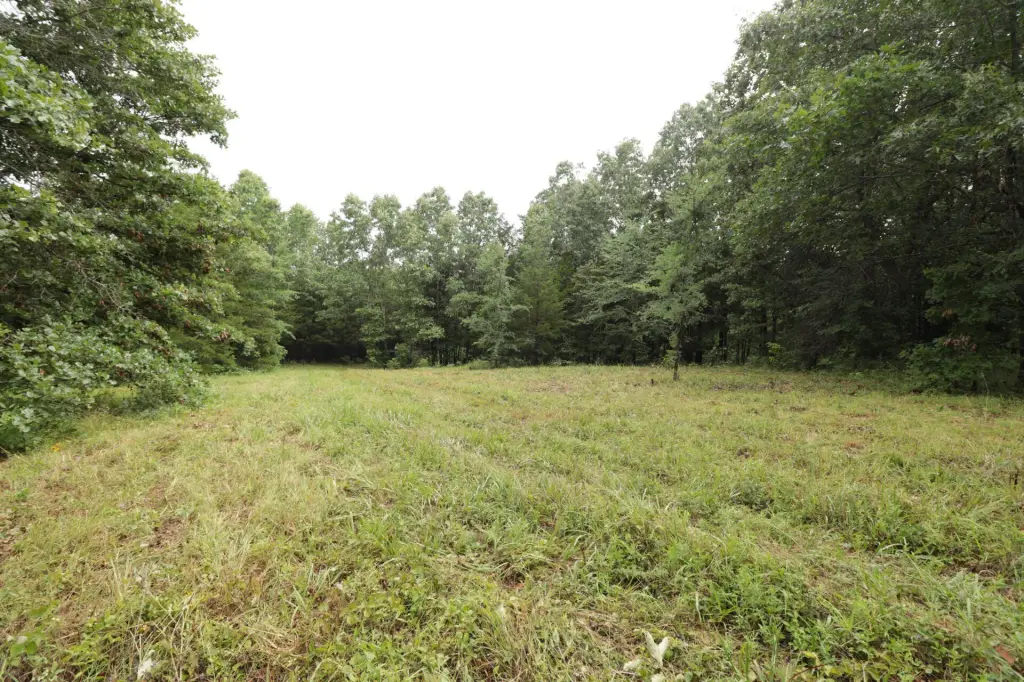
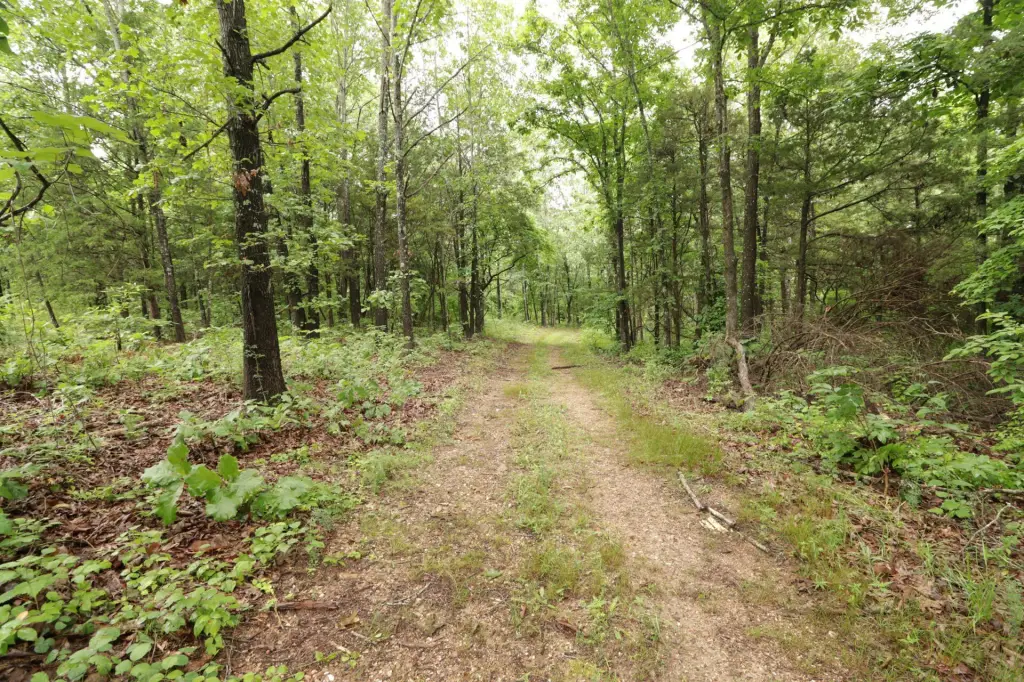
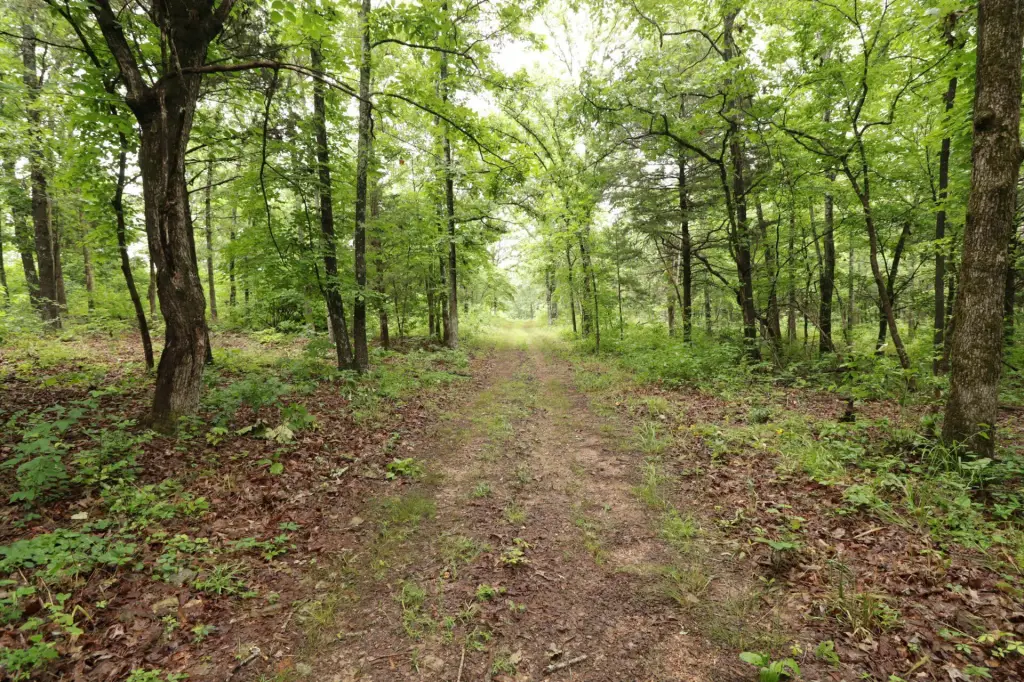
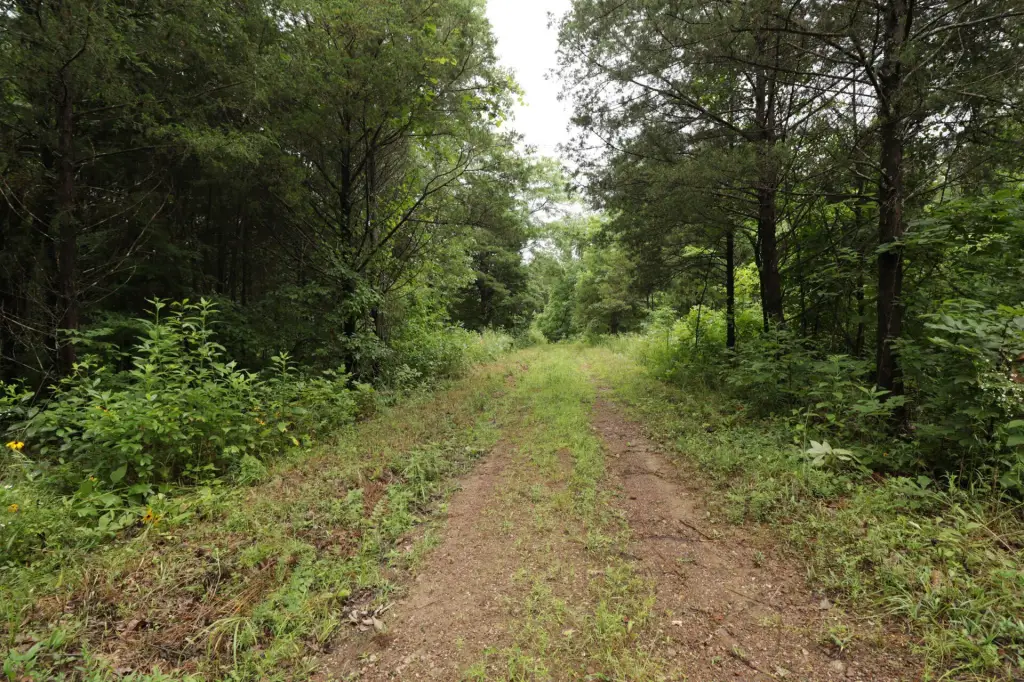
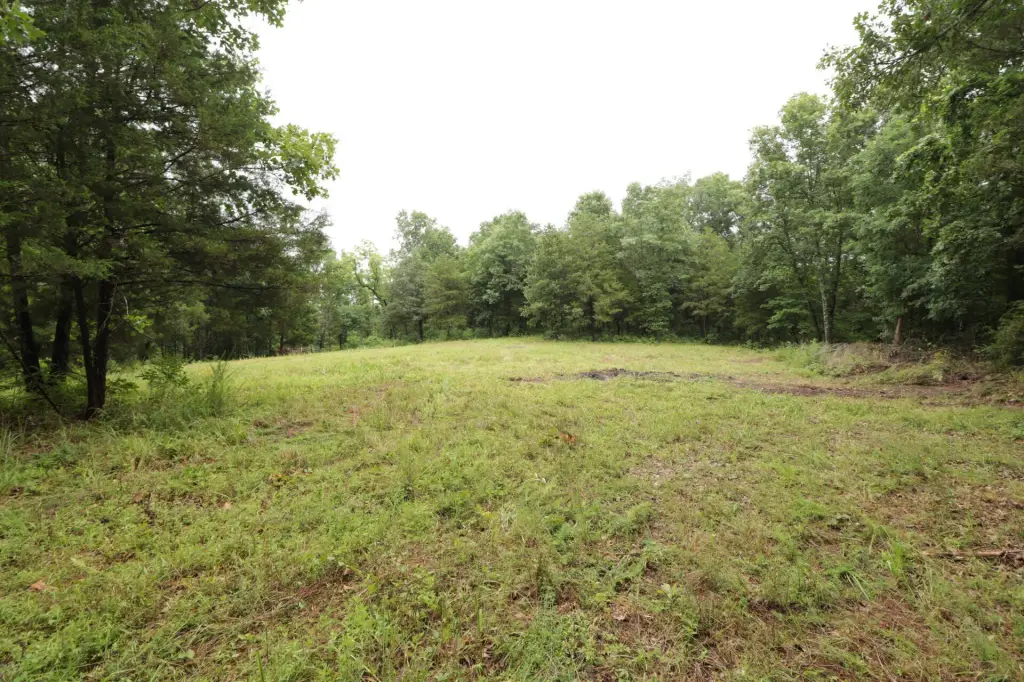
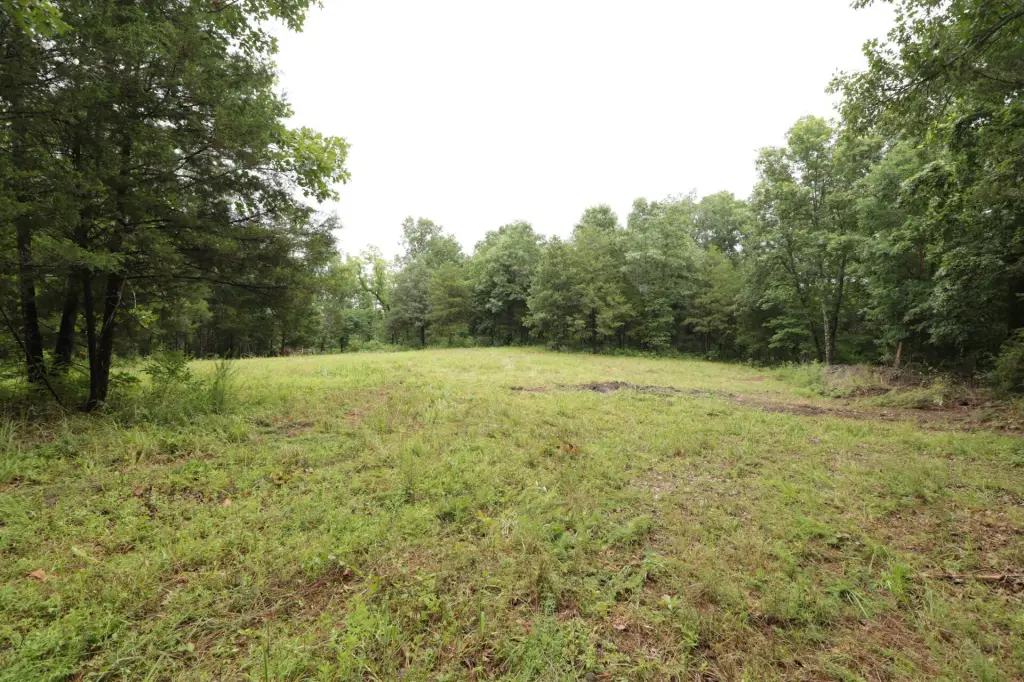
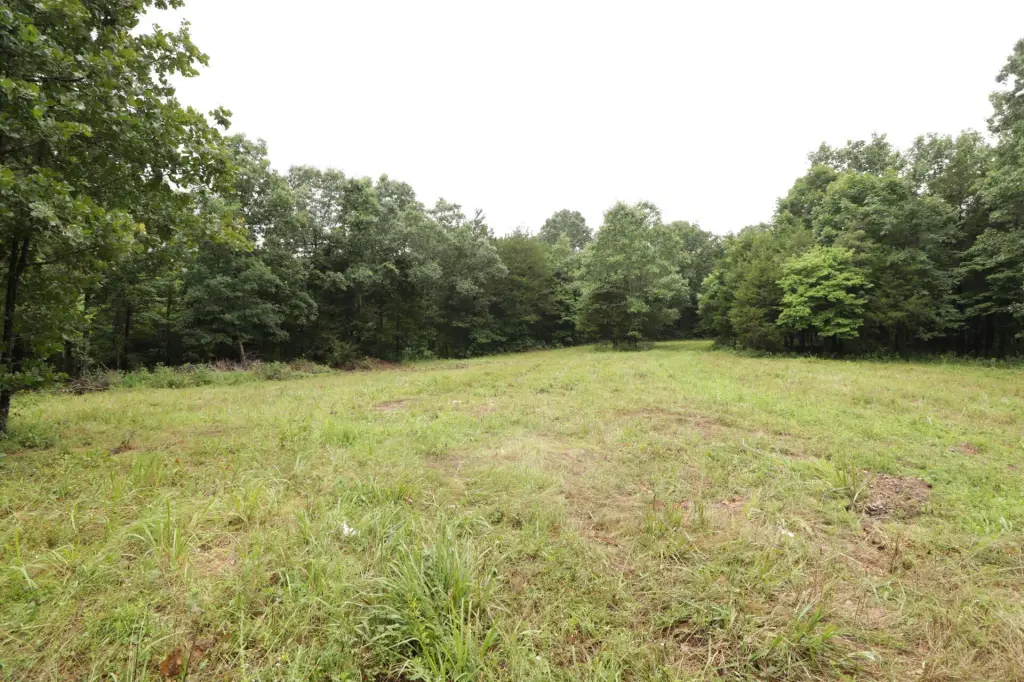
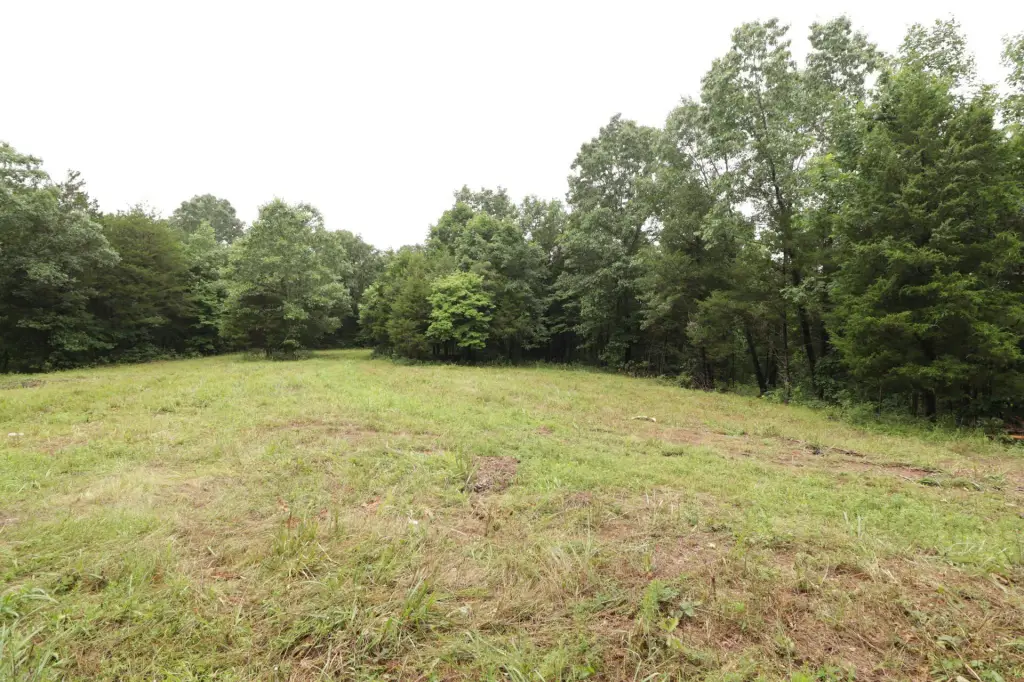
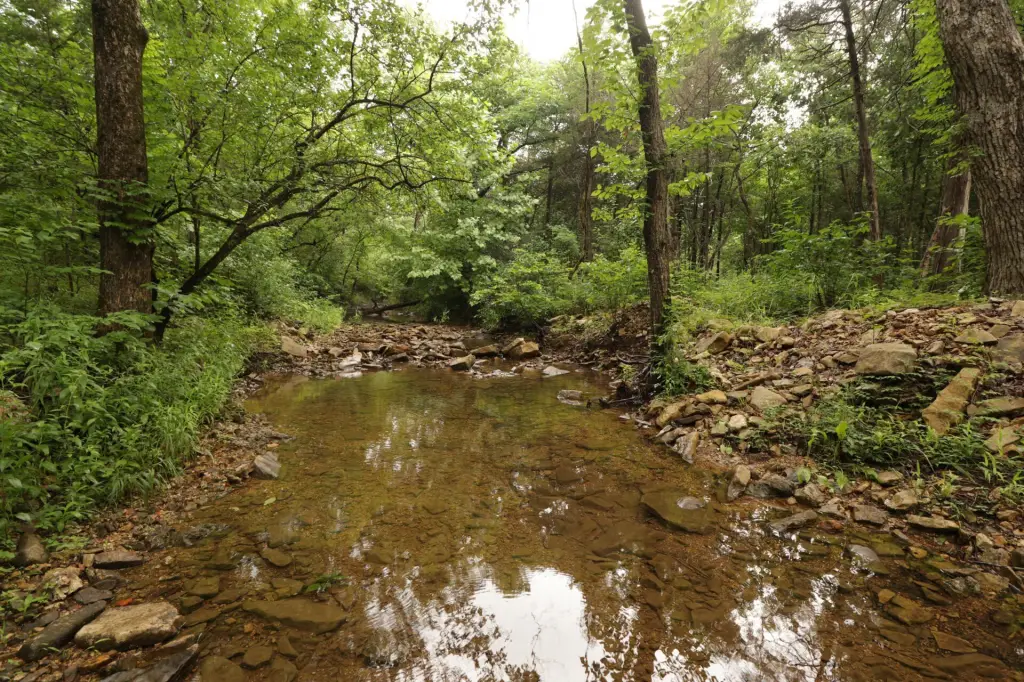
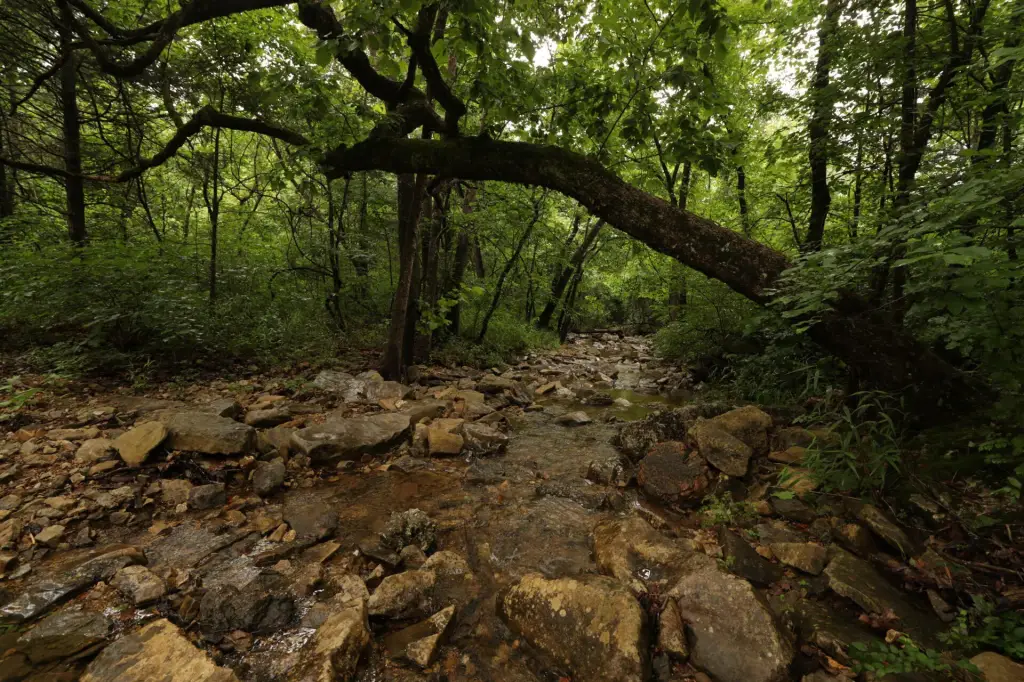
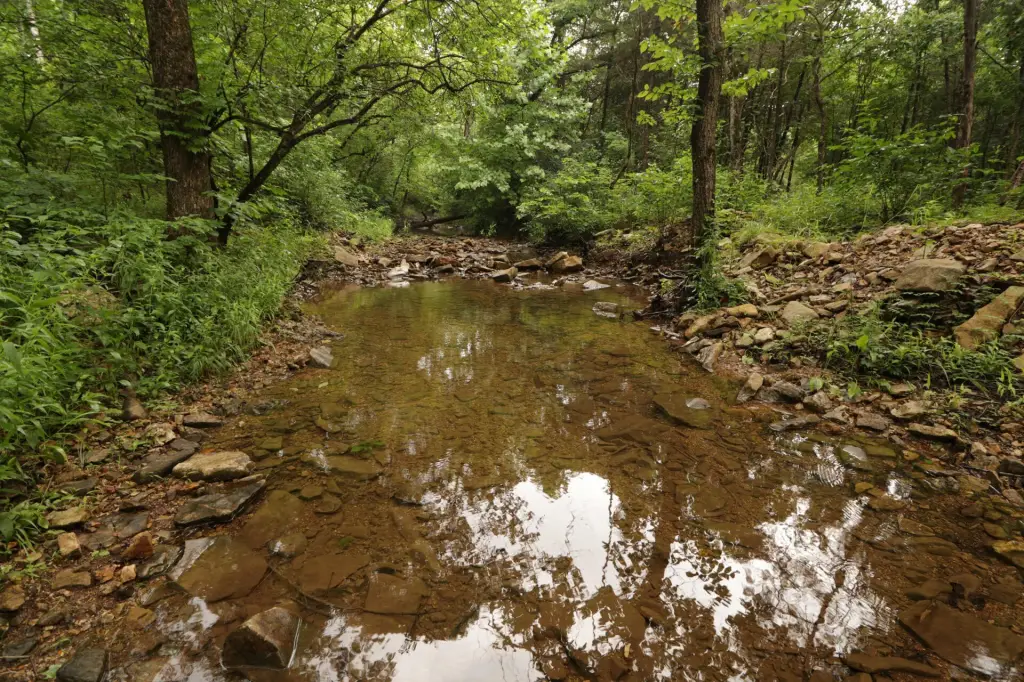
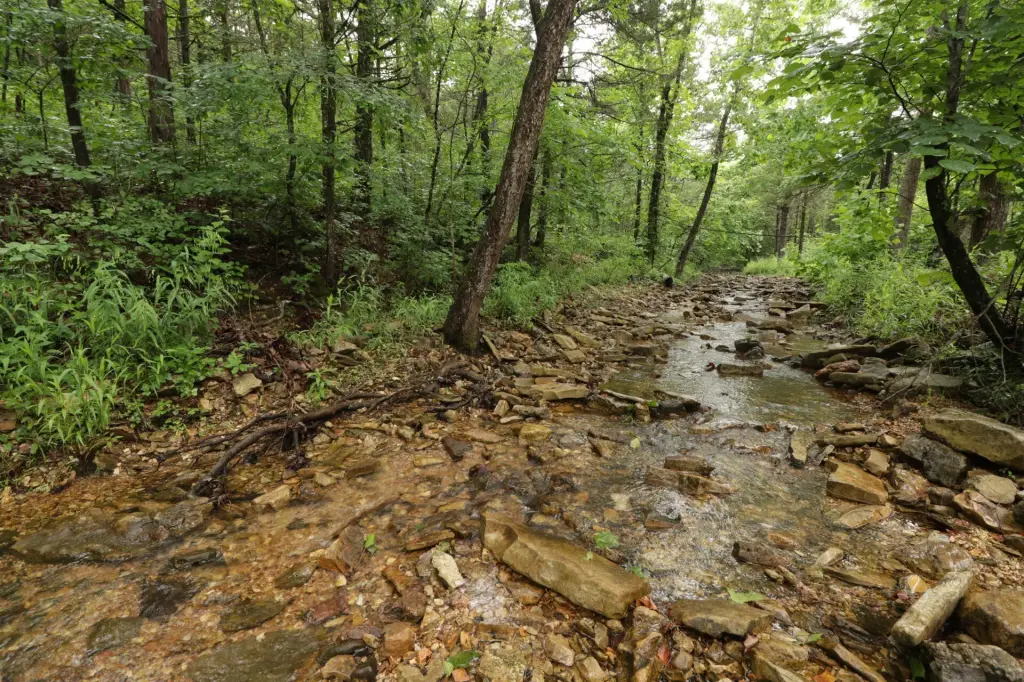
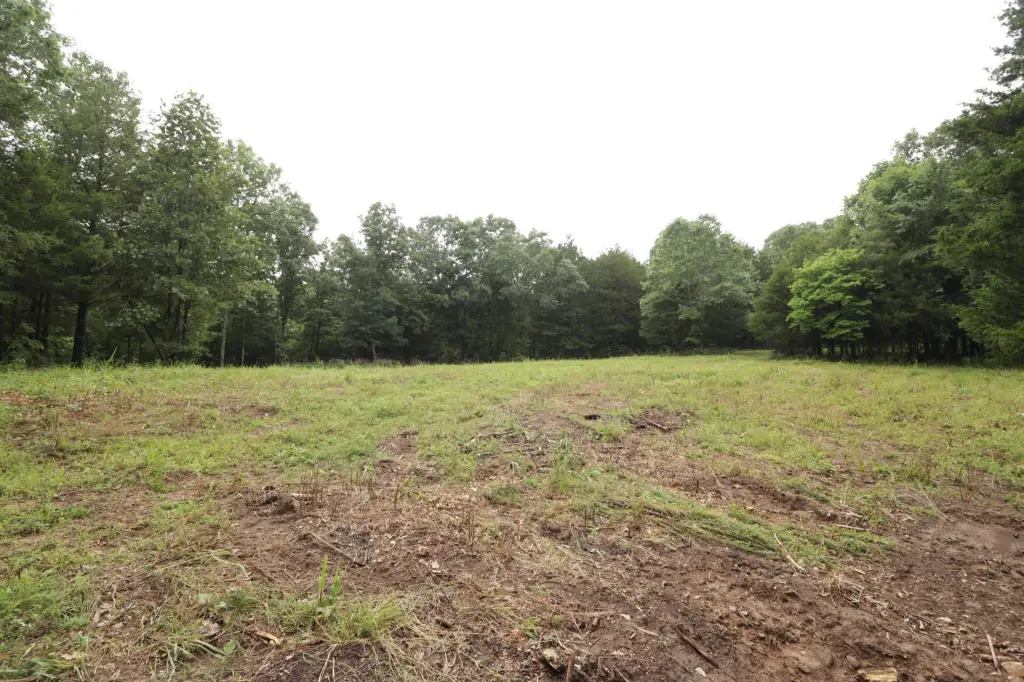
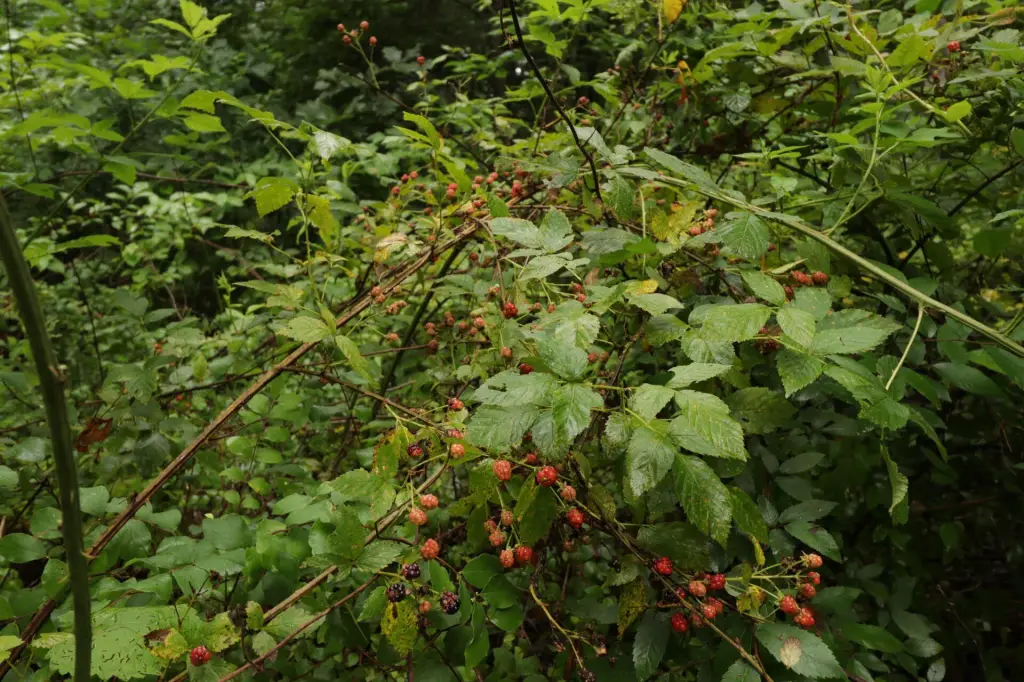
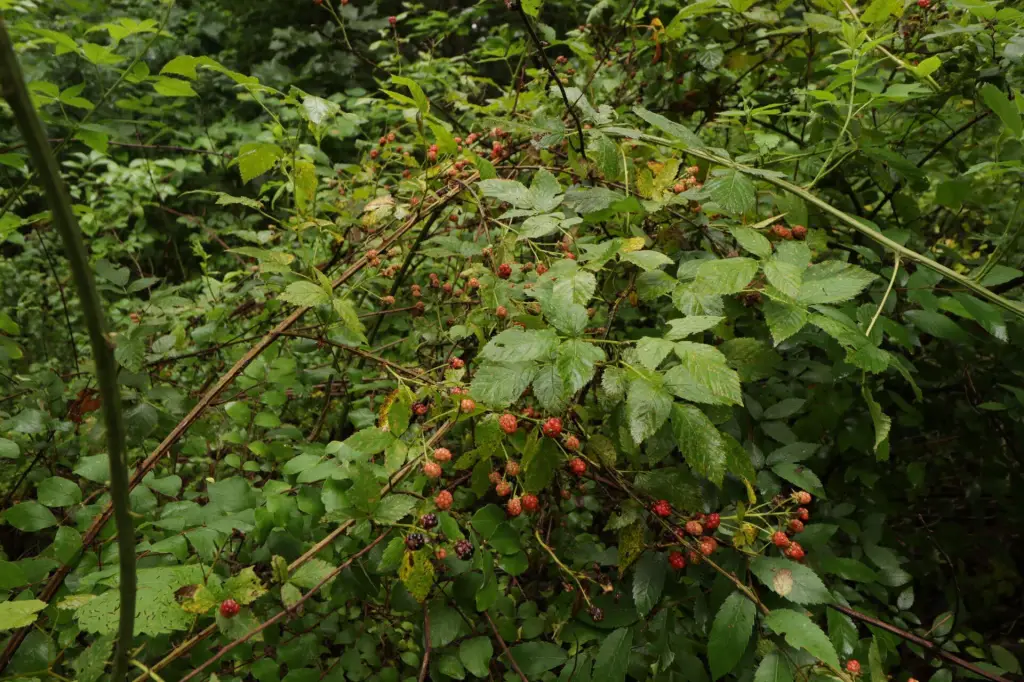
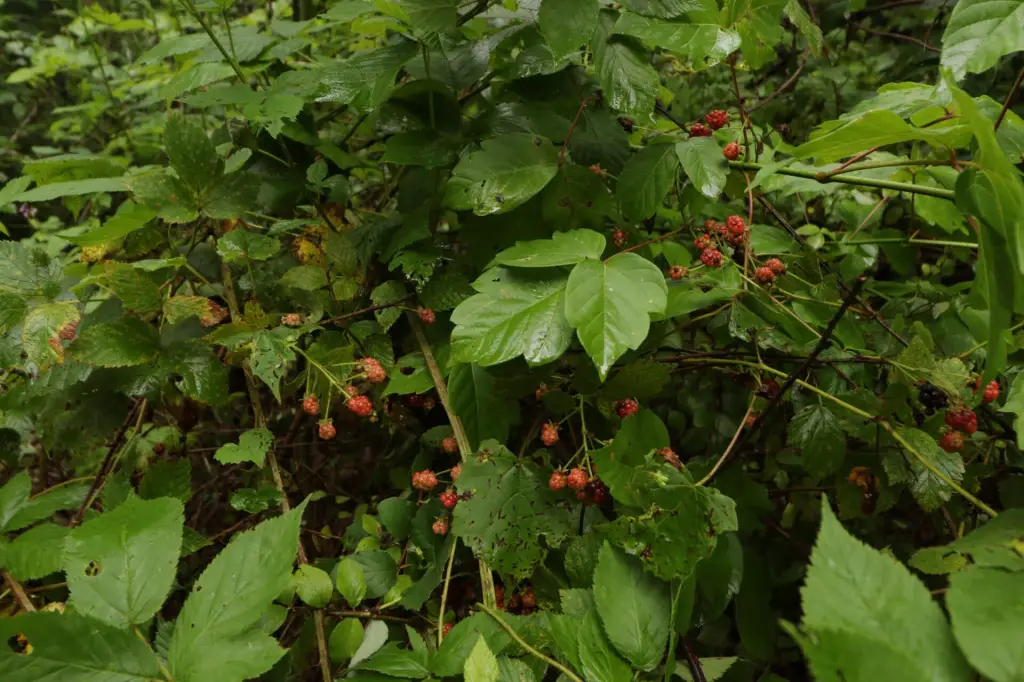
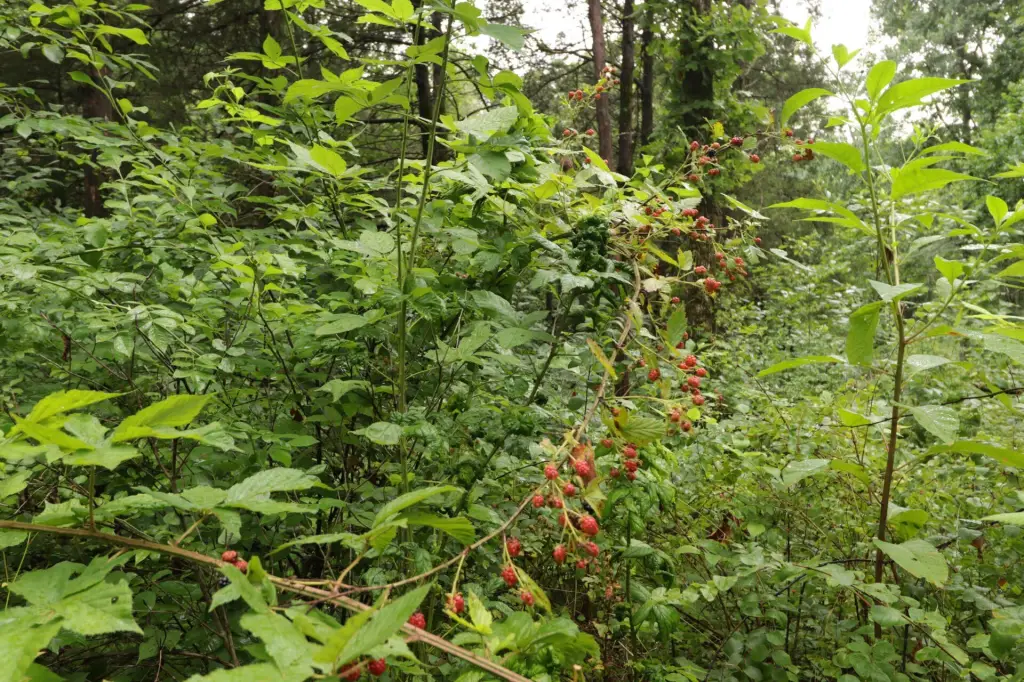
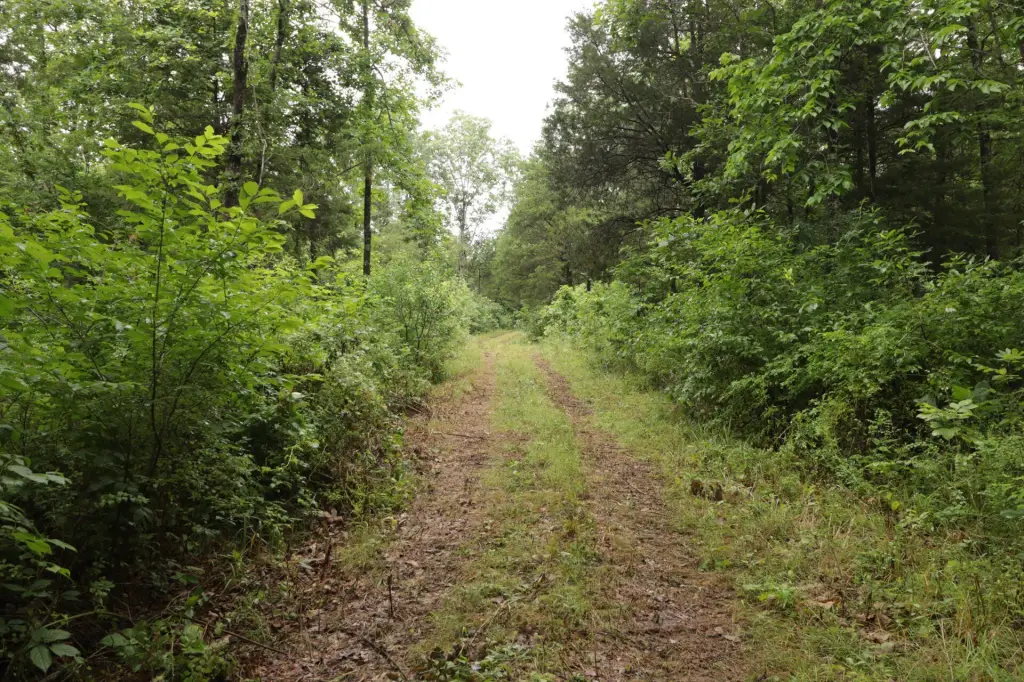
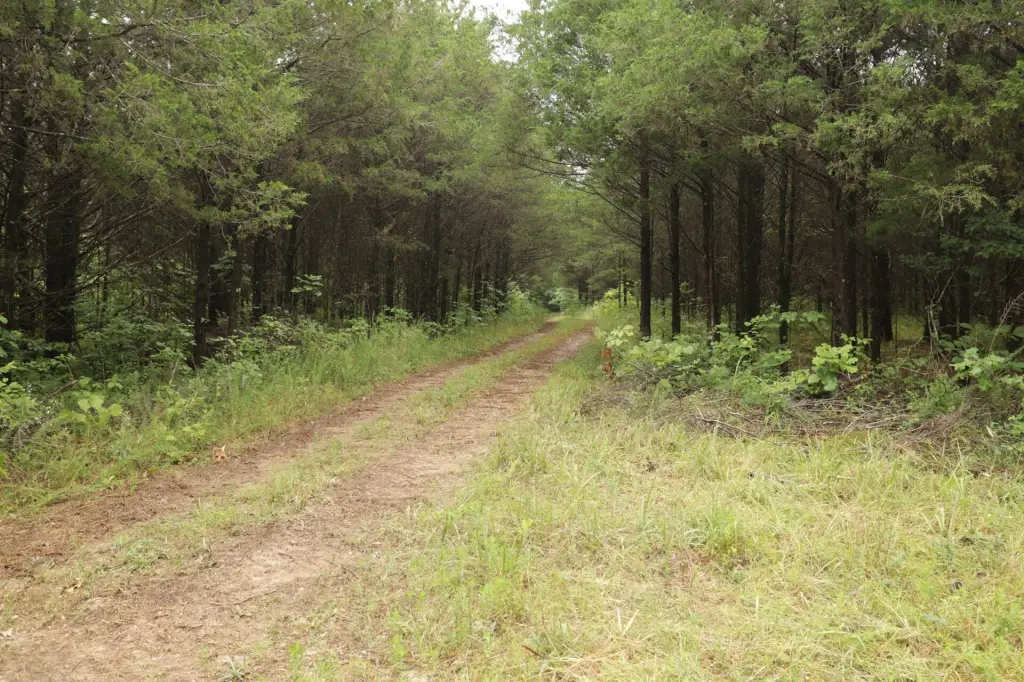
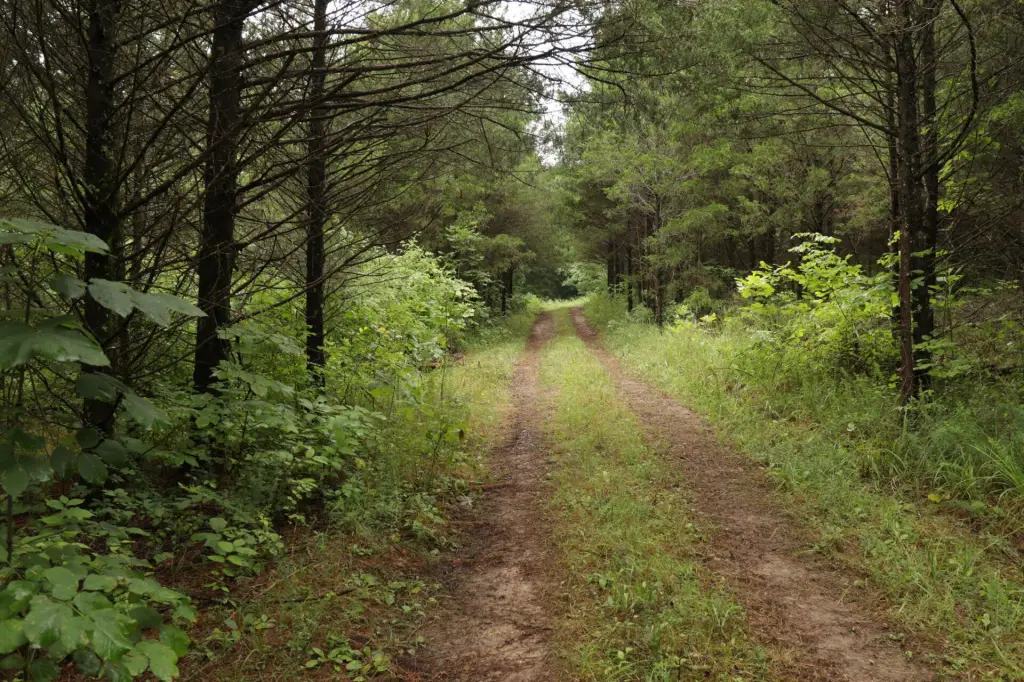
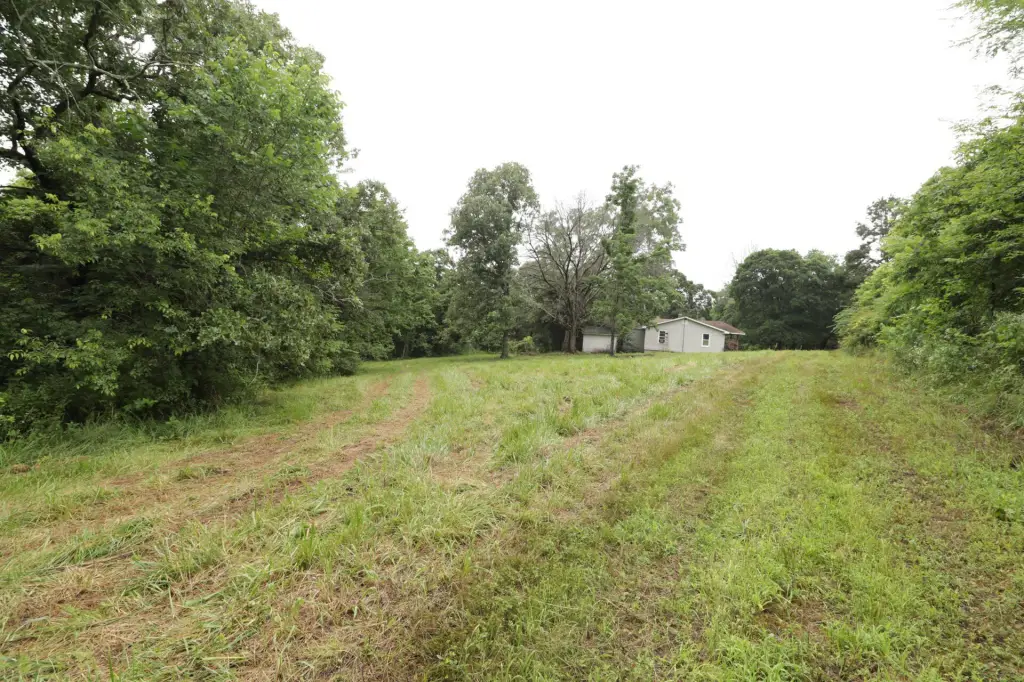
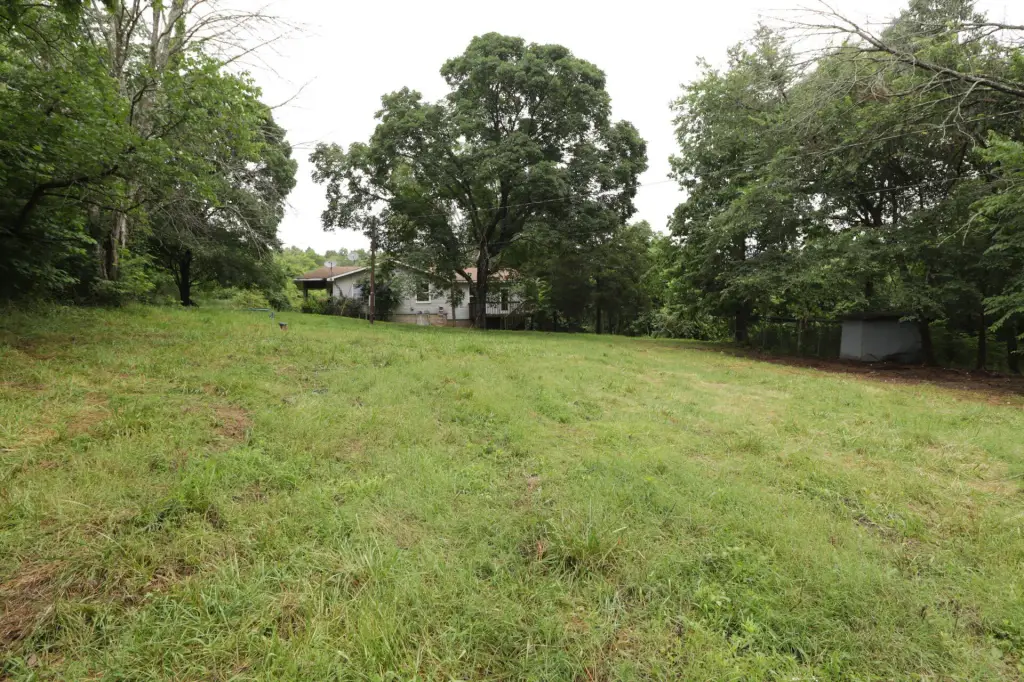
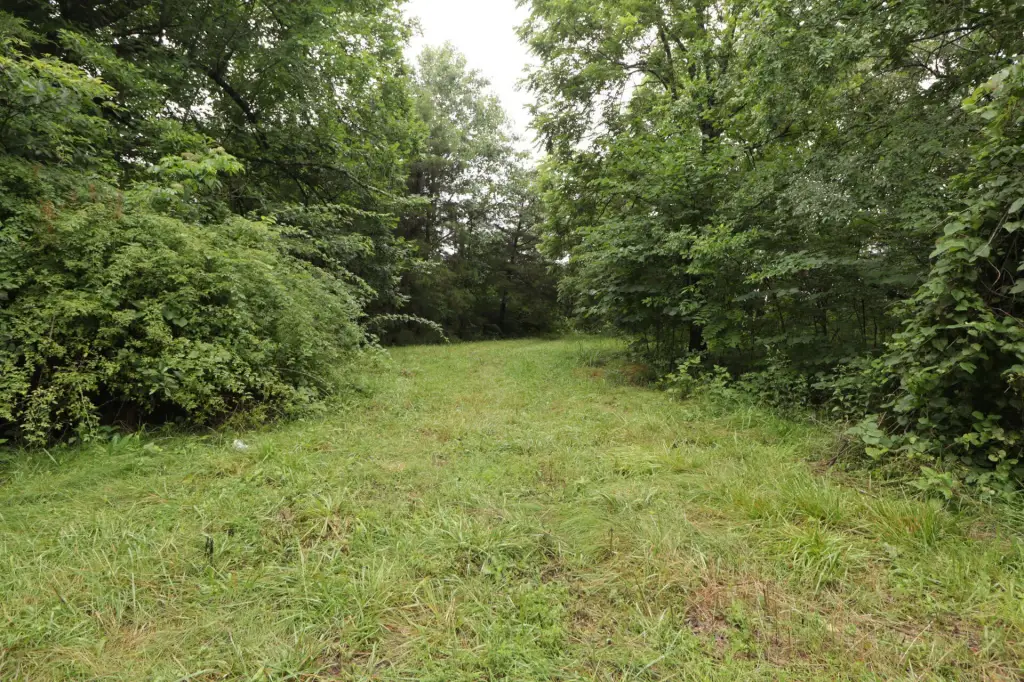
This mostly wooded tract spans 83+/- acres with a mix of hardwoods, a rolling terrain, and a few scattered clearings. A natural spring provides a water source, and a wet-weather creek runs along the southern edge of the property, supporting the land’s varied habitat. An existing fixer-upper 3-bedroom, 1-bath home (approximately 1,376 square feet) sits on-site and may be used as-is, remodeled, or replaced to fit a new build plan.
The property is located on the edge of Christian County near Bradleyville, with the northern boundary bordering over 20,000 acres of Mark Twain National Forest. Electric service and a private well are present on the property. Horses and cattle are allowed, and the acreage is suited for outdoor recreation such as trail riding and camping.
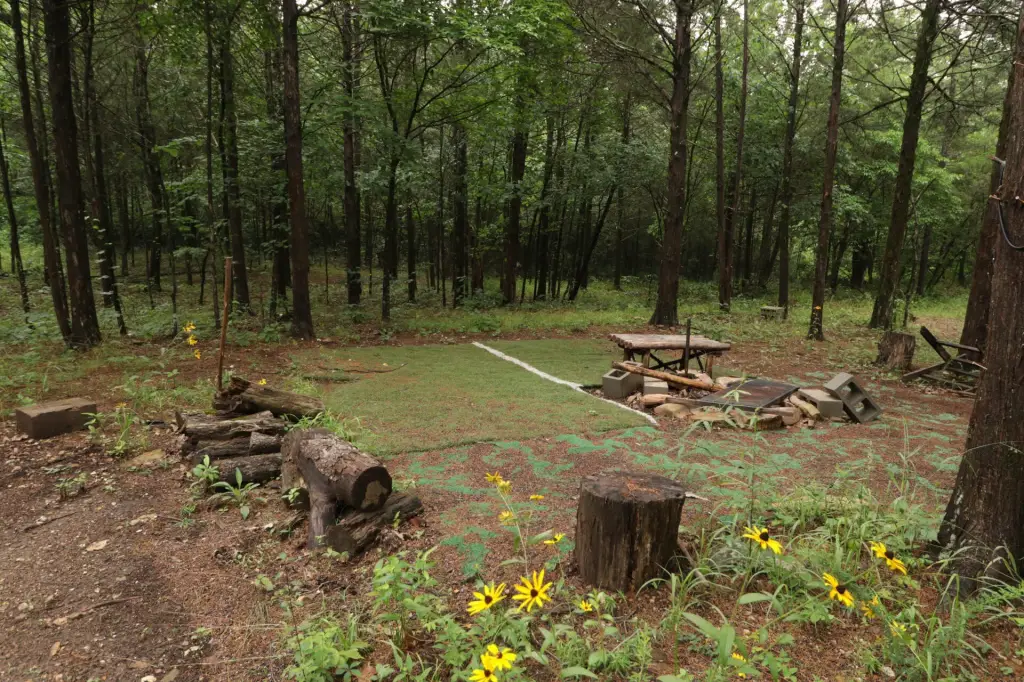
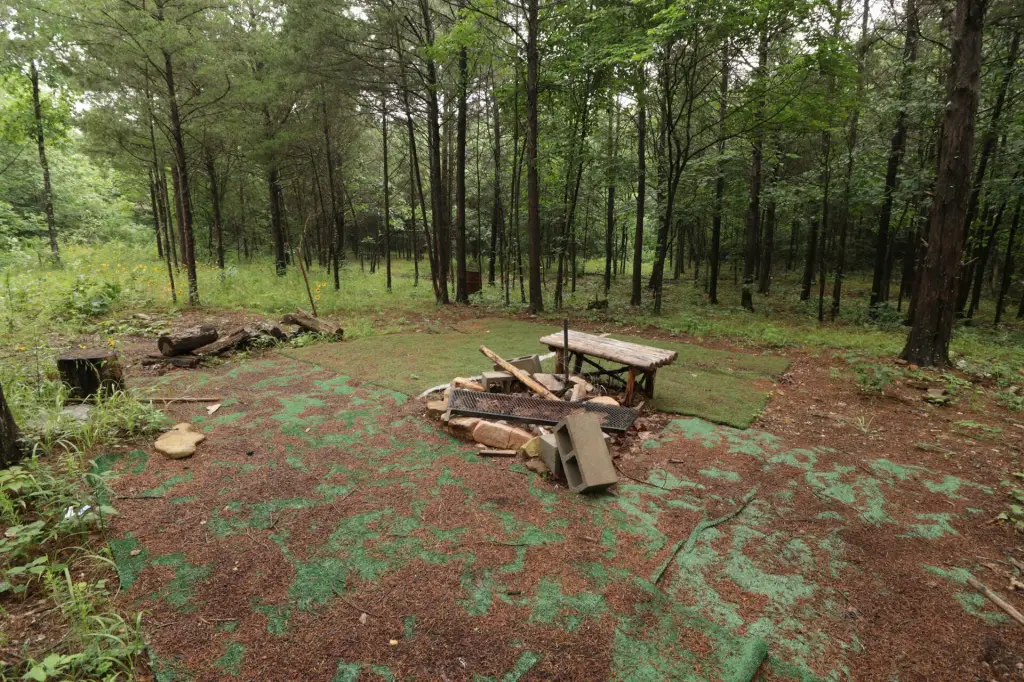
For buyers looking for an on-site base for hunting and land-based recreation, the combination of timber cover, water features, and multiple clearings provides practical space for outdoor use. The existing home adds flexibility for weekend stays while you decide whether to remodel or demolish and create a custom residence on the property.
The property is located on the edge of Christian County near Bradleyville, with the northern boundary bordering over 20,000 acres of Mark Twain National Forest. Electric service and a private well are present on the property. Horses and cattle are allowed, and the acreage is suited for outdoor recreation such as trail riding and camping.
For buyers looking for an on-site base for hunting and land-based recreation, the combination of timber cover, water features, and multiple clearings provides practical space for outdoor use. The existing home adds flexibility for weekend stays while you decide whether to remodel or demolish and create a custom residence on the property.
Key Highlights
- 83+/- acre mostly wooded tract on the edge of Christian County with rolling terrain and hardwood tree cover
- Natural spring plus wet weather creek along the southern edge provides water features on the property
- Borders over 20,000 acres of Mark Twain National Forest along the northern border
Financial Insights
Estimated NOI and Cap Rate
NOI / Yr
$11,112
Cap Rate
3.47%
Suggested Prices Based on Cap Rates
Cap Rate 5%
$222,240
$222.2K
Cap Rate 7%
$158,743
$158.7K
Cap Rate 9%
$123,467
$123.5K
Market Conditions
NOI Build-Up for 1,376 SF
Gross rent
$22.0K $15.96/SF
− Vacancy
−$1.8K −$1.28/SF
EGI
$20.2K $14.68/SF
− OpEx
−$9.1K −$6.61/SF
NOI
$11.1K $8.08/SF
Area
Taney County, MO
Vacancy
8.00%
Lease Rate
$15.96 /SF/Yr
Expense Ratio
45.00%
Simulate Cap Rate and NOI
Suggested Prices Based on Cap Rates
Cap Rate 5%
$222,240
Cap Rate 7%
$158,743
Cap Rate 9%
$123,467
Alternative Uses
Best Use
Apartment 5plus
$158.7K
$138.9K – $185.2K
NOI $11,112 @ 7.0% cap · market cap 3.47%
Second Best
—
—
no second resolved use
Theoretical Best
Office A
$268.9K
$235.3K – $313.7K
NOI $18,824 @ 7.0% cap · market cap 5.88%
Zoning and permitted uses should be independently verified with authorities.
Property Analytics
Unlock full access to Insights
Subscribe to Realmo Intelligence
Open Analytics
Current Use
Lease Details
Yes
Utilities to site
Location Intelligence
Trade Area within ½ mile
1
Businesses Nearby
Explore this area
Business Placement
Demographics for 65614, MO
521
Population
250
Households
2.1
Avg Household Size
45
Median Age
17%
College-Educated
84%
High-School Grad
107.2 sq mi
ZIP Area
5
Density / Sq Mi
$63,333
Median Household Income
$30,259
Median Earnings
$840
Median Rent
$115,300
Median Home Value
Check the figures for this property
Cap Rate, Value Estimation, Potential NOI and more
View Realmo Analytics

Questions? Ask Rey
Realmo’s AI knows this listing — price, zoning, demand, history. Ask anything.
Frequently Asked Questions
What type of property is this?
Hunting land - Mostly timbered acreage with a natural spring and creek, plus a fixer-upper home for on-site living or redevelopment.
Where is this hunting land located?
The property is located at 406 Horner Drive Bradleyville, MO.
What is the asking price?
The asking price for this property is $319,900.
What are key features of this property?
This property features: 83+/- acre mostly wooded tract on the edge of Christian County with rolling terrain and hardwood tree cover; Natural spring plus wet weather creek along the southern edge provides water features on the property; Borders over 20,000 acres of Mark Twain National Forest along the northern border


