Flex Property with Overhead
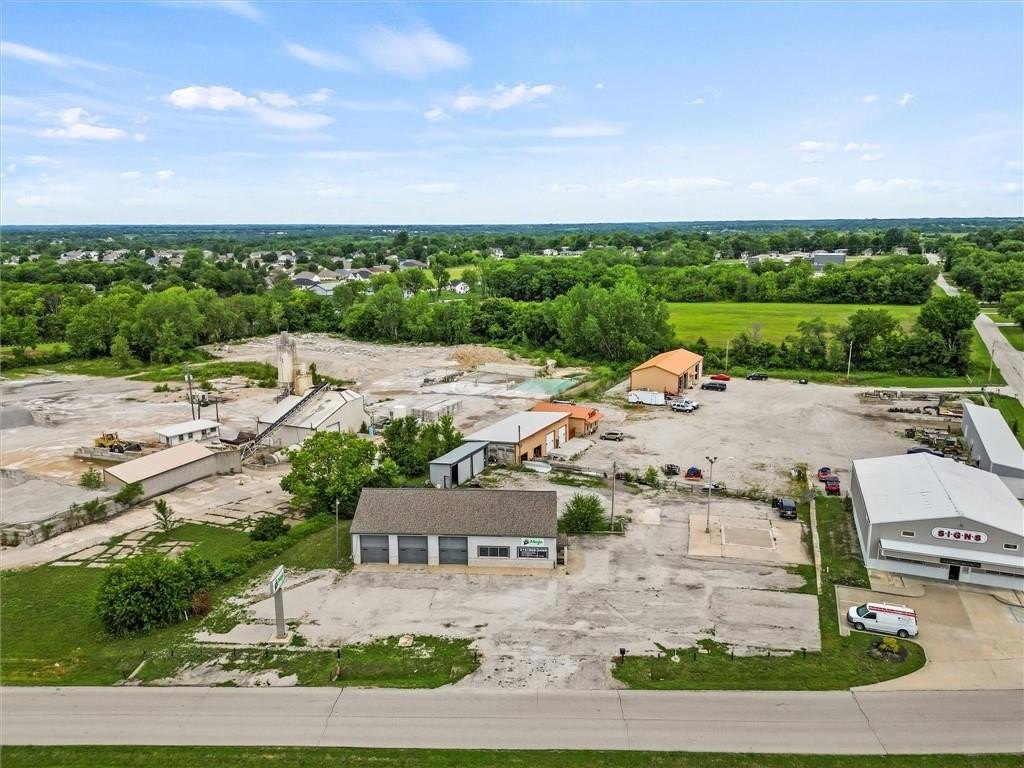
For Sale
$950,000
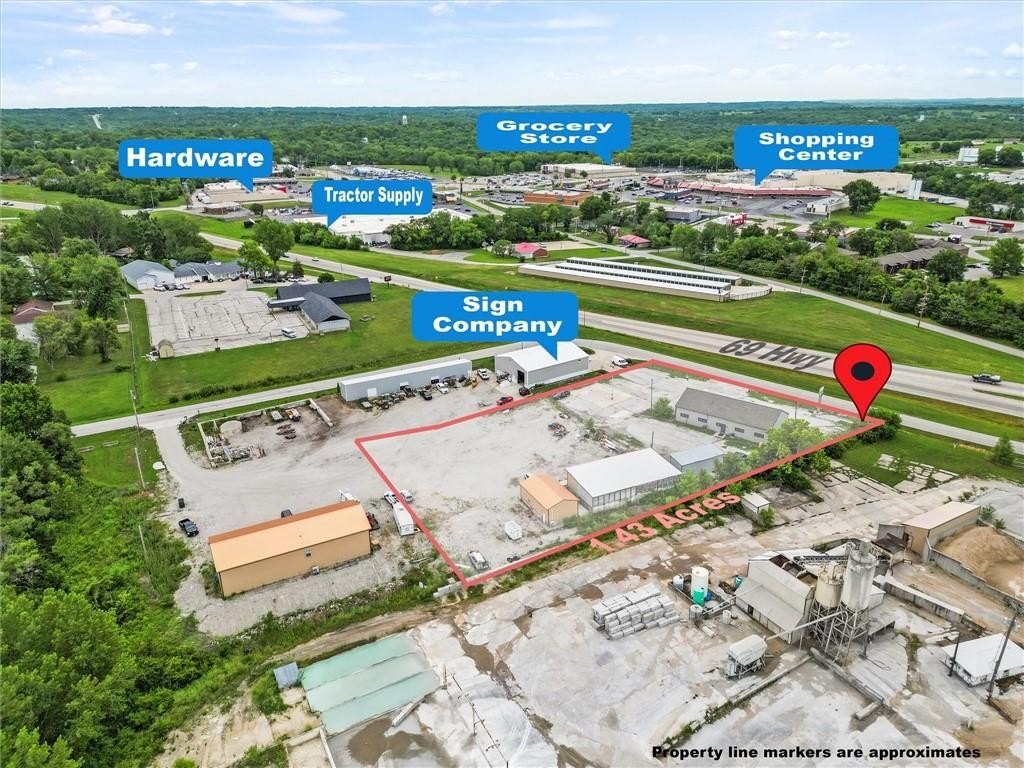
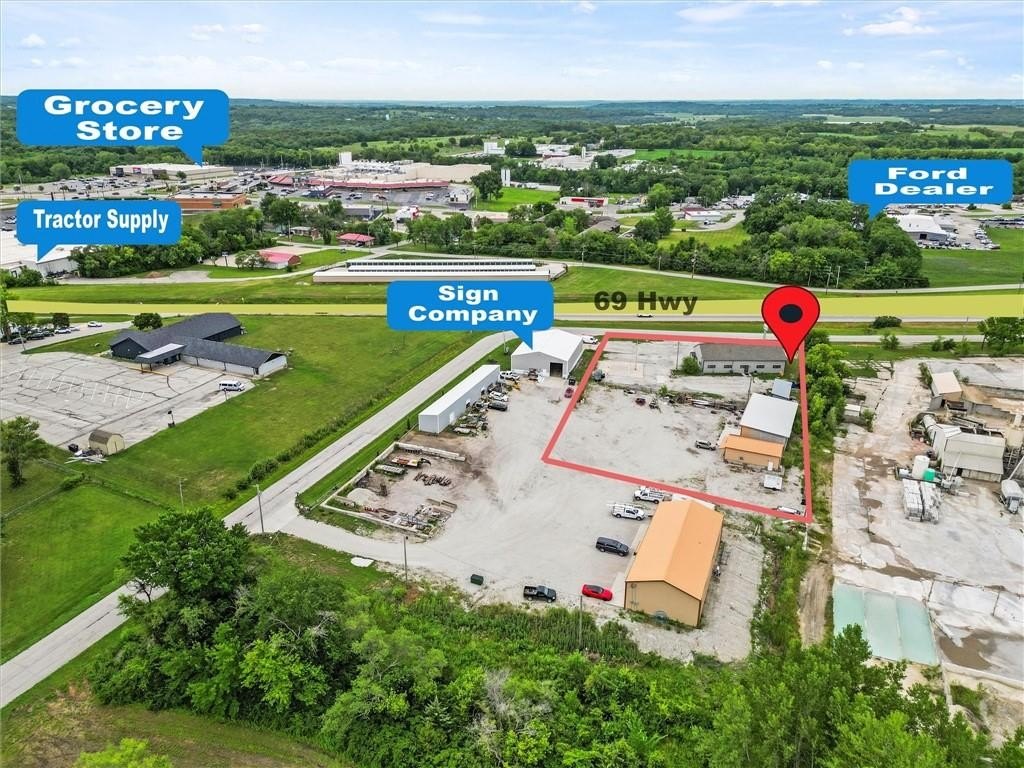
1900 W US 69 Highway, Excelsior Springs, MO 64024
Commercial Sale, Excelsior Springs, MO
Property SizeContact for details
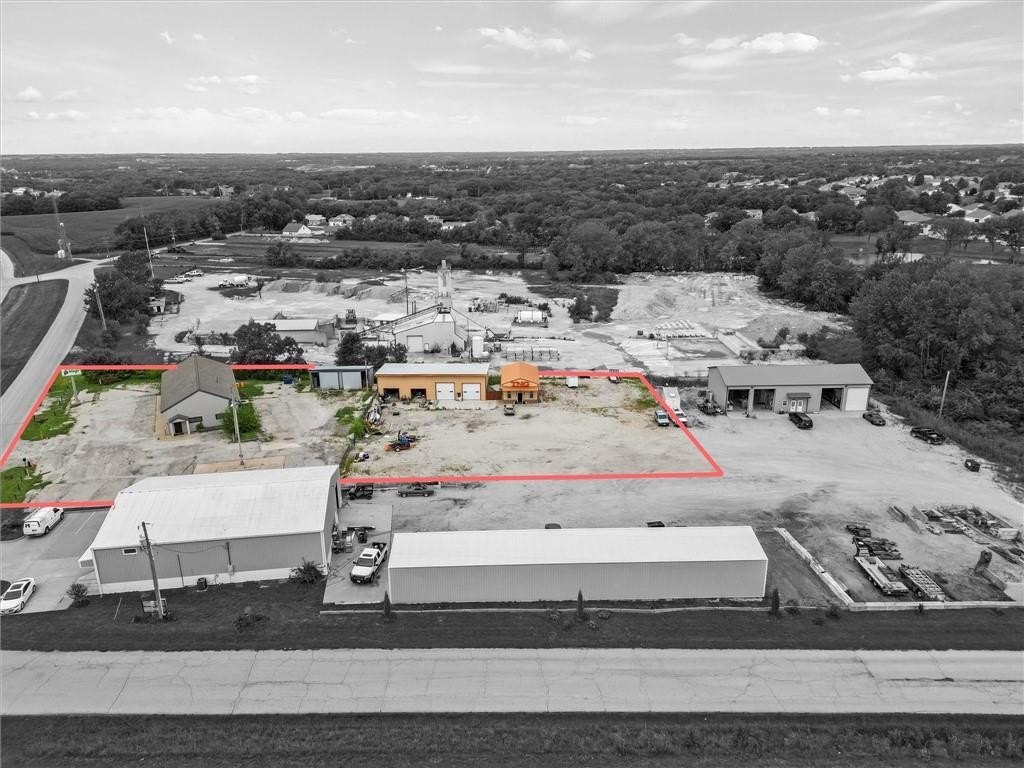
Lot Size1.43 Acres
Days on Market1172
Property Features for 1900 W US 69 Highway
General Information
Property type
Commercial Sale
Property subtype
Other
Zoning
M-2
Parking features
Parking Lot, Paved or Surfaced, Garage
Interior features
Storage, Private Restroom, Public Restroom
Exterior features
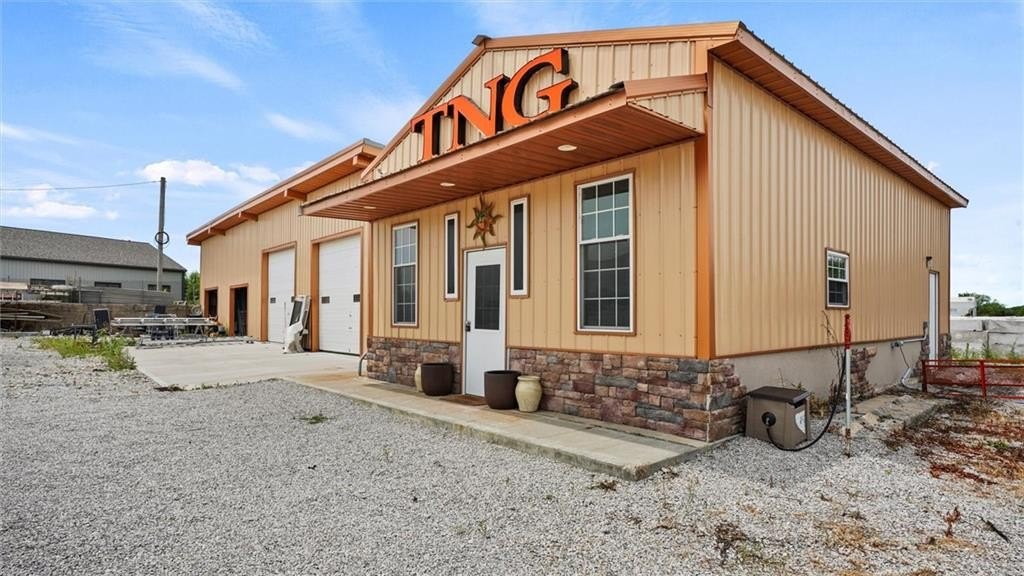
Building Sign
Directions
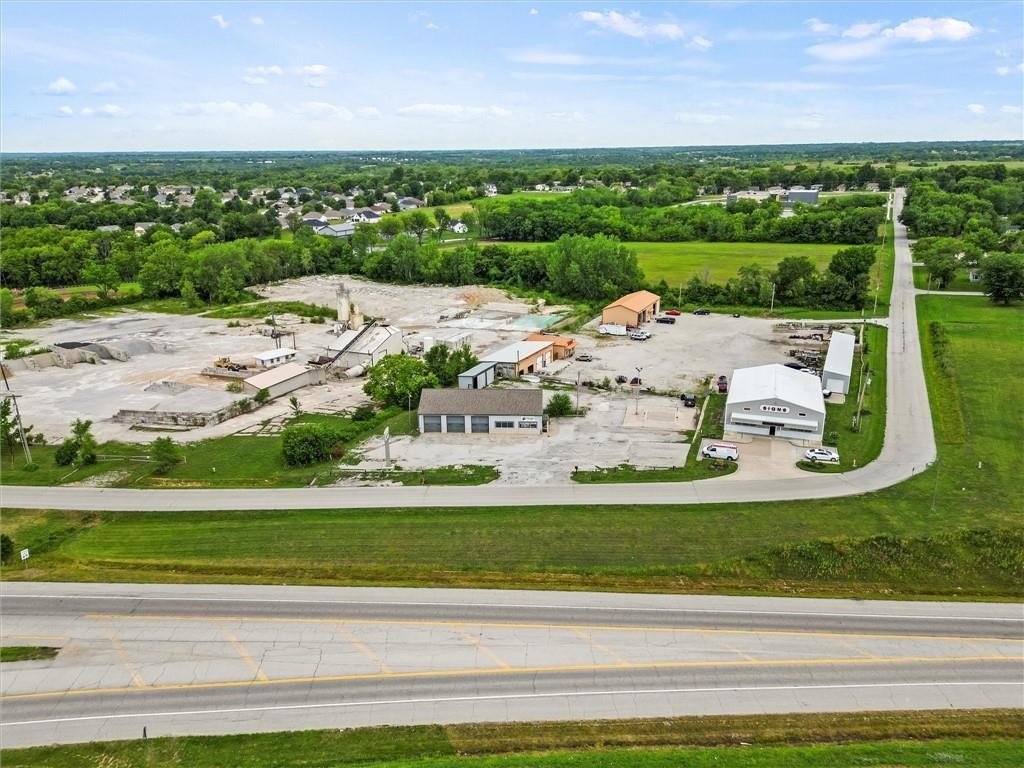
69 Hwy into Excelsior Springs, right on Lodwick Lane, property on left.
Subdivision
107 - East of I-35 & South of Hwy 92
Standard status
Active
APN
12-212-00-05-004.00
Lot size
1.43 Acres
Taxes and HOA fees
Tax Description
Lot 1A MODOT Hwy barn.
Tax Annual Amount
2934
Legal Description
Lot 1A MODOT Hwy barn.
Utilities
Utilities
Water Available
Amenities
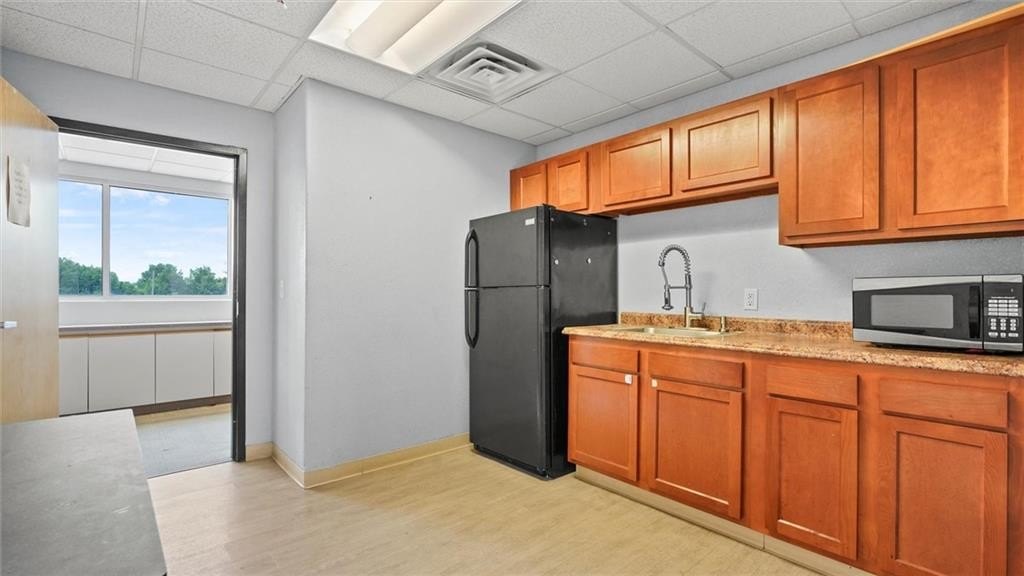
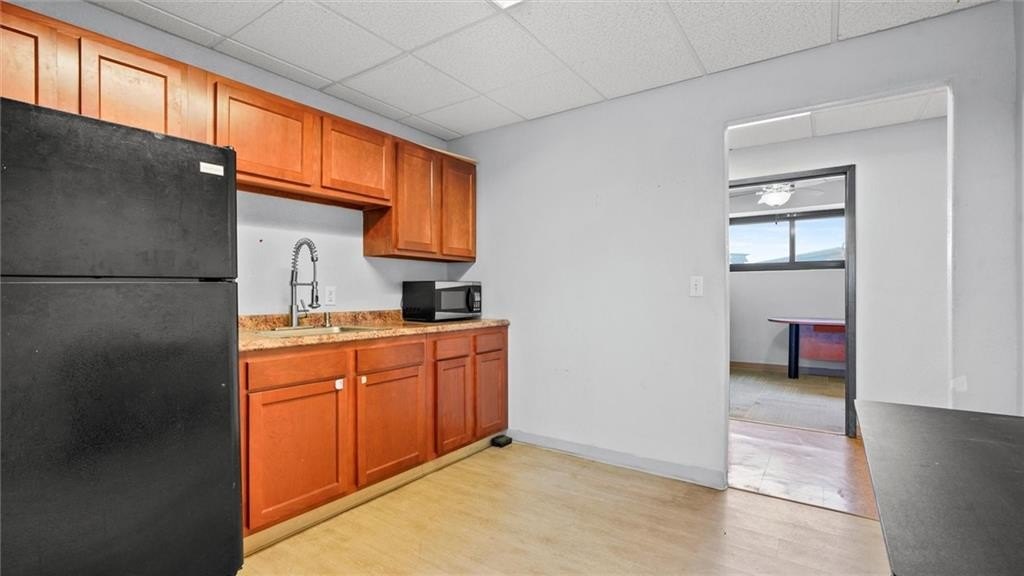
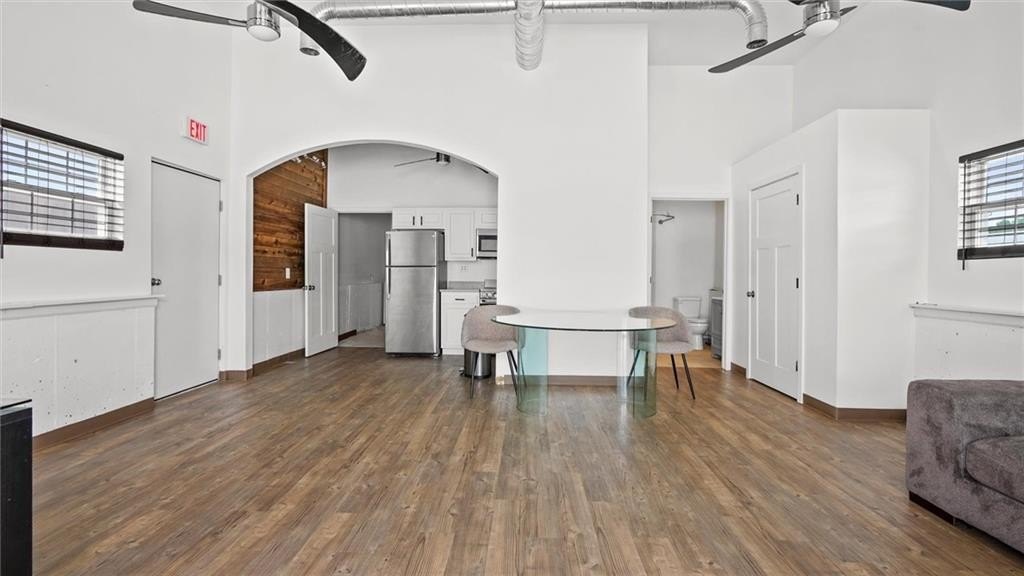
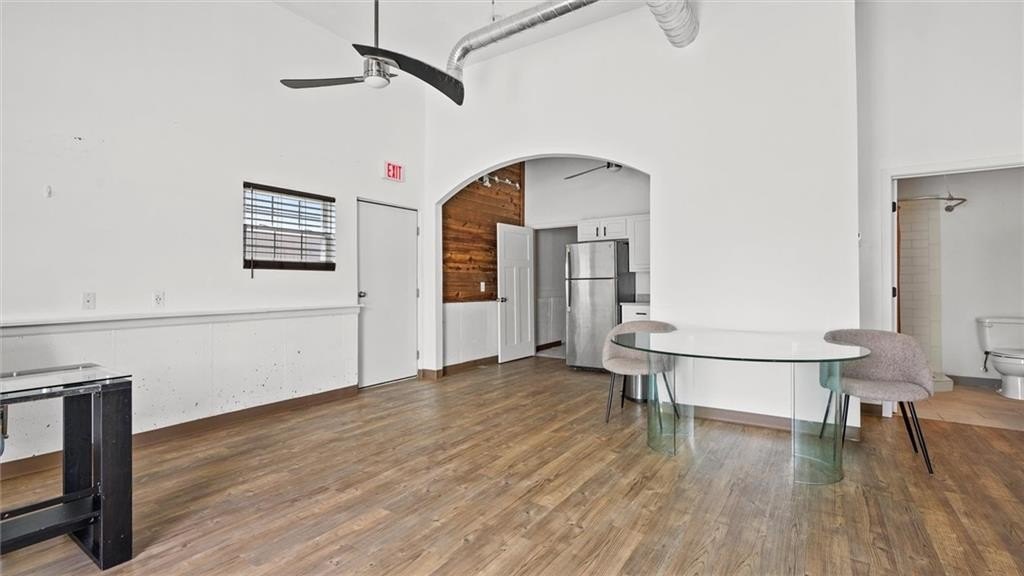
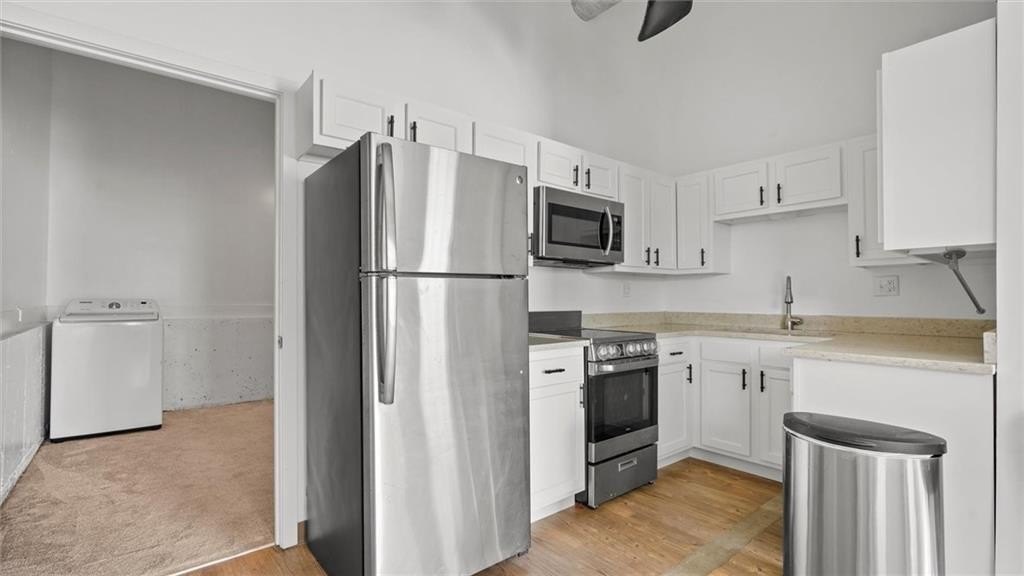
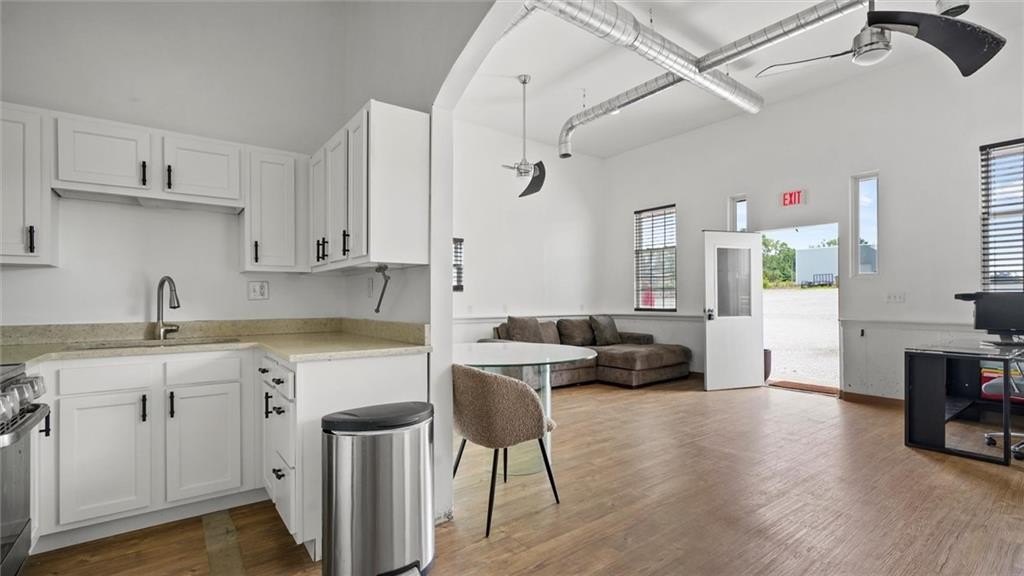
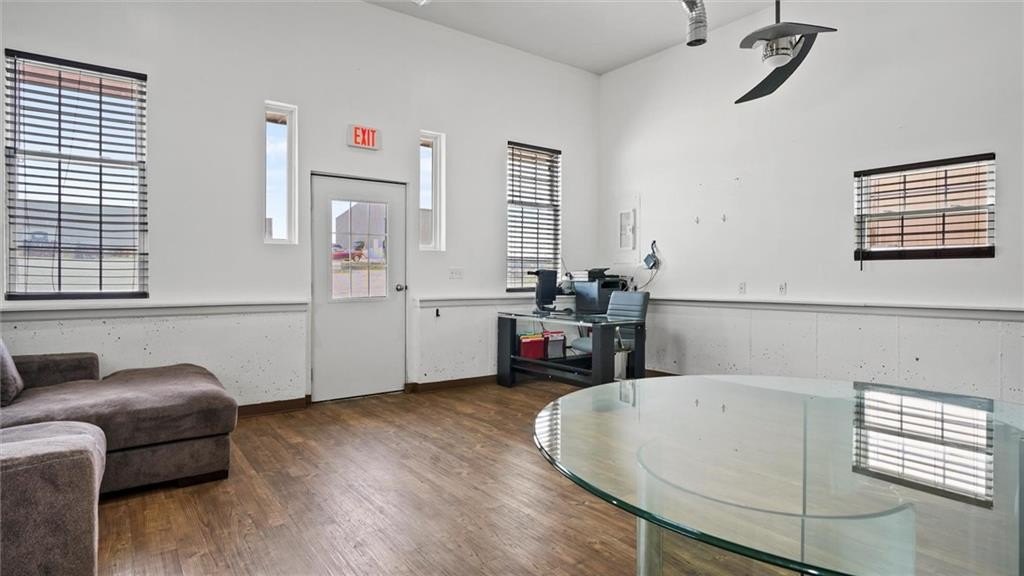
kitchen area
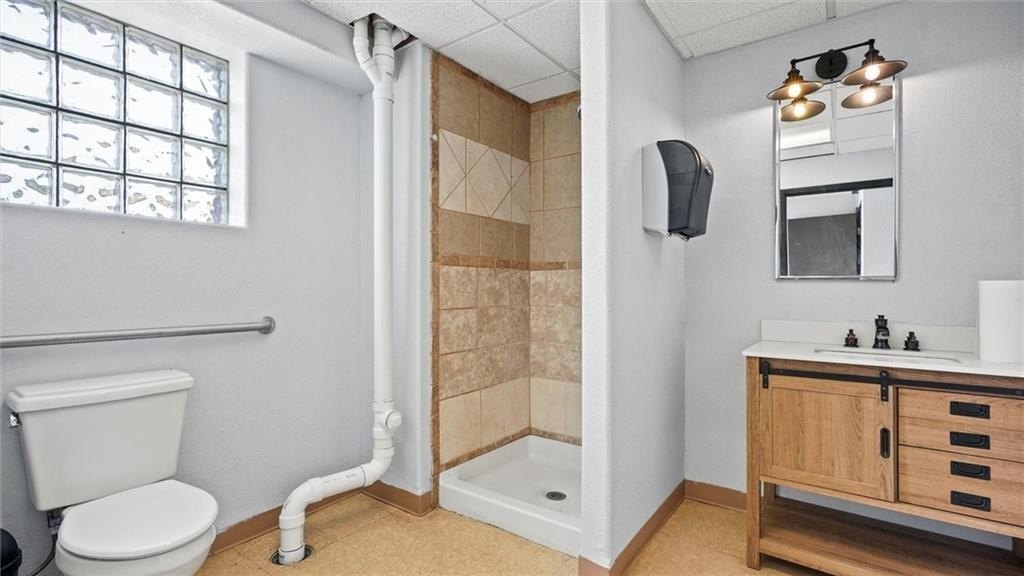
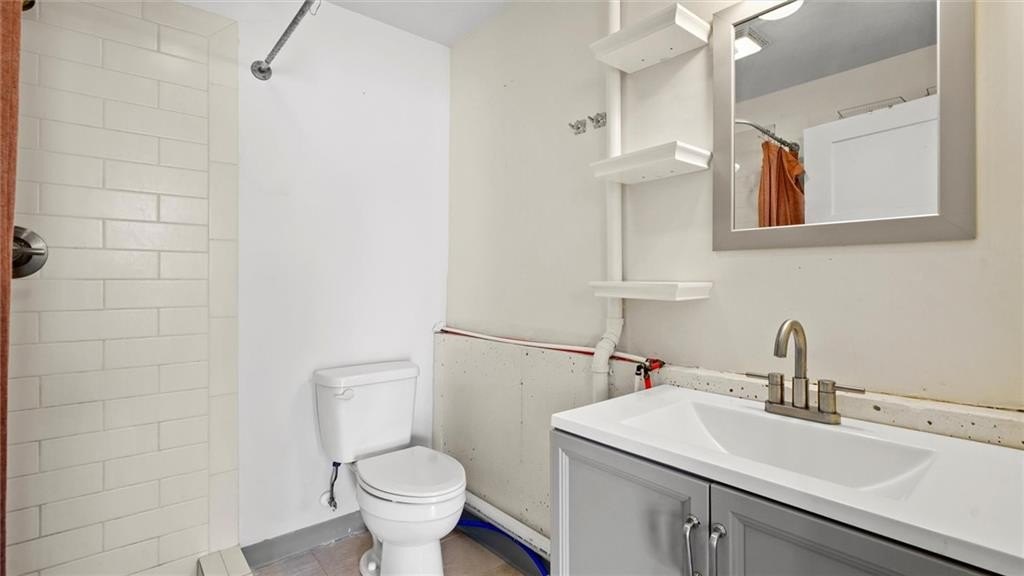
full bath with shower
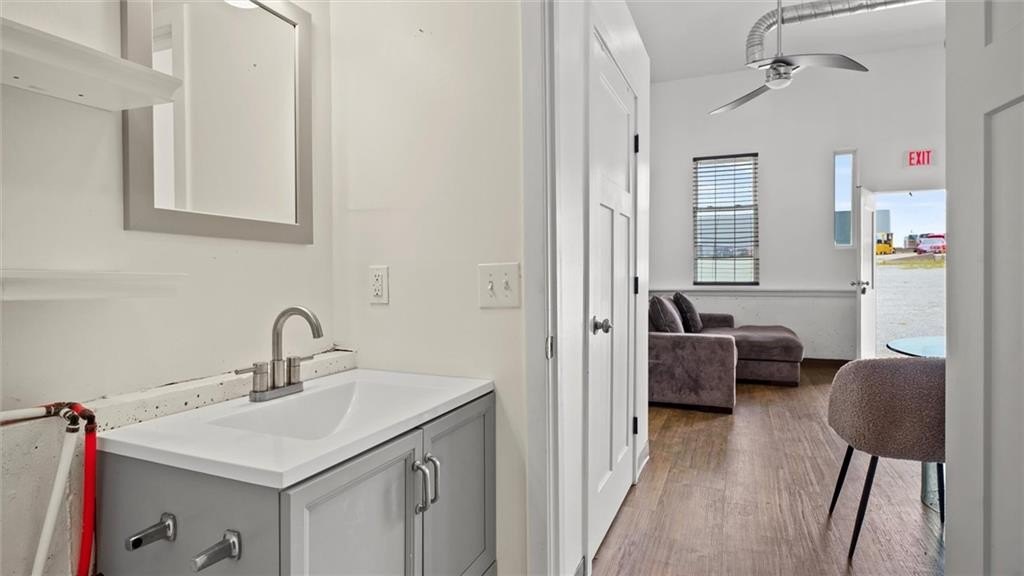
mini kitchen
full bath
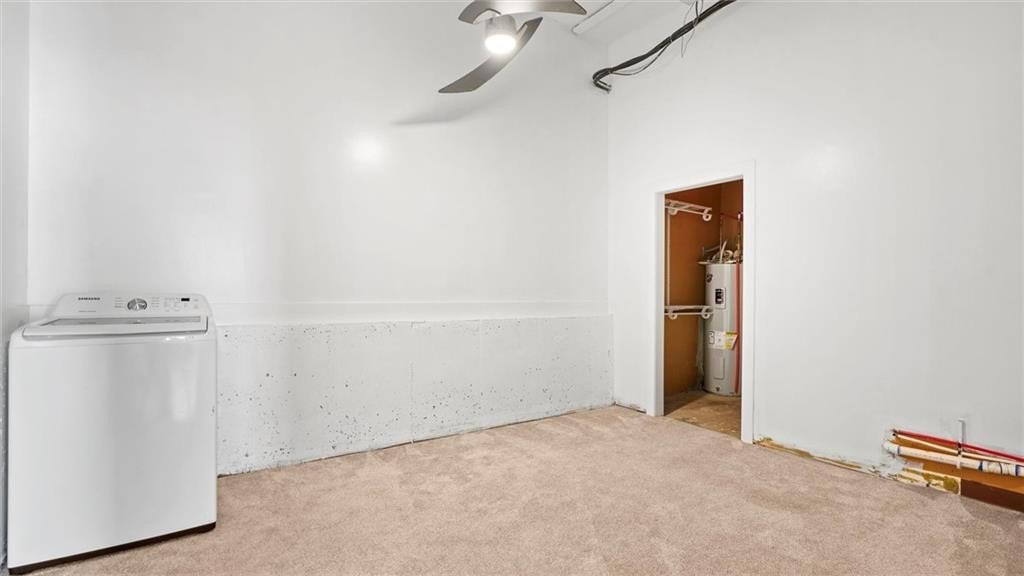
storage area
Building Details
Year built
1955
Additional Structures
Storage
Listing Agency:
RE/MAX Area Real Estate · RE/MAX International
(816) 630-4000
Listed By:
SimmonsSales Team
(816) 820-2463
Added: Jul 12, 2023
Changed: Sep 13
Last Checked: Sep 25 at 9:06PM
MLS# 2444804
Copyright © 2026 Heartland Multiple Listing Service. All rights reserved. All information provided by the listing agent/broker is deemed reliable but is not guaranteed and should be independently verified.
Investment Insights
Based on property information with market context.
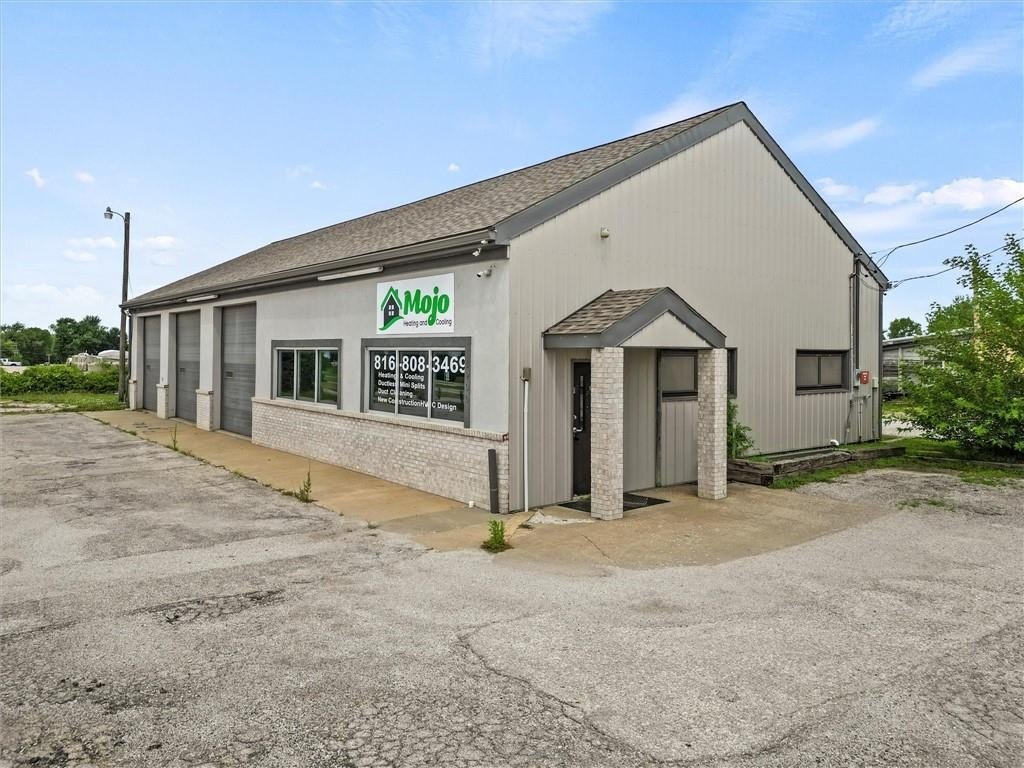
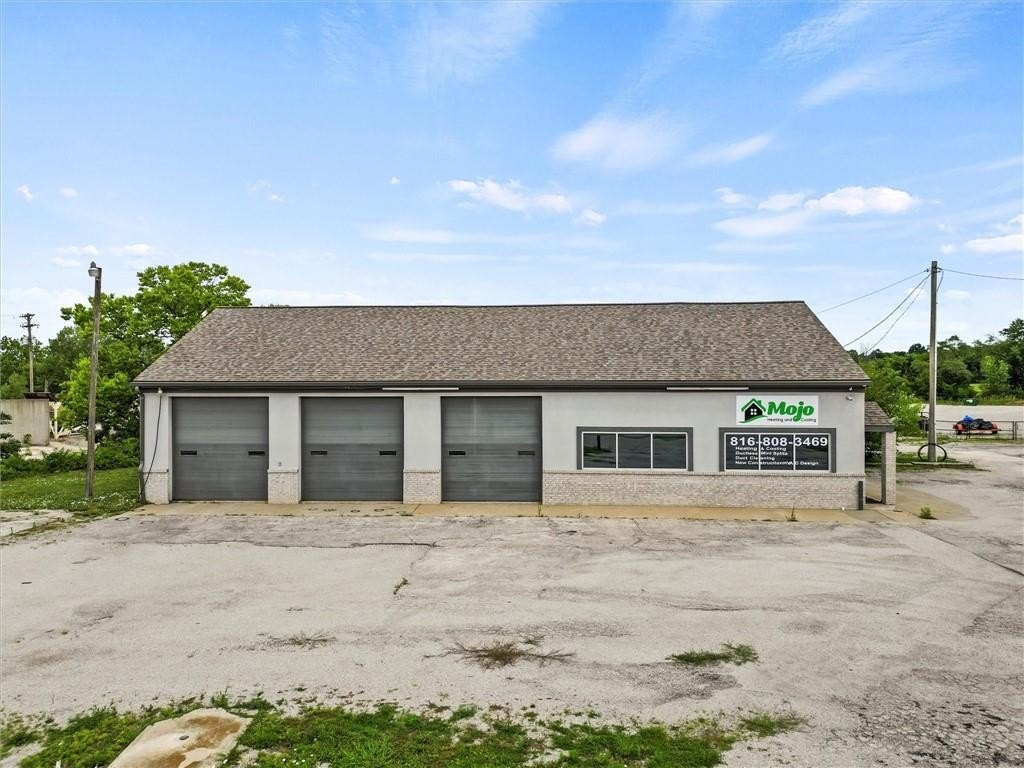
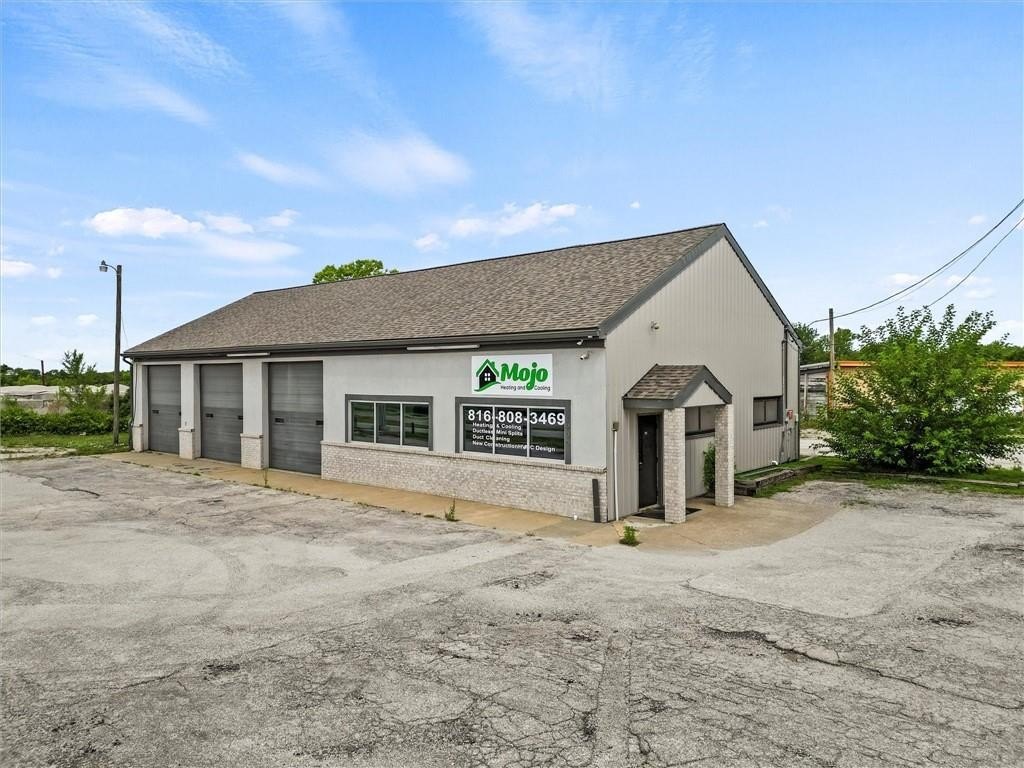
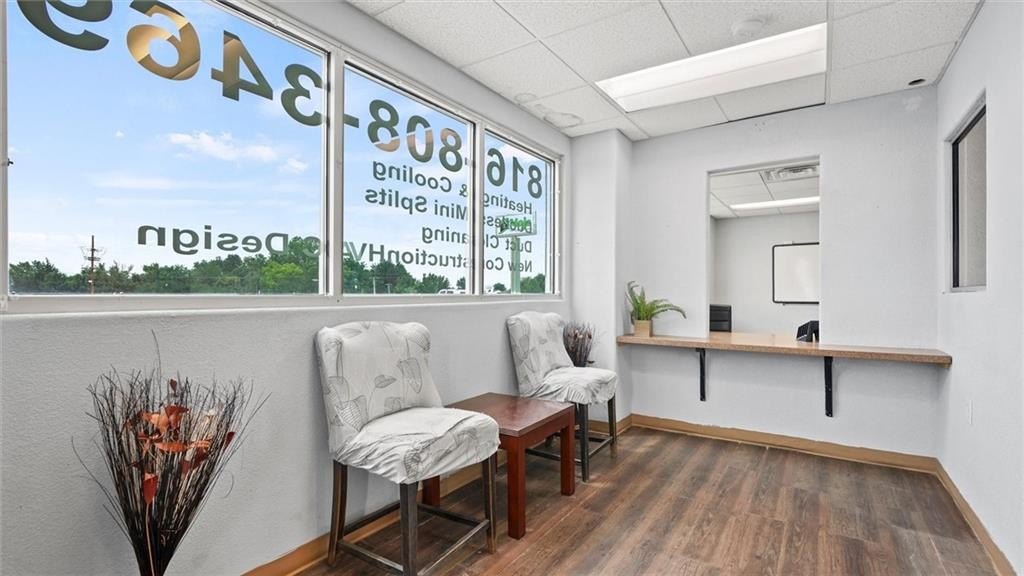
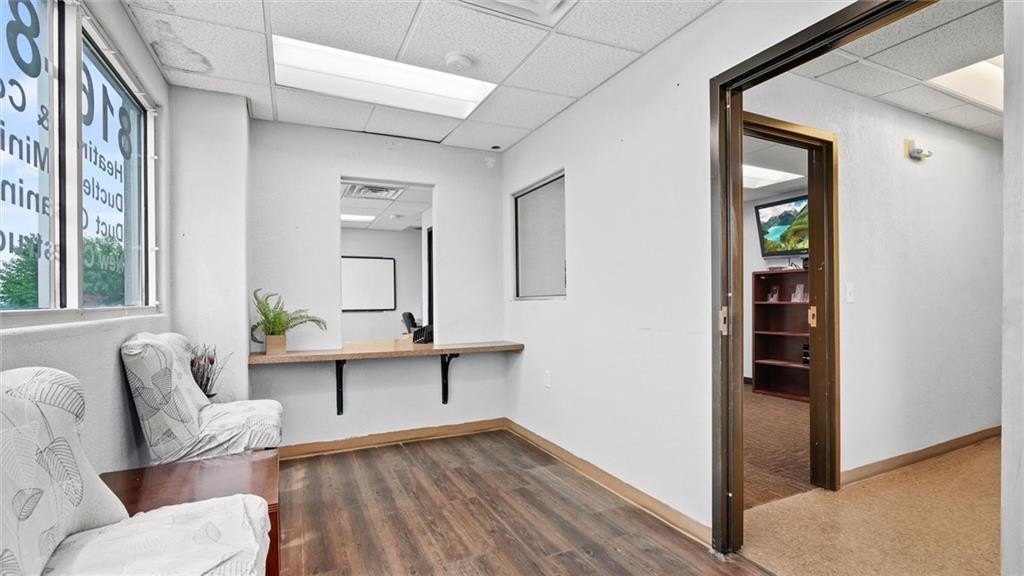
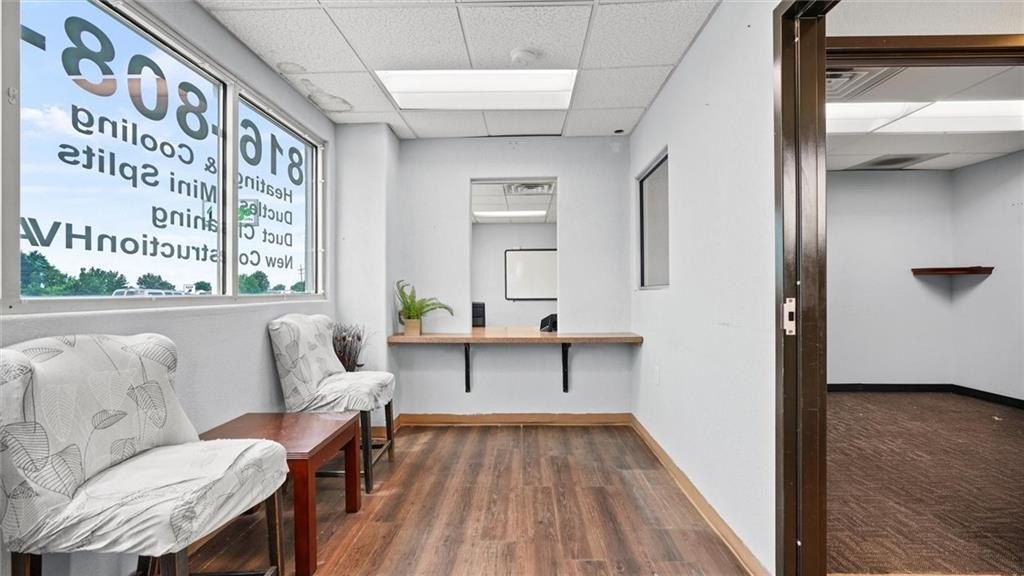
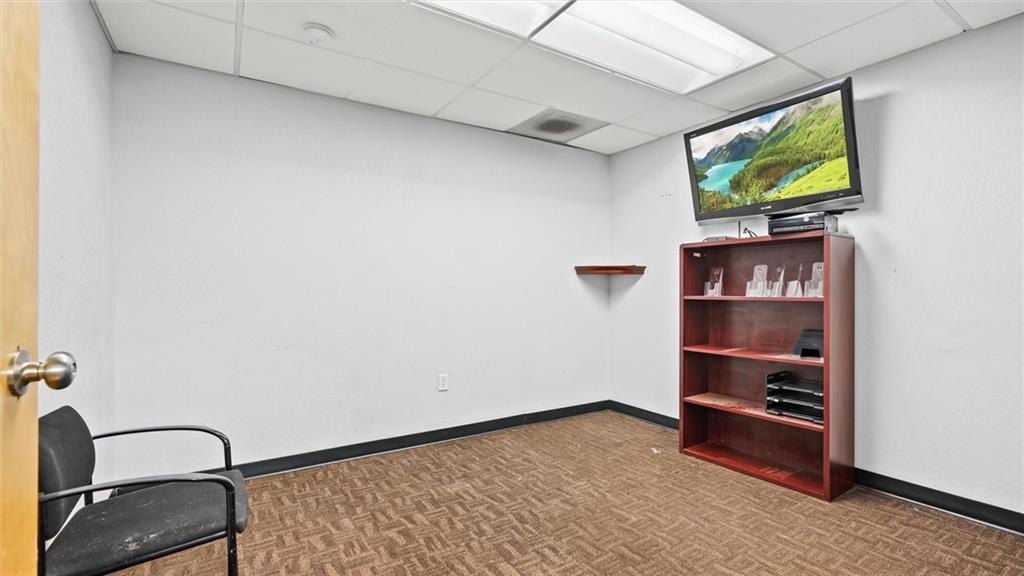
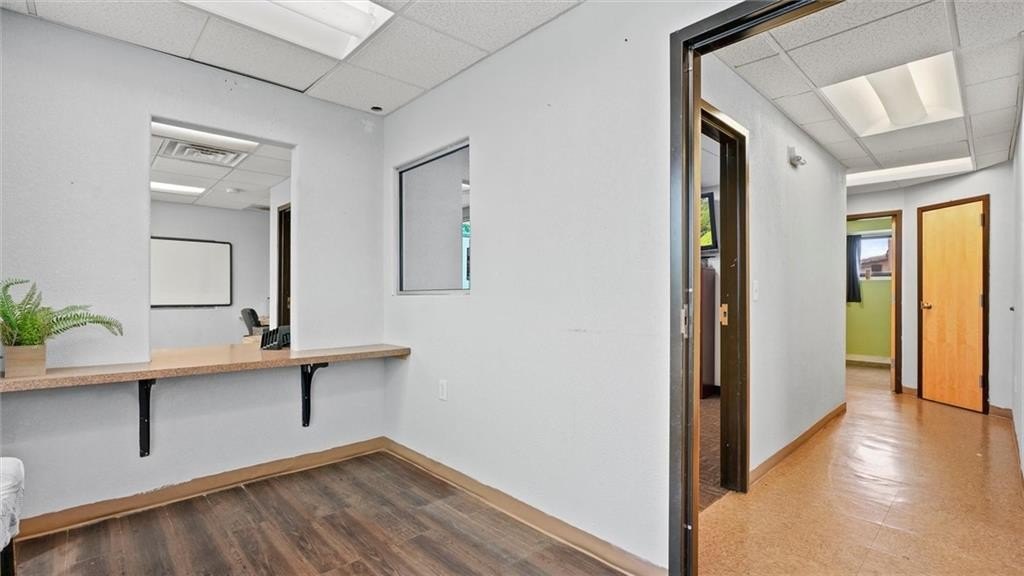
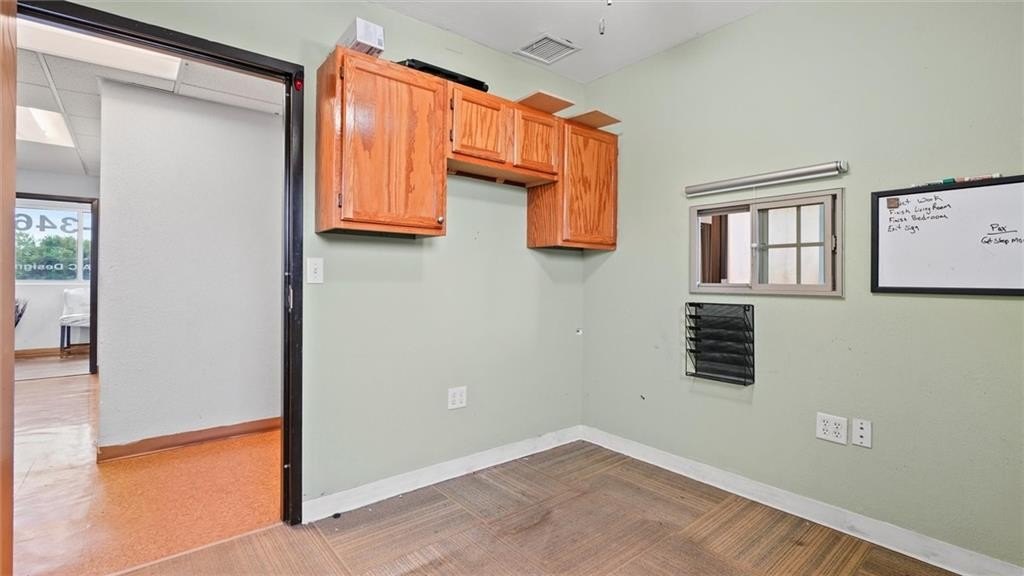
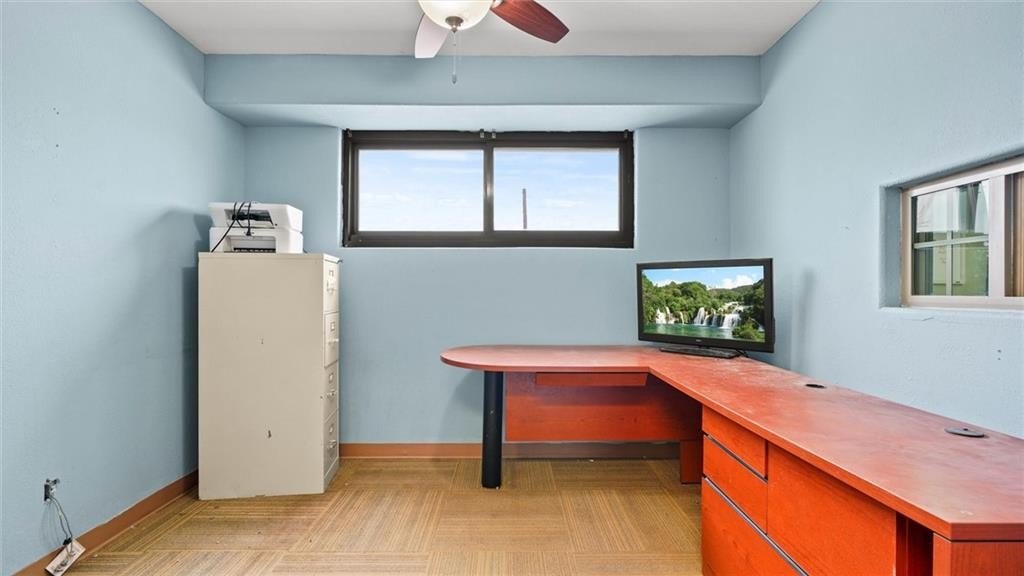
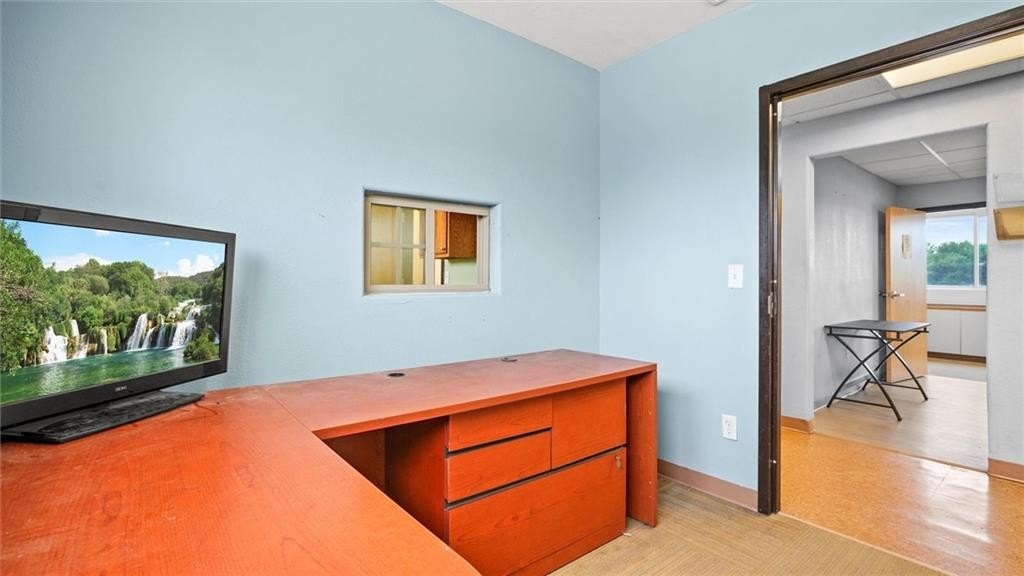
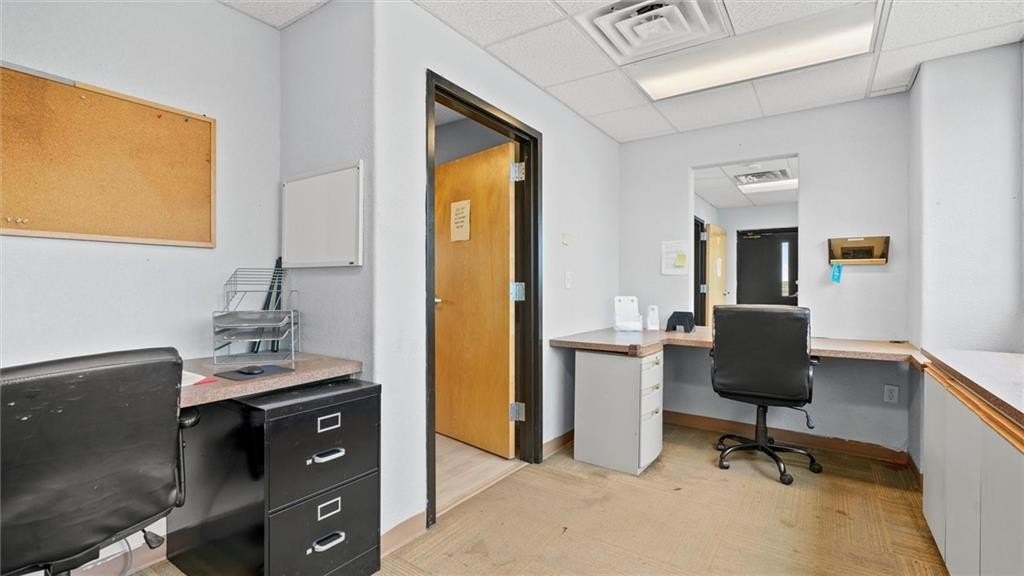
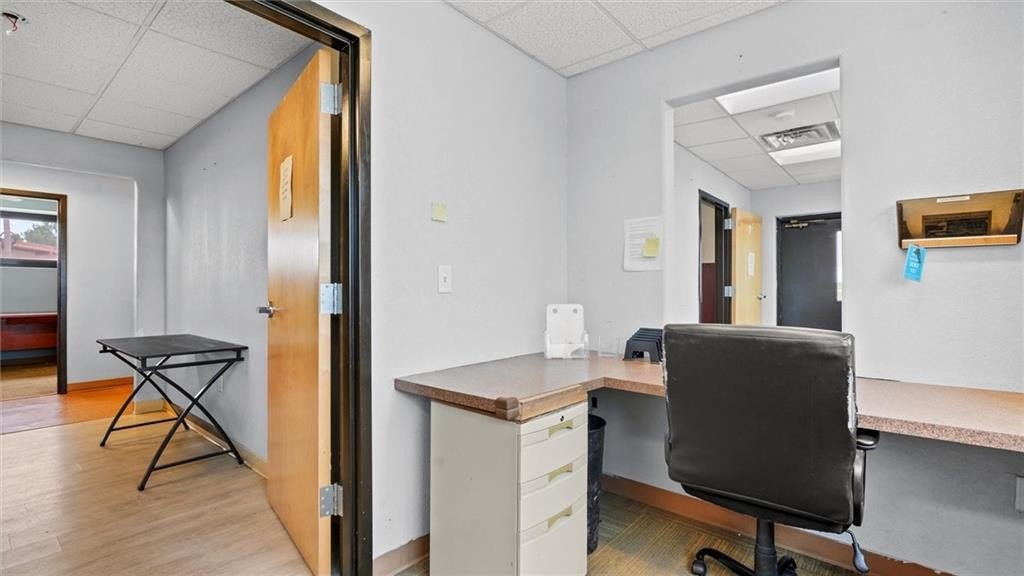
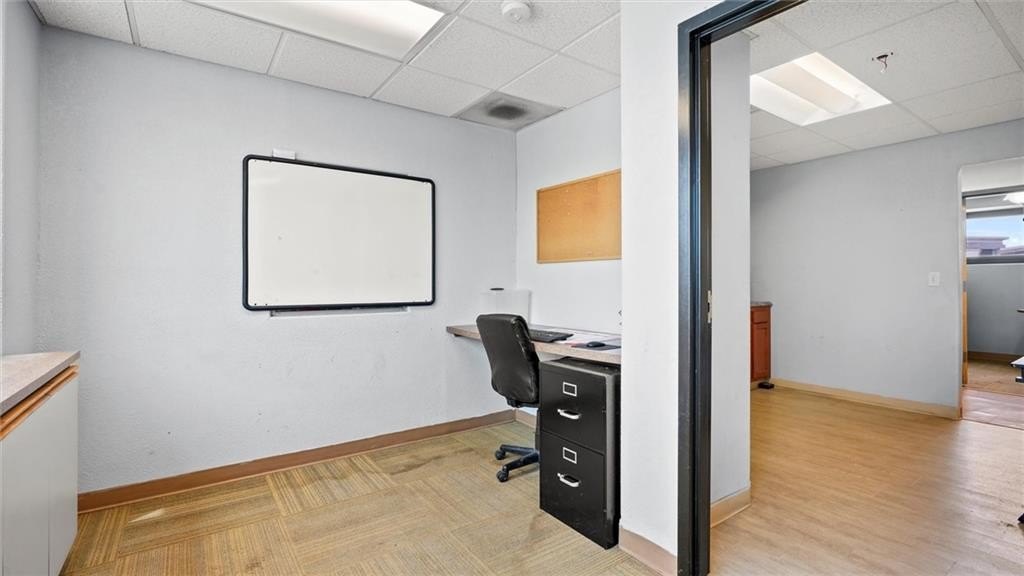
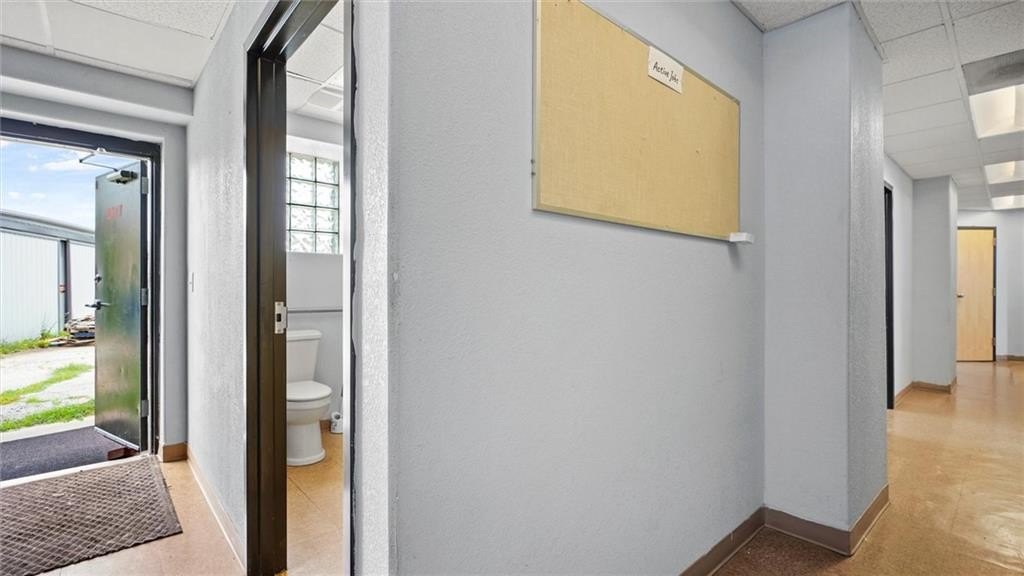
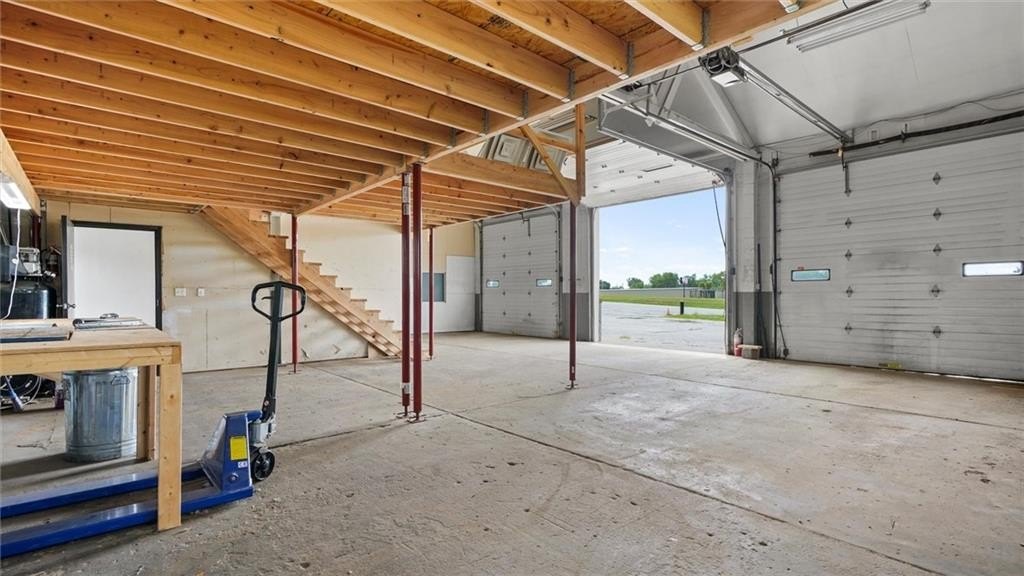
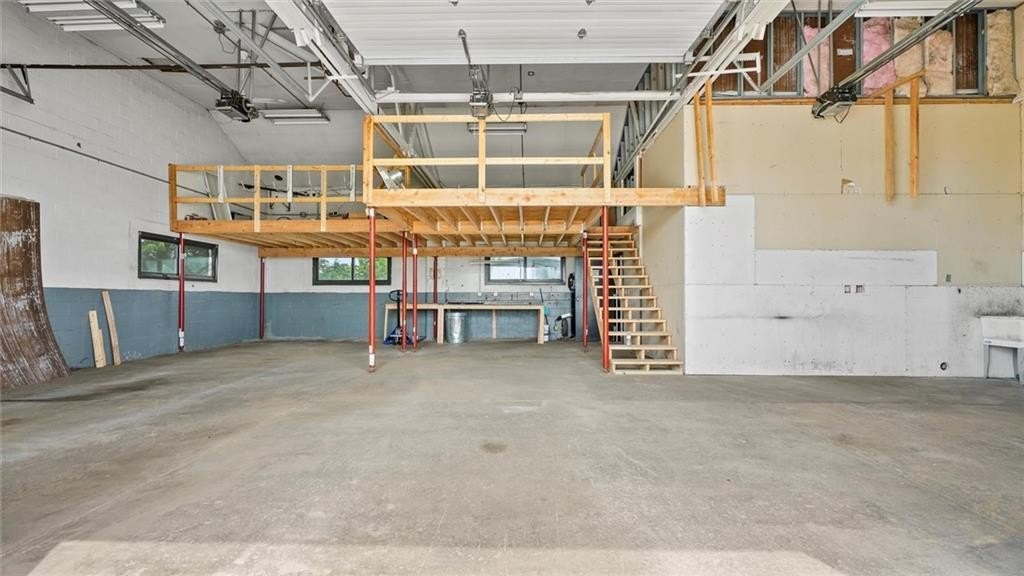
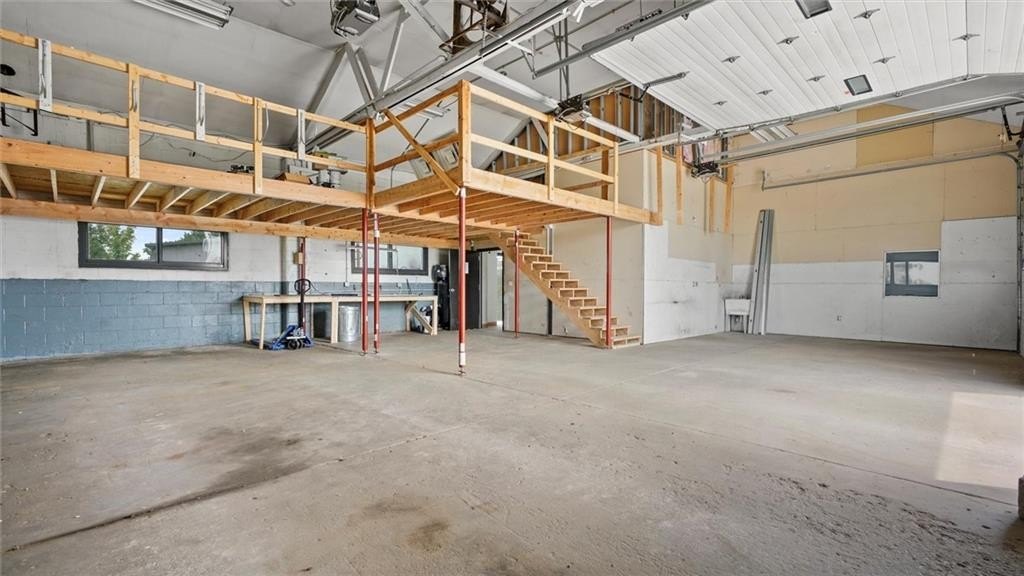
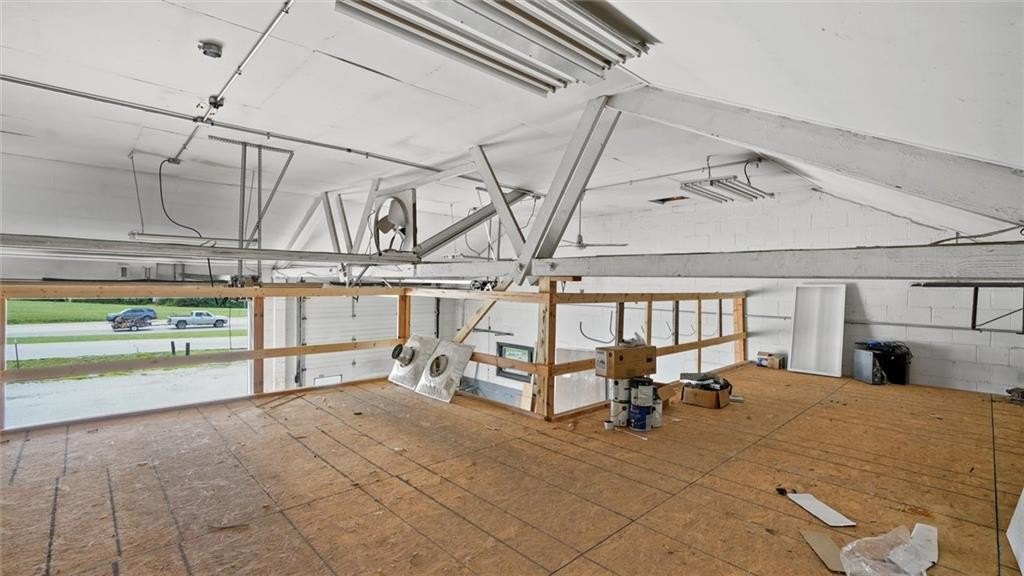
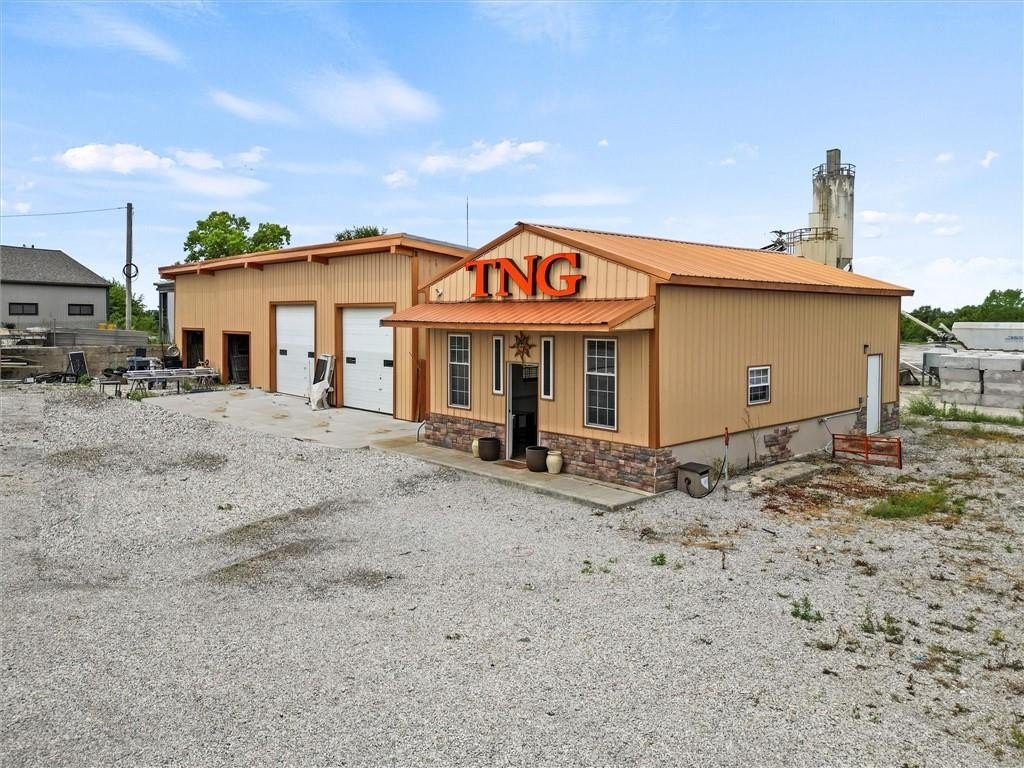
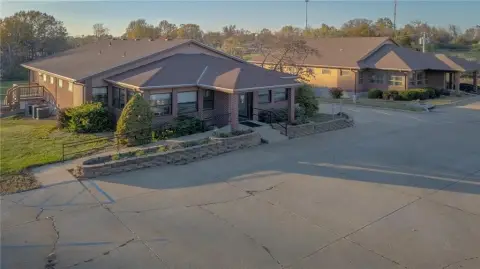
This M-2-zoned flex property comprises multiple buildings on 1.43 acres at 1900 W US 69 Highway. The primary 2,700-square-foot building includes a shop, approximately 1,400 square feet of office area, a kitchen, and a full bathroom with shower. Its shop area is equipped with three insulated motorized overhead doors measuring 11 feet wide by 12 feet high, plus storage above two bays. Two 200-amp breaker boxes serve the main building.
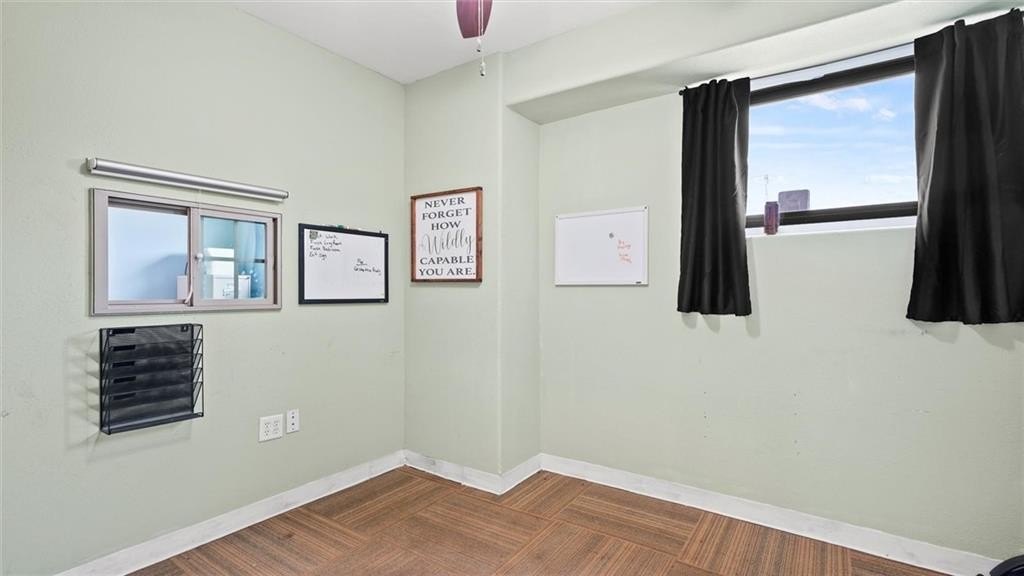
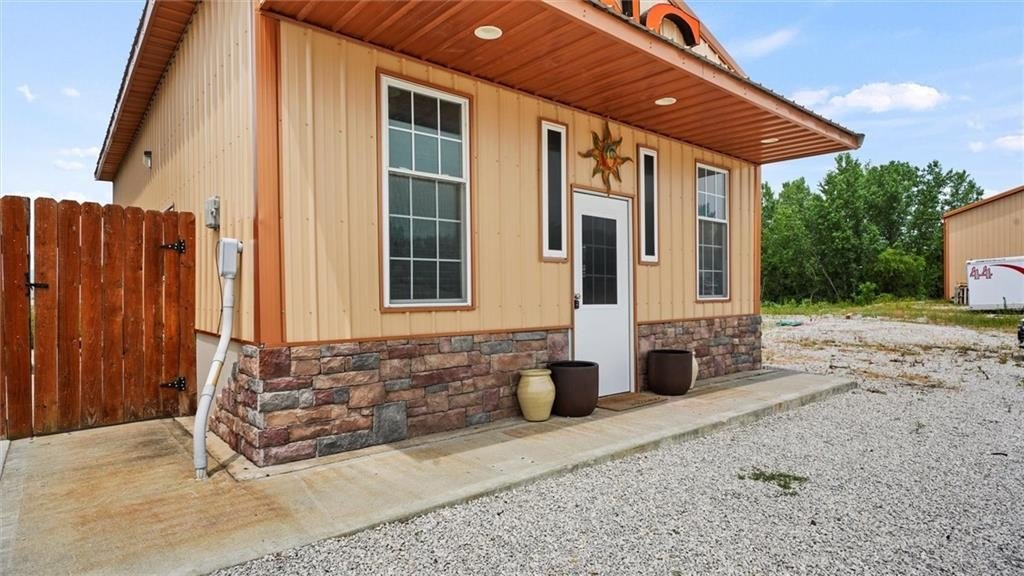
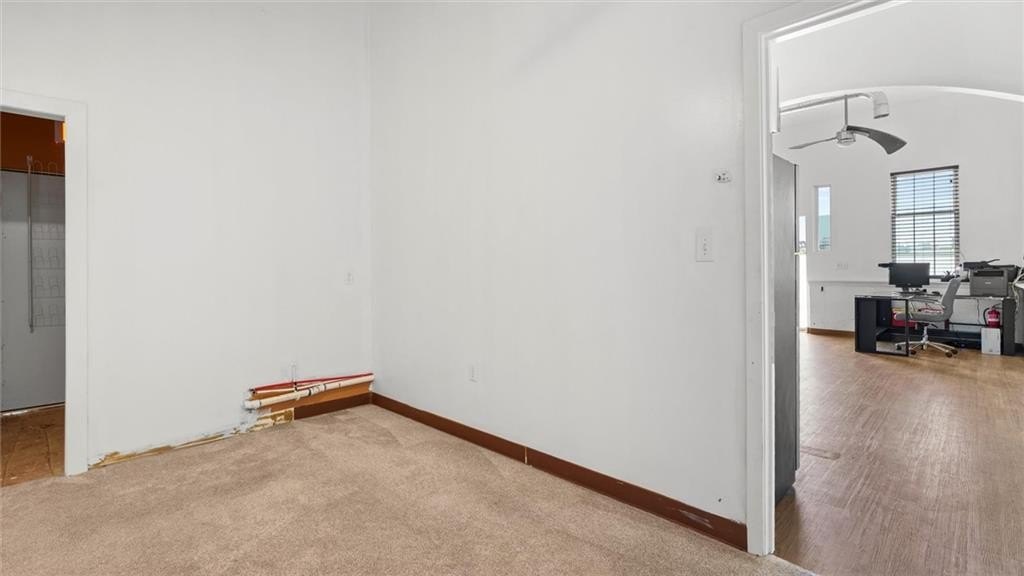
Additional improvements include a storage building with sliding metal doors, a separate four-bay storage building with garage doors at two bays, and a 750-square-foot office building with a mini kitchen, full bathroom, and storage area. The property has two entrances, paved parking, garage parking, building signage, and water available. Built in 1955, it provides a combination of office, shop, and storage space with direct access to US 69 Highway.
Additional improvements include a storage building with sliding metal doors, a separate four-bay storage building with garage doors at two bays, and a 750-square-foot office building with a mini kitchen, full bathroom, and storage area. The property has two entrances, paved parking, garage parking, building signage, and water available. Built in 1955, it provides a combination of office, shop, and storage space with direct access to US 69 Highway.
Key Highlights
- 1.43‑acre M‑2‑zoned flex property with multiple commercial buildings
- 2,700‑square‑foot primary building with approximately 1,400 square feet of office space
- Three insulated motorized overhead doors measuring 11 feet wide by 12 feet high
Property Analytics
Unlock full access to Insights
Subscribe to Realmo Intelligence
Open Analytics
Current Use
Lease Details
2
Office units
Yes
Highway access
Yes
Paved road access
Location Intelligence
Trade Area within ½ mile
275
Businesses Nearby
Balanced
Demand for This Use
Explore this area
Business Placement
Demographics for 64024, MO
15,575
Population
6,165
Households
2.5
Avg Household Size
42
Median Age
15%
College-Educated
89%
High-School Grad
70.4 sq mi
ZIP Area
221
Density / Sq Mi
$80,781
Median Household Income
$41,964
Median Earnings
$916
Median Rent
$185,200
Median Home Value
Check the figures for this property
Cap Rate, Value Estimation, Potential NOI and more
View Realmo Analytics
Market
Vacancy Rate% for Office in Midwest region

Questions? Ask Rey
Realmo’s AI knows this listing — price, zoning, demand, history. Ask anything.



Frequently Asked Questions
What type of property is this?
Flex space - M-2-zoned property combines office, shop, and storage improvements across multiple buildings.
Where is this flex space located?
The property is located at 1900 W US 69 Highway Excelsior Springs, MO.
What is the asking price?
The asking price for this property is $950,000.
What are key features of this property?
This property features: 1.43‑acre M‑2‑zoned flex property with multiple commercial buildings; 2,700‑square‑foot primary building with approximately 1,400 square feet of office space; Three insulated motorized overhead doors measuring 11 feet wide by 12 feet high


