Remodeled Retail
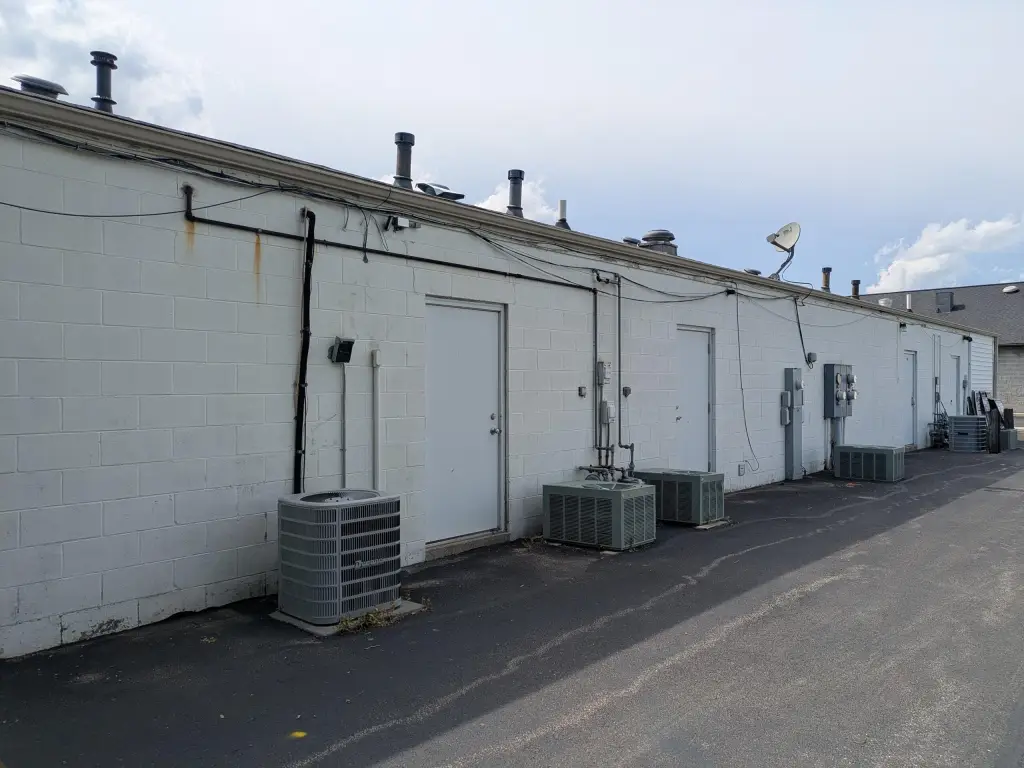
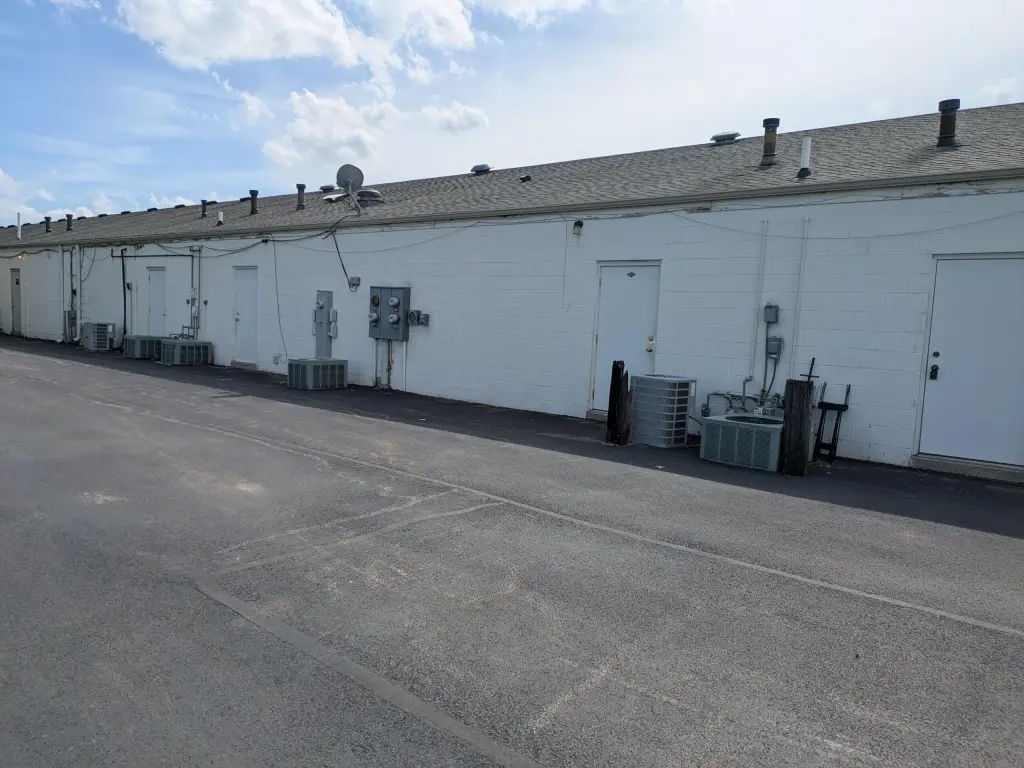
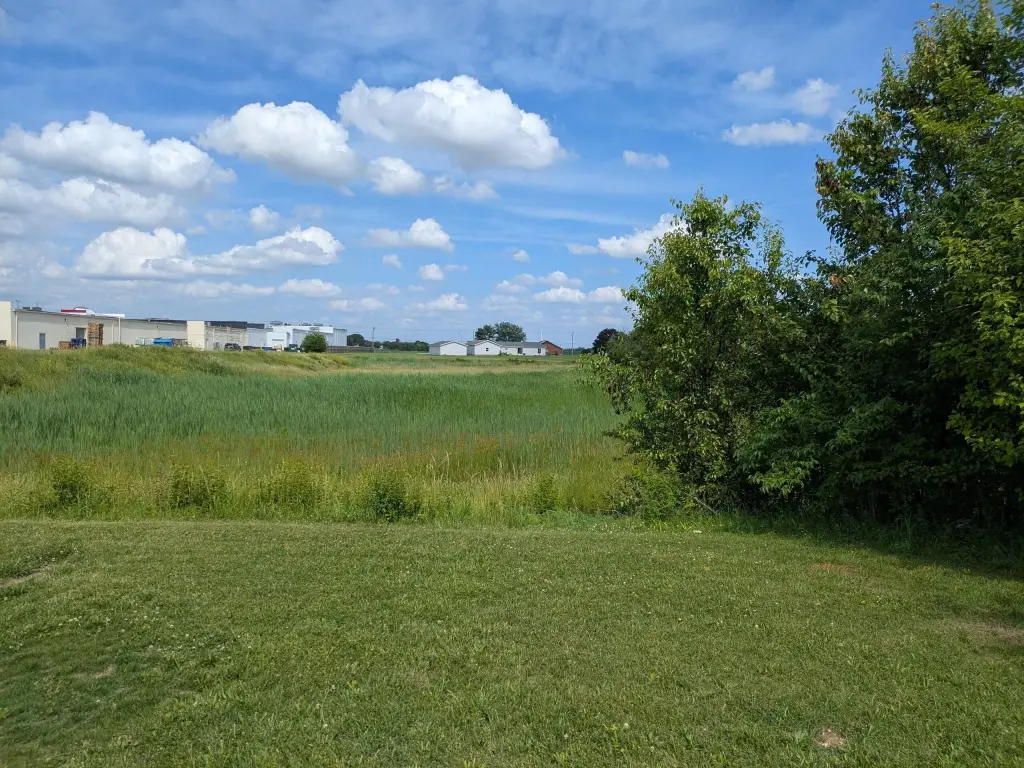
For Sale
$249,950
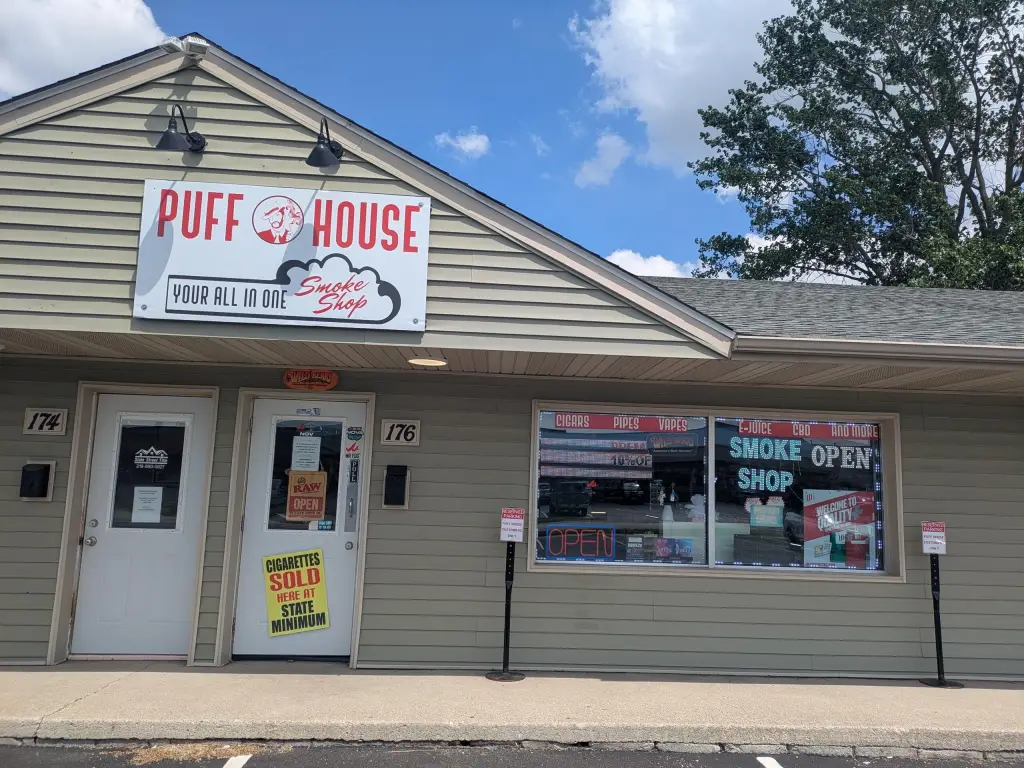
176 Deanna Drive, Lowell, IN 46356
Commercial Sale, Lowell, IN
Property Size1,023 SF
Lot Size0.07 Acres
Price / SF$244.33
Days on Market119
Property Features for 176 Deanna Drive
General Information
Property type
Commercial Sale
Property subtype
Retail
Parking
24
Parking features
Off Street
Interior features
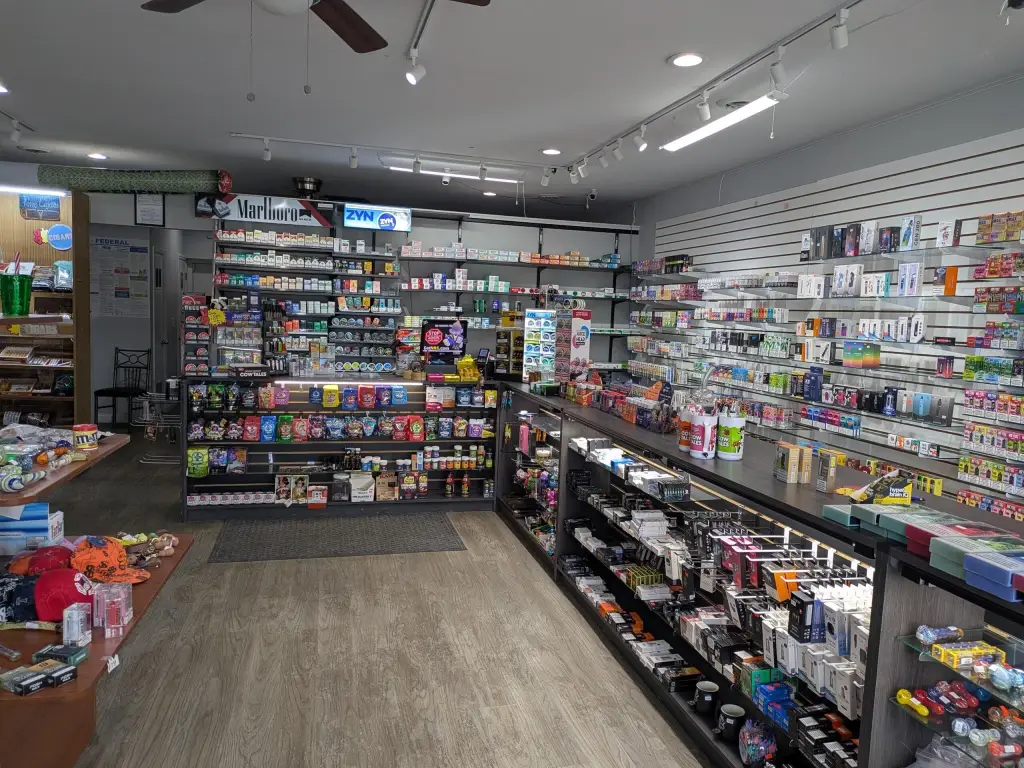
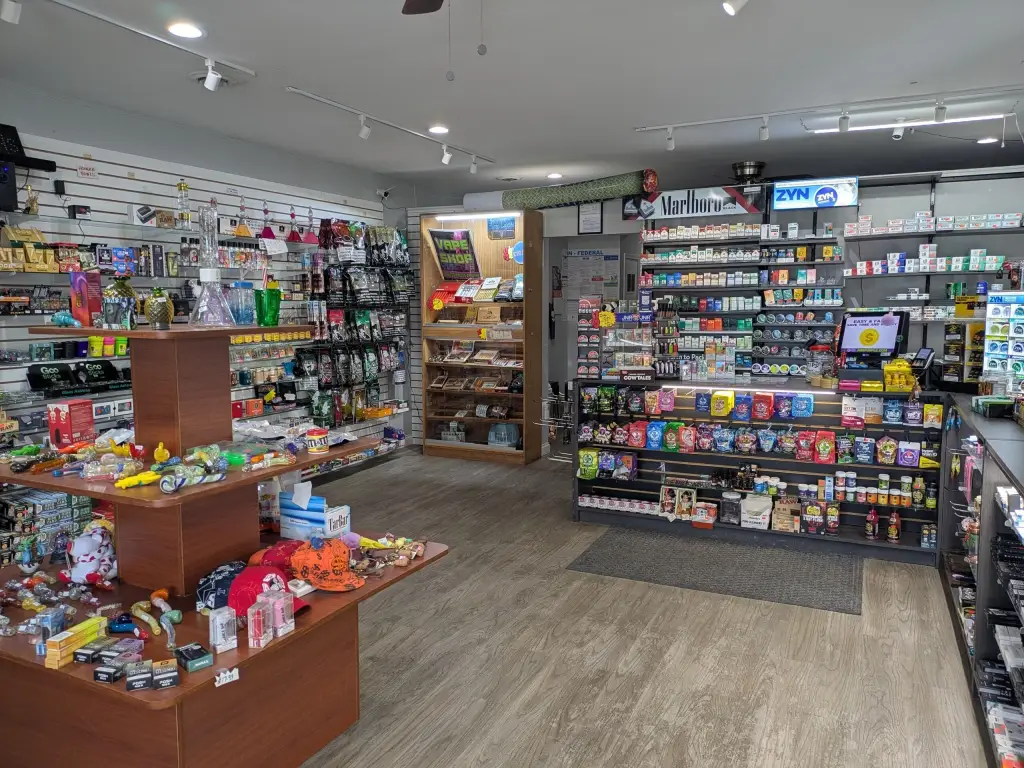
Ceiling Fan(s), Vaulted Ceiling(s), Open Floorplan
Exterior features
Lighting, Rain Gutters
Subdivision
Hoffman Manor
Directions
Commercial Ave / St Rd 2 to Deanna Dr (Stoplight between Centier Bank & Georges Restaurant across from Highschool...South to unit on East side of street next to Aurelios and across from Don Dells Restaurant
Standard status
Active
APN
451925227018000008
Size
1,023 SF
Lot size
0.07 Acres
Taxes and HOA fees
Tax Year
2025
Tax Description
HOFFMAN MANOR S.20.66FT OF LOT 6
Tax Annual Amount
1283
Legal Description
HOFFMAN MANOR S.20.66FT OF LOT 6
Utilities
Utilities
Cable Available
Sewer type
Public Sewer
Heating system
Forced Air
Water source
Public
Amenities
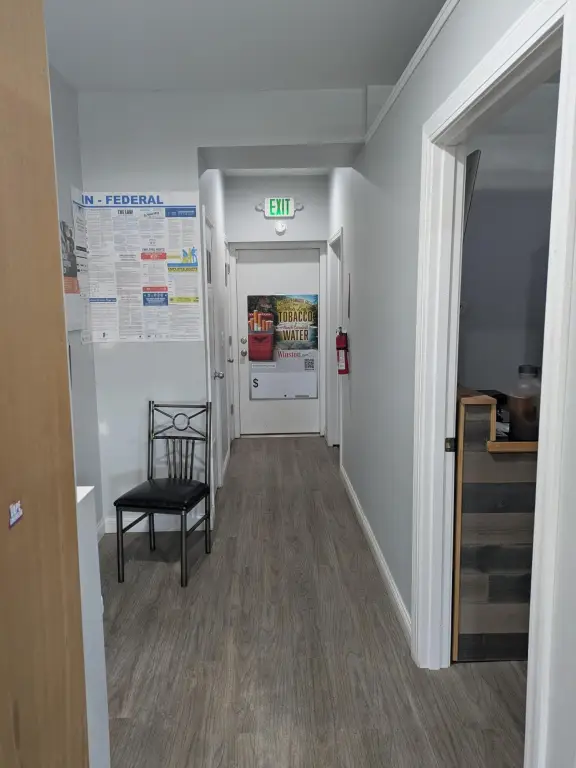
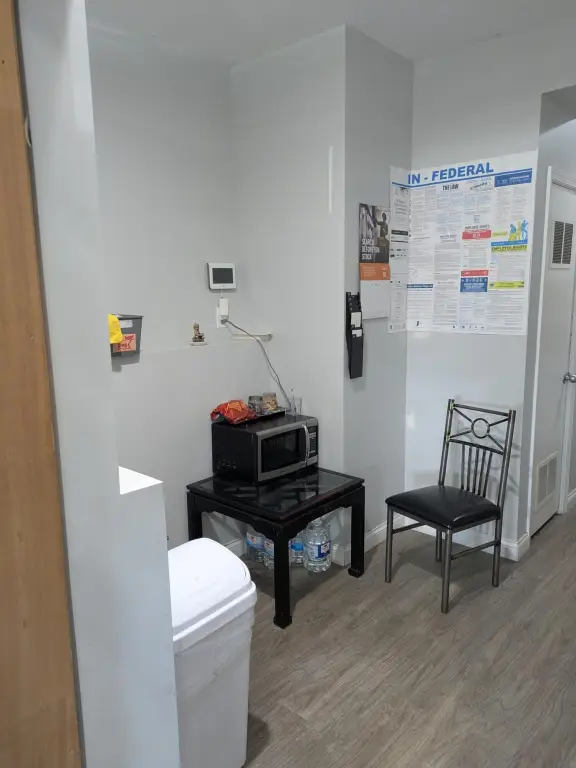
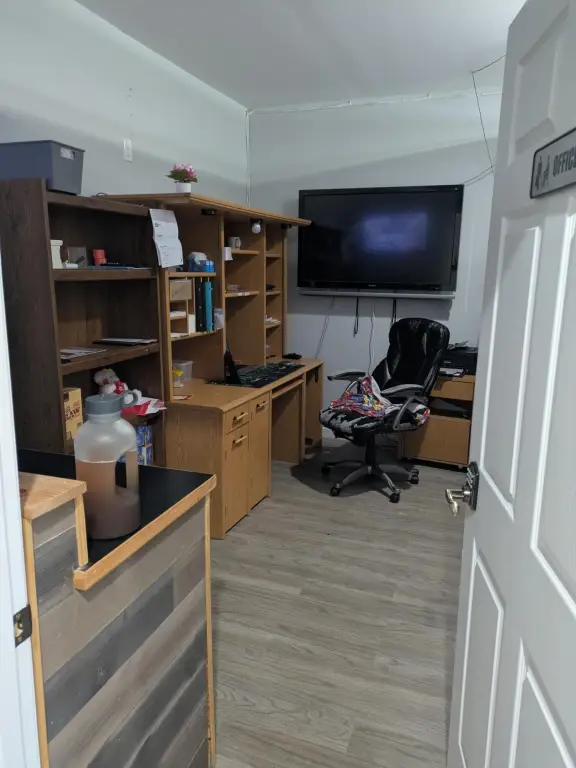
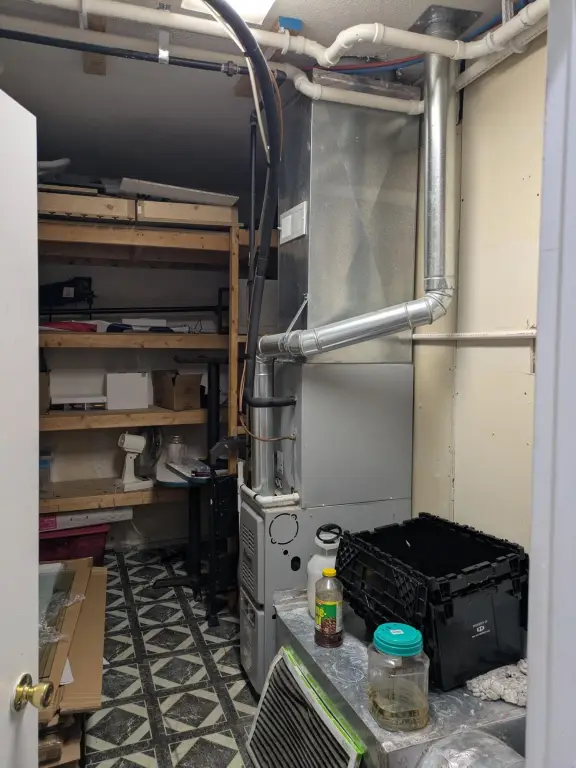
private rear storage
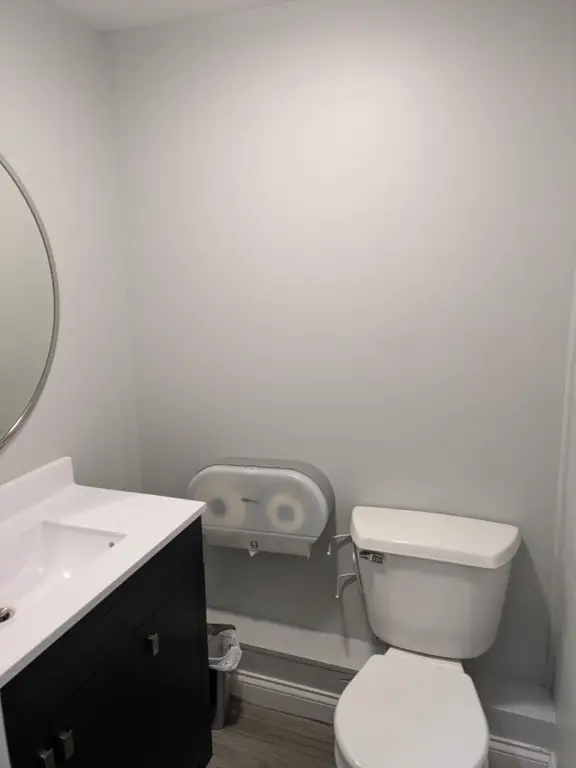
restroom
laundry facilities
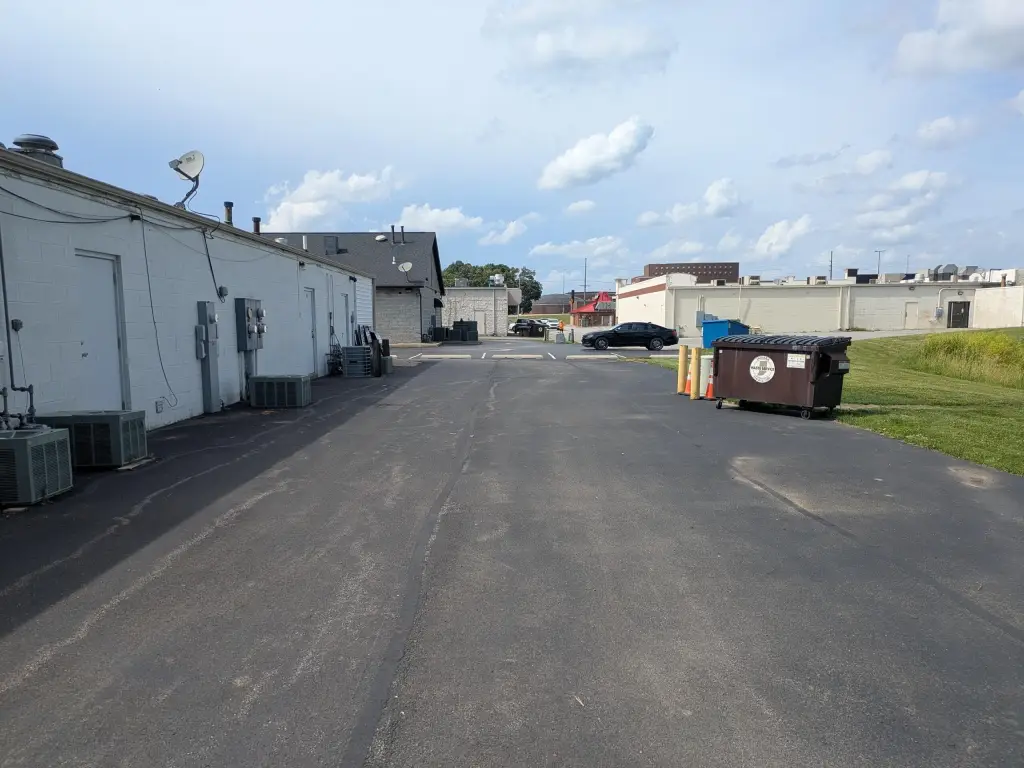
independent rear access
independent utility meters
deeded right-of-way access
ample paved parking
modular track lighting
LED recessed lighting
built-in slat walls
rear East wall shelving
Building Details
Year built
1978
Listing Agency:
SCHUPP Real Estate
(219) 696-3596
Listed By:
John Schupp · License #RB14033846
(219) 775-2373
Added: Jun 10
Changed: Aug 19
Last Checked: Oct 6 at 5:06AM
MLS# 840444
Copyright © 2026 Greater Northwest Indiana Association of REALTORS. All rights reserved. All information provided by the listing agent/broker is deemed reliable but is not guaranteed and should be independently verified.
Investment Insights
Based on property information with market context.
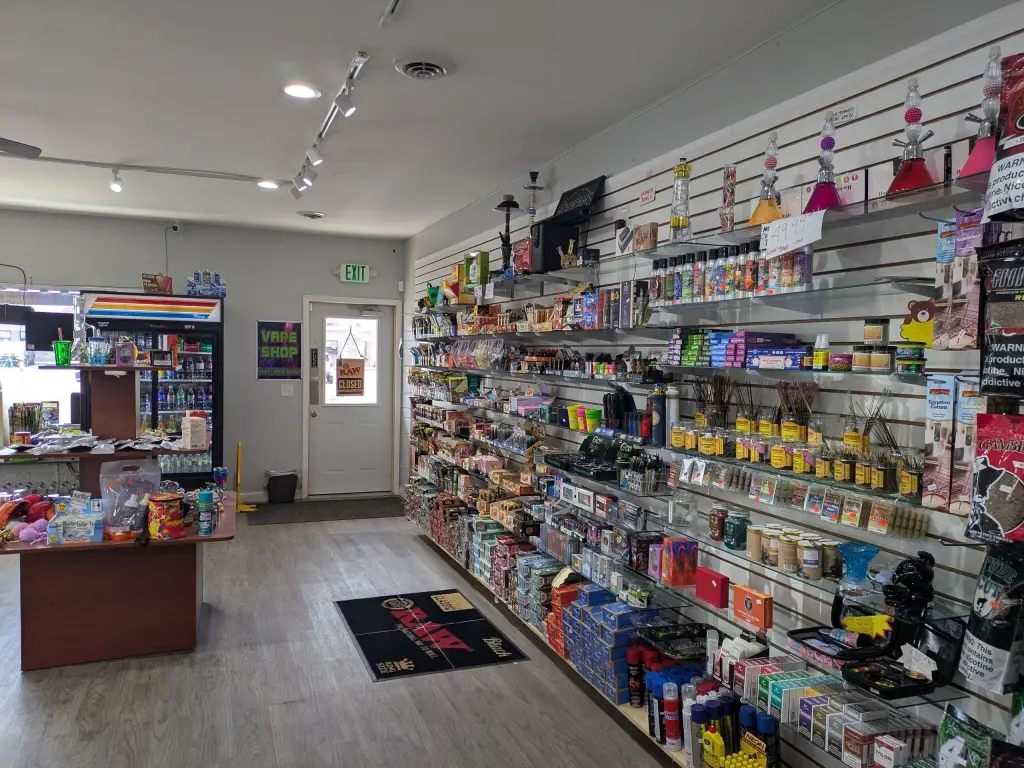
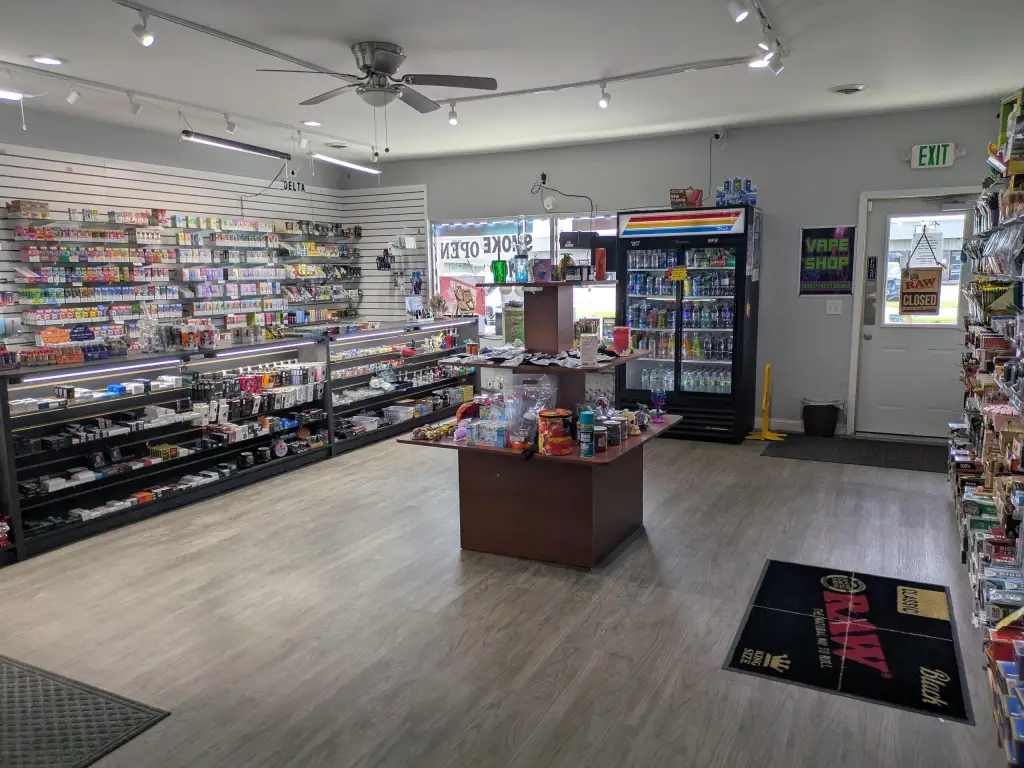
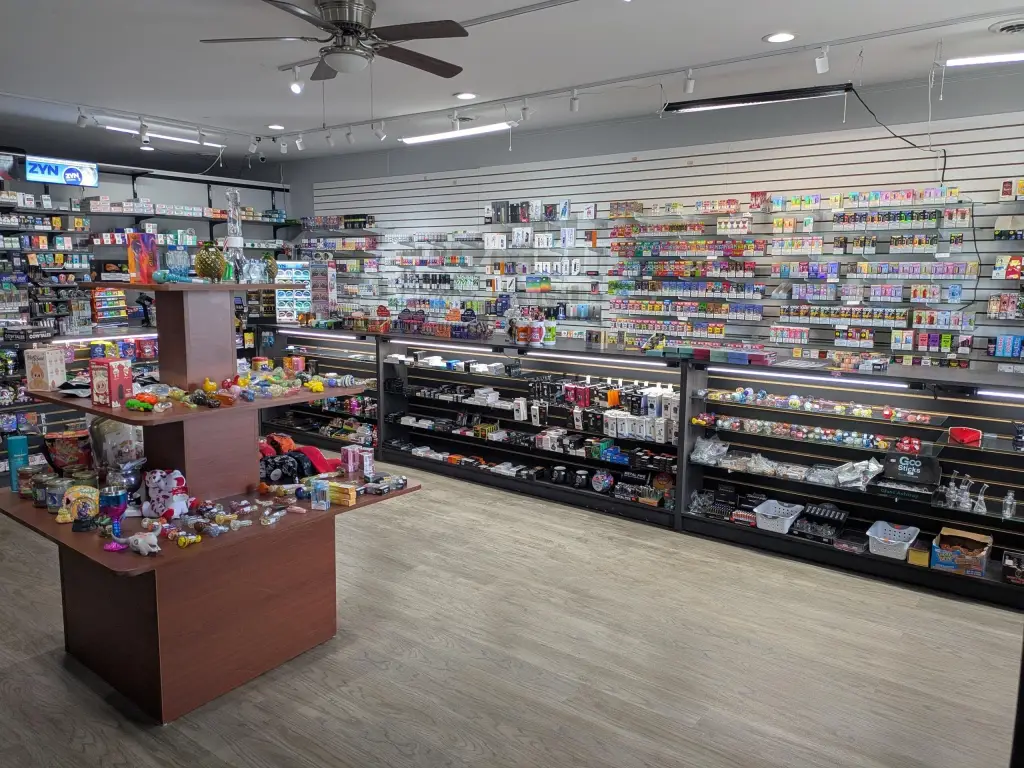
This 1,023-square-foot storefront property combines an open floor plan with private rear storage, a restroom, laundry facilities, and separate rear entry. The interior received extensive upgrades in 2022, including modular track lighting, LED recessed fixtures, built-in slat walls, and rear-wall shelving. Display cases, a refrigerated cooler, surveillance equipment, and additional lighting kits are available separately. Building improvements include a new furnace, central AC, roof, maintenance-free siding, and soffits.
Located at 176 Deanna Drive in Lowell, the property sits on a 0.07-acre parcel along East Commercial Avenue, between the local high school and Lowell Plaza. Daily traffic is reported at 15,000 to 18,702 vehicles. Independent utility meters, public water and sewer, cable availability, and off-street parking support ongoing operations. Access includes a deeded right-of-way across the common lots serving units 170-176.
Located at 176 Deanna Drive in Lowell, the property sits on a 0.07-acre parcel along East Commercial Avenue, between the local high school and Lowell Plaza. Daily traffic is reported at 15,000 to 18,702 vehicles. Independent utility meters, public water and sewer, cable availability, and off-street parking support ongoing operations. Access includes a deeded right-of-way across the common lots serving units 170-176.
Key Highlights
- 1,023 SF storefront on a 0.07‑acre parcel
- Extensive 2022 interior upgrades with track lighting, LED recessed fixtures, slat walls, and shelving
- New furnace, central AC, roof, siding, and soffits
Financial Insights
Estimated NOI and Cap Rate
NOI / Yr
$9,858
Cap Rate
3.94%
Suggested Prices Based on Cap Rates
Cap Rate 5%
$197,160
$197.2K
Cap Rate 7%
$140,829
$140.8K
Cap Rate 9%
$109,533
$109.5K
Market Conditions
NOI Build-Up for 1,023 SF
Gross rent
$14.7K $14.40/SF
− Vacancy
−$648 −$0.63/SF
EGI
$14.1K $13.77/SF
− OpEx
−$4.2K −$4.13/SF
NOI
$9.9K $9.64/SF
Area
Lake County, IN
Vacancy
4.40%
Lease Rate
$14.40 /SF/Yr
Expense Ratio
30.00%
Simulate Cap Rate and NOI
Suggested Prices Based on Cap Rates
Cap Rate 5%
$197,160
Cap Rate 7%
$140,829
Cap Rate 9%
$109,533
Alternative Uses
Best Use
Retail
$140.8K
$123.2K – $164.3K
NOI $9,858 @ 7.0% cap · market cap 3.94%
Second Best
—
—
no second resolved use
Theoretical Best
Specialty Retail
$285.6K
$249.9K – $333.2K
NOI $19,991 @ 7.0% cap · market cap 8.00%
Zoning and permitted uses should be independently verified with authorities.
Property Analytics
Unlock full access to Insights
Subscribe to Realmo Intelligence
Open Analytics
Current Use
Lease Details
18,702 VPD
Traffic count
Single-tenant
Tenancy
Yes
Paved road access
Yes
Utilities to site
Location Intelligence
Trade Area within ½ mile
234
Businesses Nearby
Under-served
Demand for This Use
Explore this area
Business Placement
Demographics for 46356, IN
18,668
Population
7,290
Households
2.6
Avg Household Size
41
Median Age
20%
College-Educated
96%
High-School Grad
112.5 sq mi
ZIP Area
166
Density / Sq Mi
$87,535
Median Household Income
$51,151
Median Earnings
$1,190
Median Rent
$256,300
Median Home Value
Check the figures for this property
Cap Rate, Value Estimation, Potential NOI and more
View Realmo Analytics
Market
Vacancy Rate% for Retail in Midwest region

Questions? Ask Rey
Realmo’s AI knows this listing — price, zoning, demand, history. Ask anything.
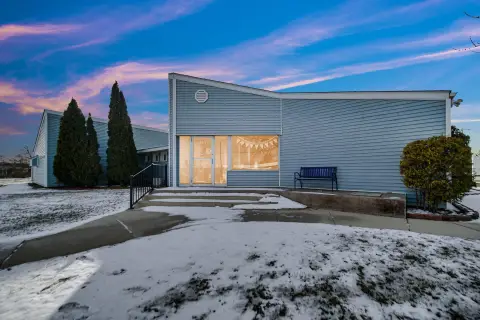




Frequently Asked Questions
What type of property is this?
Storefront property - Open-plan commercial space with rear storage, independent access, and paved parking serving a practical retail or office layout.
Where is this storefront property located?
The property is located at 176 Deanna Drive Lowell, IN.
What is the asking price?
The asking price for this property is $249,950.
What are key features of this property?
This property features: 1,023 SF storefront on a 0.07‑acre parcel; Extensive 2022 interior upgrades with track lighting, LED recessed fixtures, slat walls, and shelving; New furnace, central AC, roof, siding, and soffits



