Auto Glass and Service
106 S State Street Stanton, MI 48888
For Sale
$549,000
COMMERCIAL - Stanton, MI
Property Size3,750 SF
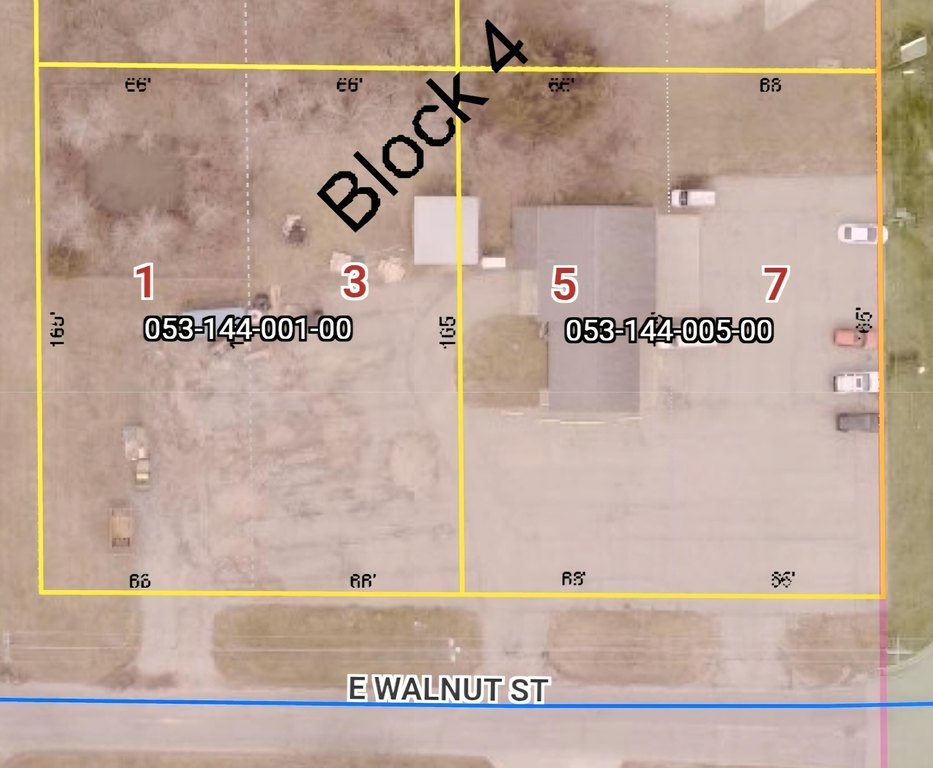
Lot Size1.00 Acre
Price / SF$146.40
Days on Market355
Property Features for 106 S State Street
General Information
- Property type
- Commercial Sale
- Property subtype
- Other
- Bathrooms
- 1
- Rooms
- Bathroom 1
- Parking
- 25
- Standard status
- Active
- APN
- 053-144-005-00
- Size
- 3,750 SF
- Lot size
- 1.00 Acre
Taxes and HOA fees
- Tax Year
- 2024
- Tax Description
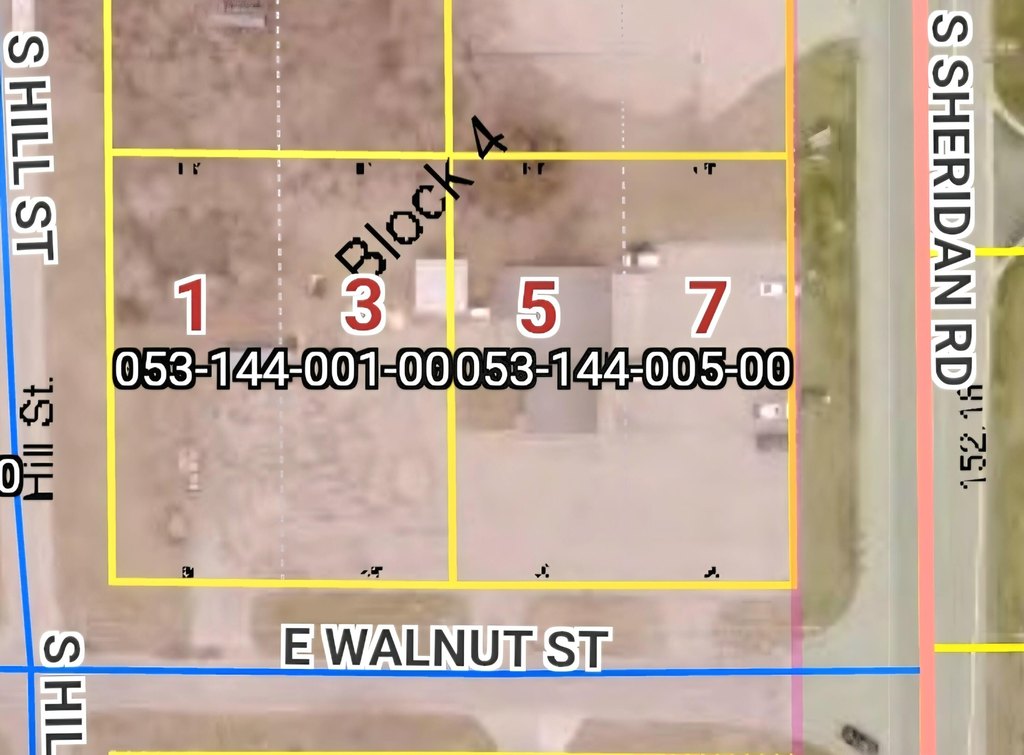
- LOTS 5 & 7 BLK 4 J P BEERS' ADDITION VILLAGE (NOW CITY) OF STANTON. Also 2nd parcel included
- Tax Annual Amount
- 2235
Utilities
- Sewer type
- Septic Tank
- Heating system
- Forced Air
- Cooling system
- Central Air
Building Details
- Year built
- 2000
- Floors in Building
- 2
- Number of units
- 1
- Building materials
- Vinyl Siding
Listing Agency:
Five Star Real Estate (Stanton)
(989) 287-0962
Listed By:
Scott Giddings · License #6501396414
(989) 287-0962
Added: Aug 6, 2025
Changed: Jun 17
Last Checked: Jul 26 at 8:06PM
MLS# 25043373
Copyright © 2026 Michigan Regional Information Center, LLC. All rights reserved. All information provided by the listing agent/broker is deemed reliable but is not guaranteed and should be independently verified.
Investment Insights
Based on property information with market context.
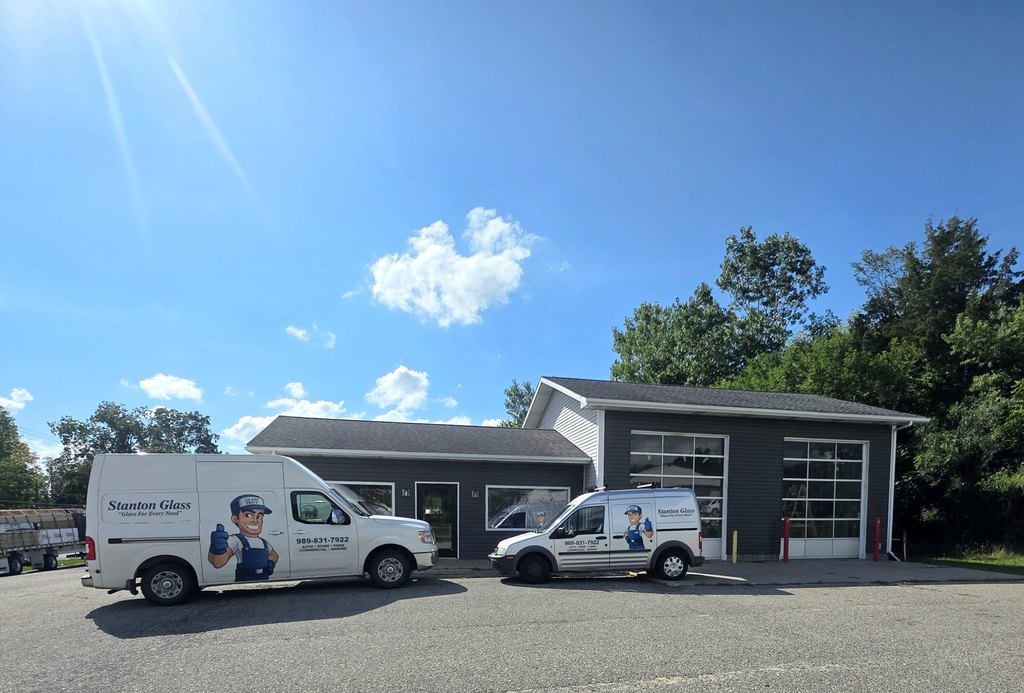
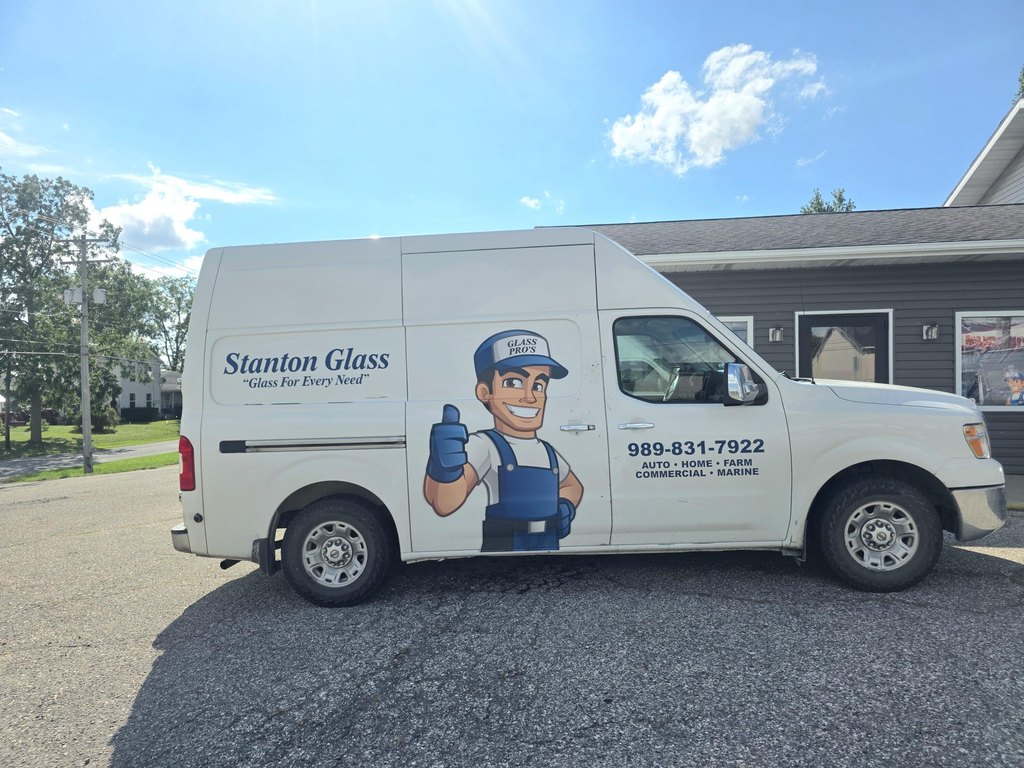
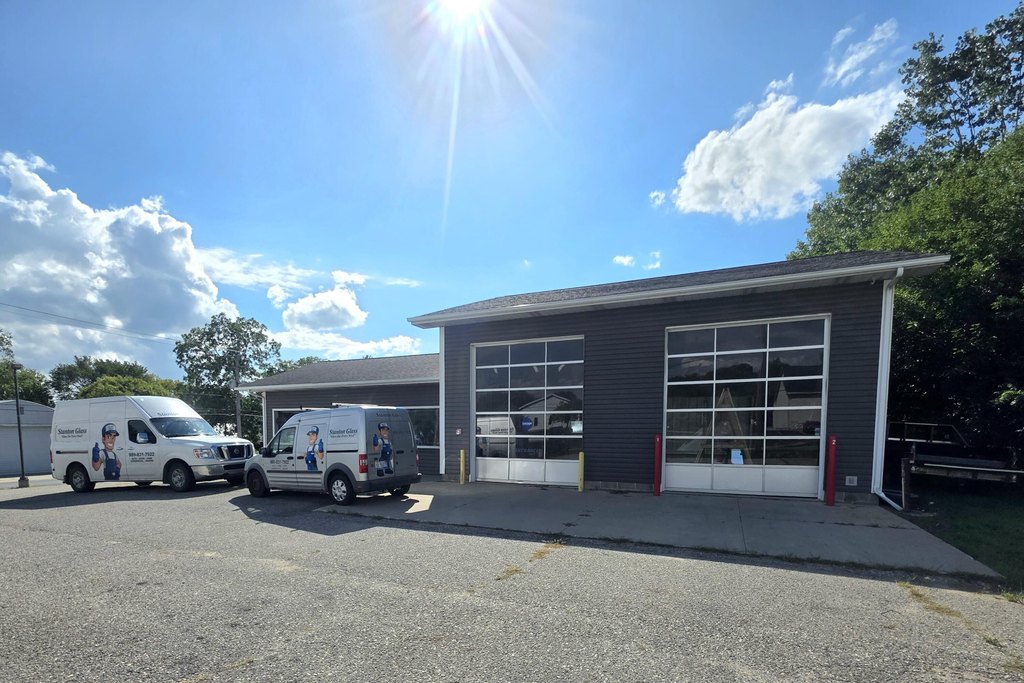
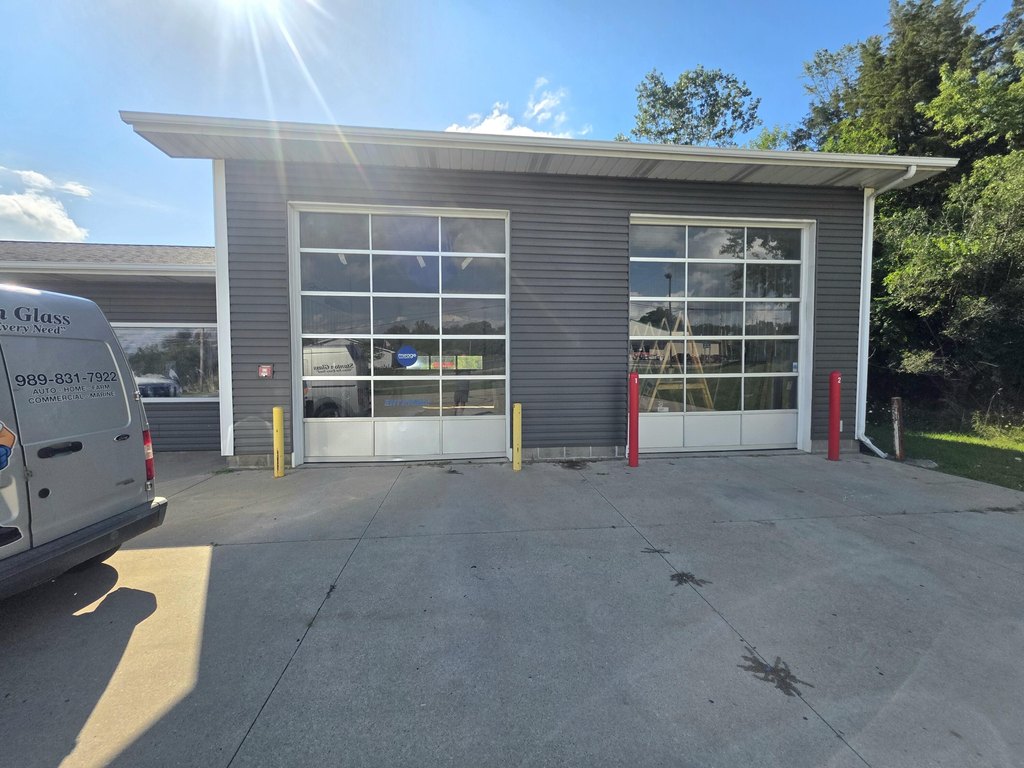
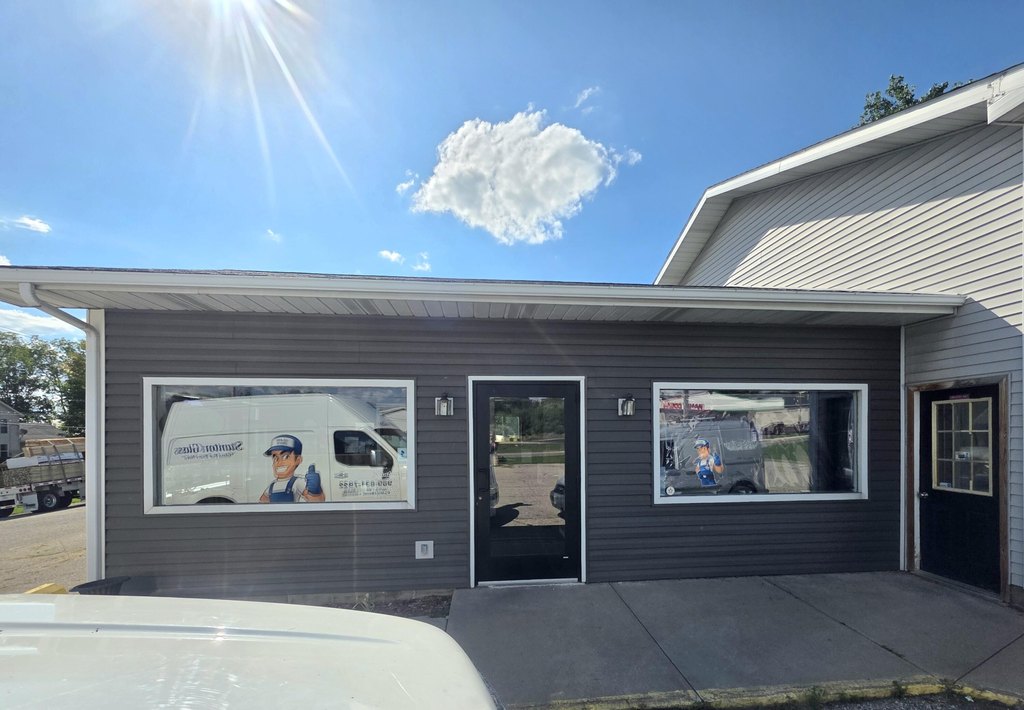
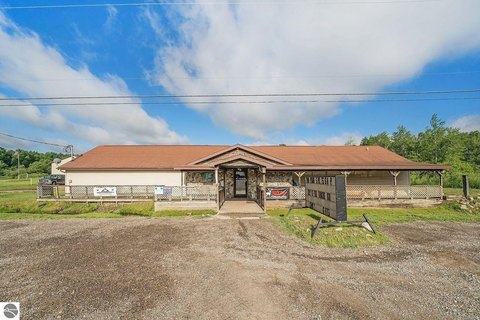
This turnkey business opportunity combines an established service operation with included tangible and intangible assets. The company specializes in auto glass replacement, premium glass shower enclosures, residential window installations, and siding services. The sale includes equipment and inventory, as well as customer lists and brand goodwill, along with intellectual property such as patents or trademarks. The facility was built with a built-in service pit designed for oil changes, including a holding tank for used oil, supporting in-bay vehicle maintenance and potential additional service capability.
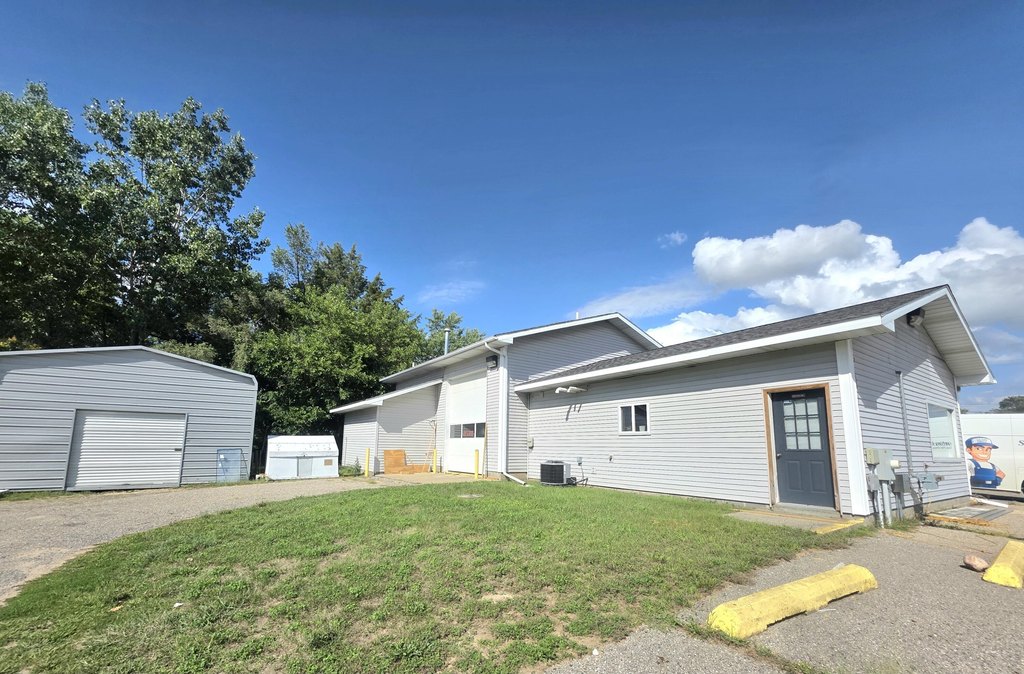
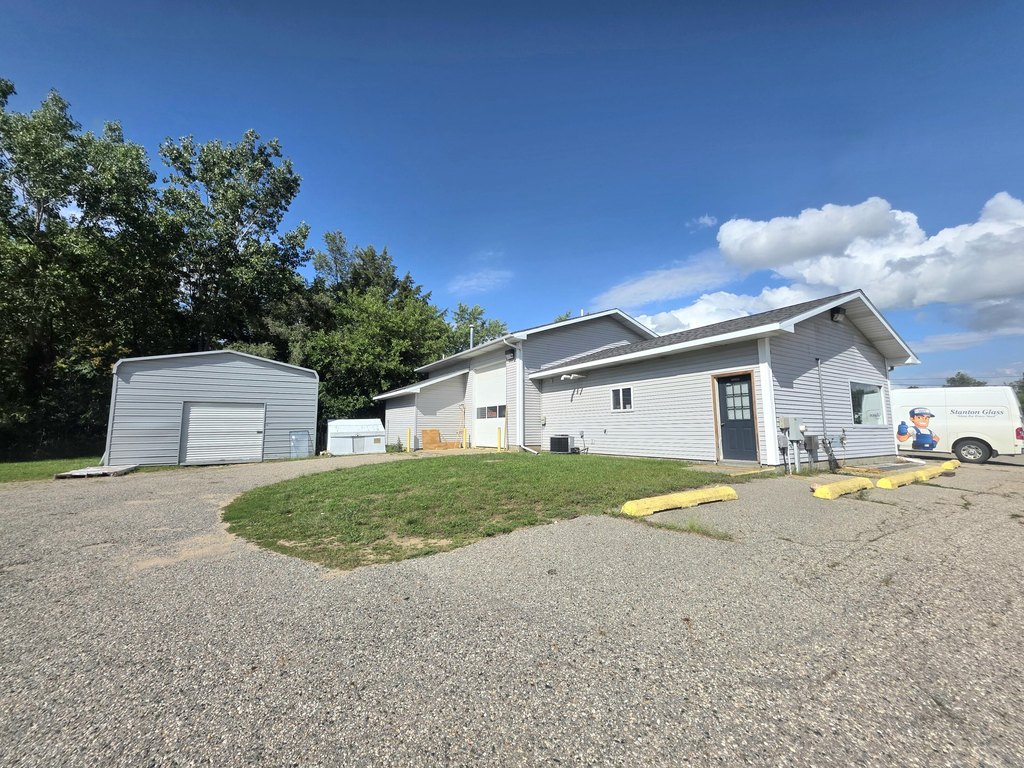
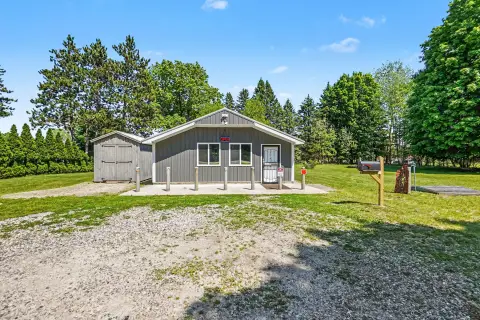
The property is offered on two parcels totaling one acre and contains a 3,750-square-foot facility. It is located near a high-traffic intersection in Stanton, providing convenient access for customers and deliveries related to installation and replacement work.
For an owner-operator or investor looking to step into an operating business, the current scope of services includes both automotive and residential installation offerings. The existing service pit and tank support vehicle-focused work for an in-house fleet, while the remainder of the facility can be considered for future expansion to serve the general public, subject to applicable requirements.
The property is offered on two parcels totaling one acre and contains a 3,750-square-foot facility. It is located near a high-traffic intersection in Stanton, providing convenient access for customers and deliveries related to installation and replacement work.
For an owner-operator or investor looking to step into an operating business, the current scope of services includes both automotive and residential installation offerings. The existing service pit and tank support vehicle-focused work for an in-house fleet, while the remainder of the facility can be considered for future expansion to serve the general public, subject to applicable requirements.
Key Highlights
- Established, fully operational business with 13+ years of proven success.
- Includes tangible and intangible assets, offering a comprehensive business opportunity.
- Turnkey operation with a solid reputation and loyal customer base.
Financial Insights For Retail
Simulate Cap Rate and NOI
NOI Build-Up
- Vacancy
- income lost from leasable area expected to sit empty during the year — subtracted from gross rent.
- EGI (Effective Gross Income)
- gross rent minus vacancy losses — the realistic income before paying operating costs.
- OpEx (Operating Expenses)
- recurring costs to operate the property (property tax, insurance, utilities, maintenance, management) — excludes financing and capital improvements.
- NOI (Net Operating Income)
- income a property generates after operating costs but before financing and taxes.
| Component | $ | $/SF |
|---|---|---|
| Gross rent | $58.1k | $15.48 |
| − Vacancy | −$2.4k | −$0.65 |
| EGI | $55.6k | $14.83 |
| − OpEx | −$16.7k | −$4.45 |
| NOI | $38.9k | $10.38 |
3,750 SF · lease $15.48/SF/yr · vacancy 4.20% · expense 30.00%
Alternative Uses
Best Use
Industrial
$816.9K
$714.8K – $953.1K
NOI $57,184 @ 7.0% cap · market cap 10.42%
Second Best
Retail
$556.1K
$486.6K – $648.8K
NOI $38,928 @ 7.0% cap · market cap 7.09%
Theoretical Best
Self Storage
$51.90M
$45.41M – $60.55M
NOI $3,632,847 @ 7.0% cap · market cap 661.72%
Zoning and permitted uses should be independently verified with local authorities.
Property Analytics
Property Profile
Location Intelligence
Current Use by Public Records
Stanton Glass
General Contractor



Similar Off Market Nearby
- Bookwalter Towing & Recovery — 335 s state st, stanton, mi 48888
- C C Auto Repair — 321 E Walnut St, Stanton, MI 48888
- Bookwalter Collision Center — 335 s sheridan rd, stanton, mi 48888
- Bookwalter Chevrolet Buick Service & Body Shop — 335 s sheridan rd, stanton, mi 48888
- Bookwalter Chevrolet — 335 S Sheridan Rd Building C, Stanton, MI 48888
FAQs
What type of property is this?
Auto shop - Turnkey auto glass, residential window and siding services, with a built-in service pit for vehicle maintenance.
Where is this auto shop located?
The property is located at 106 S State Street Stanton, MI.
What is the asking price?
The asking price for this property is $549,000.
What are key features of this property?
This property features: Established, fully operational business with 13+ years of proven success.; Includes tangible and intangible assets, offering a comprehensive business opportunity.; Turnkey operation with a solid reputation and loyal customer base.



