How to Analyze a Commercial Real Estate Deal: A Beginner’s Guide
Let’s be real: nailing commercial real estate deals takes two things – reading the market like a pro and running tight financial numbers. It’s equal parts gut instinct and spreadsheet work, and that combo is what turns so-so investors into rockstars. Don’t sweat it though – this guide walks you through the whole process step by step. First, get the big picture straight. Then dig into the nitty-gritty numbers. Finally, map your moves smart. Whether it’s office buildings, malls, or warehouses, nailing these basics helps you spot real moneymakers and dodge dead-end deals in today’s crazy market.
Stage 1: Market Analysis
Sound decisions start with turning “location, location, location” into a data‑driven thesis. Track cycles, economic drivers, and demographics to see who creates demand, how durable it is, and where it’s headed. Job growth and rising populations support occupancy and rent growth; recessions or adverse demographic shifts can quickly turn a promising deal into an underperformer.
Before touring assets, study vacancy, new supply in the pipeline, and submarket momentum. Markets adding jobs, investing in infrastructure, and attracting new residents tend to deliver better risk‑adjusted returns. Austin’s technology expansion lifted office demand and rents during 2022–2023, while Detroit’s manufacturing resurgence opened opportunities in industrial. By contrast, markets with economic headwinds or population decline carry elevated risk regardless of any single building’s appeal.
Essential Market Analysis Questions:
- Who are the major employers and what industries drive the local economy?
- Is population growing or declining, and what demographic shifts are occurring?
- What is the current market cycle phase and absorption trends?
- How many competitive properties are in the development pipeline?
- What infrastructure improvements or major projects are planned?
- What are current vacancy rates compared to historical averages?
- How do local regulations impact development and operation costs?
Assess General Market & Economic Drivers
Start with employment data, industry mix, and large infrastructure moves. Job growth, unemployment, and wage trends correlate directly with tenant demand across property types. Concentration risk rises when one industry dominates; diversified economies – think Denver or Dallas – tend to be more resilient across cycles. Major projects such as transit lines, airport expansions, or new highways can catalyze development and lift values around them. Government initiatives, corporate relocations, and university expansions also create long‑term demand that supports sustained rent growth – for example, Amazon’s HQ2 announcement reshaped values and development patterns across Northern Virginia.
Analyze the Hyper-Local Submarket
When you dig into real estate markets, you can’t just look at the whole city – you’ve gotta zoom in on specific neighborhoods and commercial strips where your properties sit. Vacancy rates, average rents, and who’s actually leasing space? They swing wildly even within the same metro area. Think Class B offices out in the suburbs versus downtown cores: demand shifts because tenants want different things and access isn’t equal.
Also, check what’s being built within a three-mile radius – it reshapes future competition and where your property stands. Areas with loose zoning or few building limits often get flooded with new projects, which can ding your occupancy and pricing. But if a submarket’s tight on new supply thanks to tough zoning or other hurdles? That’s gold. Existing buildings there usually stand out from the crowd.
Stage 2: Property-Level Due Diligence
Due diligence is the moment when the spreadsheet meets the street. Sophisticated models can dazzle, but acquisitions close successfully only when the numbers are tested against the building, the people paying the rent, and the rules that govern both. This disciplined review converts abstract forecasts into grounded decisions, anchored in the asset’s condition and the durability of its cash flow.
Start with the asset itself. A comprehensive condition assessment surfaces deferred maintenance that will dictate capex and operating risk. Think aging chillers in a Chicago office tower or a tired membrane roof on a Phoenix neighborhood center – items that stay invisible in a model but show up quickly in NOI and reserves. Scopes, photos, and vendor quotes turn guesses into line items.
Next, validate the income. Read the leases, reconcile the rent roll, and study the property’s story: turnover, rent growth, concessions, and recurring operational issues. A diverse tenant mix across sectors with a staggered rollover schedule dilutes concentration risk and steadies cash flow. By contrast, single‑tenant assets – or centers dominated by struggling retail concepts – can offer eye‑catching entry yields while masking re‑leasing and credit risk.
Finally, confirm that the use is legal today and feasible tomorrow. Zoning and entitlement checks flag nonconformities that can complicate renovations or changes in tenancy. Layer in environmental diligence, title review, and municipal compliance to catch liabilities before they attach to the buyer.
Property Inspection Checklist
- Structural Elements: Foundation integrity, load-bearing walls, structural steel
- Roof Systems: Membrane condition, drainage systems, insulation adequacy
- HVAC Infrastructure: Equipment age, maintenance records, energy efficiency
- Plumbing Systems: Water pressure, pipe condition, fixtures functionality
- Electrical Components: Panel capacity, wiring condition, code compliance
- Safety Systems: Fire suppression, emergency exits, ADA accessibility
- Parking & Exterior: Pavement condition, lighting, landscaping maintenance
Conduct a Thorough Physical Inspection
When checking a building’s real condition, you’ve got to methodically inspect all major systems and structural parts. Savvy investors zero in first on repairs people have been putting off – these mean immediate cash drains or operational headaches. Aging roofs due for replacement, outdated HVAC units with ballooning repair bills, and electrical systems needing code fixes all hit profits hard by shrinking net operating income.
Turns out, pro property inspections usually flag 15-25% more issues than quick walk-throughs. That’s why hiring qualified building engineers or certified inspectors pays off – they spot what others miss. Their reports give you rock-solid forecasts for future repair costs, helping you model finances accurately and negotiate smarter when hammering out purchase prices.
Perform Tenant and Lease Analysis
Your building’s income reliability and growth mostly hinge on who rents your space and what their lease says. When digging into rent rolls, smart investors check tenant reliability, when leases end, renewal options, and rent-increase terms. Properties with big-name, rock-steady companies locked into long leases usually fetch higher prices than spots filled with local shops or shaky-credit renters.
Reviewing leases also spots cash-flow red flags: percentage rent tricks, expense split details, and tenant upgrade allowances. Having leases end at different times keeps vacancies from crashing your income in tough times – while a bunch of leases expiring together could mean rollercoaster income that truly requires careful planning.
Review Legal and Regulatory Factors
Zoning compliance verification and legal title examination protect investors from regulatory complications and ownership disputes. Properties operating under non-conforming use designations may face restrictions during future renovation or tenant replacement scenarios. Municipal zoning changes, historic district designations, or environmental regulations can significantly impact development potential and operational flexibility.
Comprehensive due diligence includes reviewing property tax assessments, existing liens or encumbrances, and pending litigation affecting property ownership or operations. Title insurance policies, survey accuracy verification, and environmental site assessments provide essential legal protection and regulatory compliance assurance for sophisticated commercial real estate investments.
Stage 3: Financial Analysis – Running the Core Numbers
Financial analysis is the math-driven backbone of commercial real estate deals. It takes raw property details and turns them into clear numbers showing returns and risks. At the heart of this is the pro forma – the master document that pulls together every financial guess, assumption, and metric. Each number flows logically into the next, building a full picture so investors can decide wisely and compare properties fairly.
Smart investors rely on standard metrics to judge cash flow, borrowing power, and risk-adjusted profits – no matter the property type or market. These calculations create objective yardsticks for sizing up deals and setting smart prices. For example, we’ll look at a 25,000-square-foot Atlanta suburb office building listed at 3,750,000,needing750,000 cash upfront.
Crunching gross rent, operating costs, and loan payments lets investors nail down the net operating income (NOI), capitalization rates, and cash-on-cash returns. Each metric has its job:
- NOI shows pure operational profit,
- Cap rates let you compare markets,
- Cash flow numbers reveal actual investor take-home.
- The debt service coverage ratio is crucial too – it tells lenders if financing stays safe and sustainable.
This isn’t abstract theory. It’s how real people cut through the noise to see whether a deal truly works.
Key Financial Metrics Reference Table
| Metric | Formula | Purpose |
| NOI | Gross Income – Operating Expenses | Measures property profitability before financing |
| Cap Rate | NOI ÷ Purchase Price | Compares market values and risk levels |
| Cash Flow | NOI – Annual Debt Service | Determines actual cash distributions |
| CoC Return | Annual Cash Flow ÷ Total Cash Invested | Measures return on investor equity |
| DSCR | NOI ÷ Annual Debt Service | Evaluates loan repayment capacity |
Step 1: Calculate Net Operating Income (NOI)
Net operating income forms the foundation of all commercial real estate financial analysis, representing the property’s annual income after deducting operational expenses but before debt service payments. Gross rental income includes base rent, percentage rent, and tenant reimbursements, while operating expenses encompass property taxes, insurance, maintenance, management fees, and utilities. Notably, debt service payments are excluded from operating expenses as they represent financing costs rather than operational requirements.
NOI Calculation Example
Gross Rental Income: $450,000
Less: Operating Expenses: $135,000
Net Operating Income (NOI): $315,000
Step 2: Determine the Capitalization Rate (Cap Rate)
The capitalization rate serves as the primary tool for property valuation and market comparison, expressing the relationship between net operating income and purchase price. This metric enables investors to assess relative value across different properties, markets, and asset classes. Higher cap rates typically indicate greater perceived risk or less desirable locations, while lower cap rates suggest premium properties or highly competitive markets.
Cap Rate Calculation Example
Cap Rate = NOI ÷ Purchase Price
Cap Rate = $315,000 ÷ $3,750,000 = 8.4%
Step 3: Analyze Cash Flow and Cash-on-Cash Return (CoC)
Cash flow represents the actual dollars distributed to investors after debt service payments, while cash-on-cash return measures the annual return on invested equity capital. These metrics provide critical insights into investment performance from the investor’s perspective, accounting for leverage effects and actual cash distributions. Cash-on-cash returns enable comparison with alternative investment opportunities and establish return expectations for different risk profiles.
Cash Flow & CoC Calculation Example
Annual Cash Flow = NOI – Annual Debt Service
Annual Cash Flow = $315,000 – $240,000 = $75,000
CoC Return = Annual Cash Flow ÷ Total Cash Invested
CoC Return = $75,000 ÷ $750,000 = 10.0%
Step 4: Verify the Debt Service Coverage Ratio (DSCR)
The debt service coverage ratio measures the property’s ability to service mortgage payments, providing lenders with essential risk assessment data. Most commercial lenders require minimum DSCR levels of 1.25x to 1.30x, ensuring adequate cash flow cushion for debt service obligations. Properties with higher DSCRs demonstrate stronger financial stability and reduced default risk, often qualifying for favorable loan terms and interest rates.
DSCR Calculation Example
DSCR = NOI ÷ Annual Debt Service
DSCR = $315,000 ÷ $240,000 = 1.31x
Result: Meets typical lender requirements (>1.25x)
Stage 4: Advanced Analysis & Future Planning
Advanced real estate investment modeling extends beyond current performance metrics to encompass comprehensive risk mitigation strategies and long-term value creation scenarios. Sophisticated investors recognize that initial financial analysis represents only the foundation for strategic decision-making. Internal rate of return calculations, sensitivity analysis, and systematic stress testing transform static property evaluations into dynamic investment frameworks that account for market volatility and operational uncertainties.
Professional investment analysis incorporates multiple scenario planning approaches that examine best-case, base-case, and worst-case performance outcomes. This comprehensive approach enables investors to identify potential value-add opportunities while establishing appropriate risk parameters for different market conditions. Successful commercial real estate investors consistently demonstrate disciplined analytical frameworks that prioritize conservative underwriting principles and strategic exit planning from initial acquisition through ultimate disposition.
What If? Stress Test Scenario
Base Case: 90% occupancy, $18/sf rent, NOI = $315,000
Stress Test: 80% occupancy (-10%), $16/sf rent (-$2/sf)
Stressed NOI = $245,000 (-22%)
New DSCR = $245,000 ÷ $240,000 = 1.02x (Below lender minimum)
Impact: Potential refinancing challenges, reduced cash flow
Projecting Long-Term Returns with IRR
Internal rate of return analysis provides comprehensive investment performance measurement by incorporating time value of money considerations across the entire holding period, including projected sale proceeds. Unlike static yield metrics, IRR calculations account for cash flow timing, capital appreciation, and disposition scenarios to generate annualized return projections. This metric enables direct comparison between diverse investment opportunities with varying cash flow patterns, holding periods, and capital structures, making it essential for portfolio optimization and strategic capital allocation decisions.
Stress-Test Your Assumptions
Conservative underwriting principles require systematic sensitivity analysis examining how adverse market conditions impact investment performance and debt service capacity. Professional investors routinely model vacancy rate increases, rental rate declines, operating expense inflation, and interest rate fluctuations to identify potential vulnerability points. Stress testing scenarios typically examine 10-20% adverse changes in key performance drivers, enabling investors to establish appropriate acquisition pricing and reserve requirements that maintain financial stability during market downturns.
Define Your Exit Strategy
Strategic exit planning influences every aspect of initial investment analysis, from acquisition pricing to operational improvements and capital expenditure decisions. Common disposition strategies include:
• Direct Sale: Optimizing property performance for market sale
• Refinancing: Extracting equity while maintaining ownership
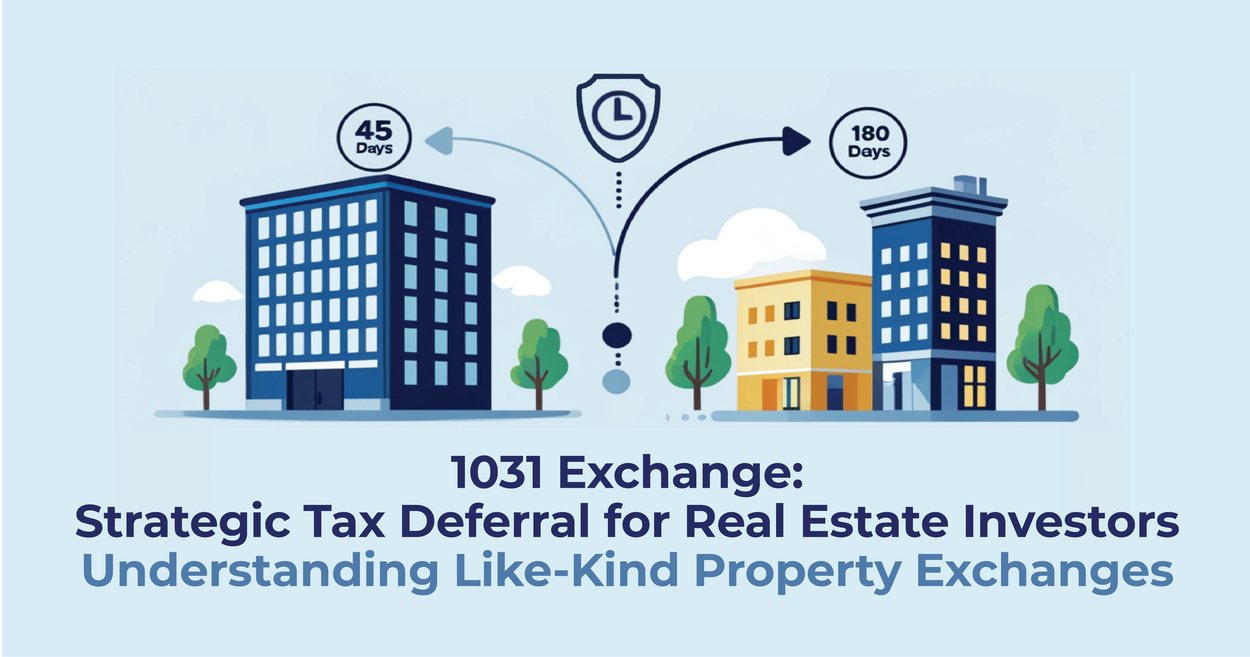
• 1031 Exchange: Tax-deferred reinvestment in larger assets
• Value-Add Programs: Implementing improvements before disposition
• Portfolio Assembly: Combining assets for institutional sale
Exit strategy selection depends on market timing, investment objectives, tax considerations, and capital availability. Properties acquired for quick value-add improvements require different analytical approaches compared to long-term income-producing assets intended for generational wealth building.
Conclusion
Successful commercial real estate investing requires comprehensive holistic analysis that integrates market intelligence, operational assessment, and financial precision. No single metric provides sufficient information for informed investment decisions – only the systematic combination of market analysis, property due diligence, and rigorous financial modeling creates the complete investment picture. This four-stage framework transforms complex commercial real estate investing into manageable, methodical risk assessment processes that sophisticated investors utilize consistently.
Mastering these analytical fundamentals enables investors to identify genuine opportunities while avoiding costly pitfalls that trap inexperienced participants. Your investment strategy should always prioritize thorough evaluation over quick decisions, recognizing that successful commercial real estate acquisitions reward patient, disciplined analysis