
New search
Property profile & analytics
OFF-MARKET
Estimated value
$2,735,000
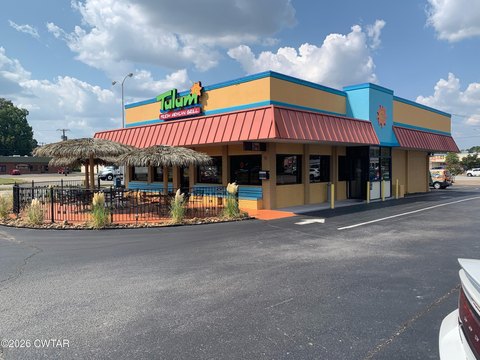
Drive through restaurants
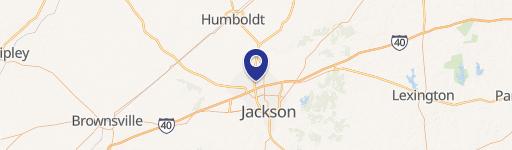
873 Vann Dr, Jackson, TN 38305-6033
Entity Owned
4-yr Hold
~
Est. High Equity
Property ID
US80-1351840
Property profile
Verified
Property type
Drive through restaurants
Use group
DRIVE-THRU RESTAURANT, FAST FOOD
Year built
2000
Total area
2,985 SF
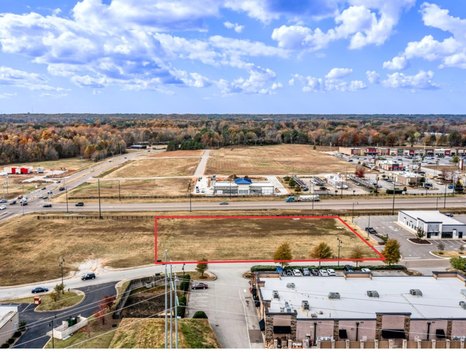
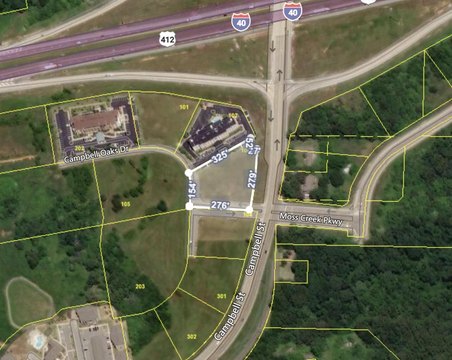
Lot
0.94 ac (40,946 SF)
APN
057055G B 00800
UPID
US80-1351840
Cap rate & NOI
Priority signal for investors
Implied cap rate, NOI & suggested price
Cap rate vs submarket · NOI estimate · 3 price anchors
Implied cap rate, NOI & suggested price
Cap vs submarket · NOI estimate · 3 price anchors
Current use
Occupant on record · Public records
-
Wendy's Restaurant Take-out & Catering
Value estimations
Realmo proprietary · 4 methods
AI Approach
AI
$2.59M
CAP Approach
CAP
by Request
Comparable Approach
Comparable
$1.91M
Blend (final)
Blend
$2.74M
Owner & transaction history
Cactus Development Partnership · 4 yrs held
Cactus Development Partnership
since 2022
Last sale
$2.7M
7 recorded transactions
Zoning & alternative use
Permitted uses
Permitted uses
Allowed · conditional · prohibited
Cap rate
Implied · in-place · derived from last sale + estimated NOI
Implied Cap rate
#1
Implied · in-place · NOI ÷ last sale
In-place · derived from last sale + estimated NOI
Cap rate, NOI & submarket benchmark
Implied cap rate vs Jackson submarket · NOI estimate · Typical band, median & reading
Implied cap rate, NOI & submarket benchmark
Cap vs Jackson submarket · NOI estimate · typical band, median & reading
Refine your cap rate
8-question underwriting flow
1.
Property current status — Going-In vs Stabilized
2.
Price for denominator — asking / offer / market
3.
Leasing status & lease structure (NNN / Gross)
4.
Tenant risk profile & vacancy assumption
5.
Upload T12 / rent roll / OM (optional)
Refine in 60 seconds, get exact suggested price
T12 upload · Submarket benchmarks · Sensitivity grid
Suggested price · 3 cap rate anchors
Income approach @ 5% / 7% / 9% — aggressive / typical / conservative
Suggested price at 5% / 7% / 9% cap
Aggressive / typical / conservative · Implied $/SF per anchor · Sensitivity grid
Suggested price at 5% / 7% / 9% cap
Aggressive / typical / conservative · implied $/SF · sensitivity
Value
AI, CAP & Alternative Use estimations · Realmo proprietary blendValue Estimations
Based on Realmo’s proprietary methodology
AI Approach
Method
Estimation
Statistic approach
$2,925,000
ML approach
$2,585,000
CAP Approach
CAP Return
Estimation
6%
by Request
6.5%
by Request
7%
by Request
Blend value · Realmo final
$2.74M
Range $2.46M – $3.01M · ±10% · vs last sale $2.71M (Feb 2 2022)
Last sale anchor
$2.71M
Feb 2 2022
Realmo estimate · informational only.
These numbers are calculated by our models from public records and may not reflect actual market value.
Not an appraisal.
Verify with a licensed appraiser before transacting. Realmo accepts no liability for divergence from real-world outcomes.
View the full estimation — every method, every assumption
Confidence drivers & risk notes · Custom comparable set · Free for first 3 / day
Full estimation methodology
Every method · every assumption · confidence drivers
Price per SF
Sale + rent benchmarks
Subject property
$916 / SF
Submarket sale & rent benchmarks
Median sale $/SF · Asking & closed rent · Submarket vacancy
Submarket sale & rent benchmarks
Median sale $/SF · asking & closed rent · submarket vacancy
Property tax & assessments
Tax year 2022Property tax & assessments
Tax year 2022
Tax billed
$18,803
Tax year 2022
Assessed value
$539,560
Assessed 2023
Previous assessed
$539,560
+0.0% YoY
Effective rate
3.48%
On assessed value
Assessed land
$282,000
Assessed improvement
$257,560
Land market value
$705,000
Improvement market value
$643,900
Total market value
$1,348,900
Applied tax rate
57.0000
Comparables
6 recent transactions · within 1.5 miComparable in this city
6 recent transactions
Comparable in this City


Similar Nearby for Sale


Similar Nearby for Lease


Recent comparable sales
Sale price & price/SF · Sale date & distance · Adjustments & confidence
Recent comparable sales
Sale price & $/SF · sale date & distance · adjustments
Property description
Physical attributes from public recordsBuilding & lot
Public records
Property type
Drive through restaurants
Use group
DRIVE-THRU RESTAURANT, FAST FOOD
Status
Off-Market
Year built
2000
Heating
YES
Cooling
AC.PACKAGE
Stories
1
Units
1
Bathrooms
2
Total area
2,985 SF
Lot
0.94 ac (40,946 SF)
APN
057055G B 00800
UPID
US80-1351840
Jurisdiction
MADISON
Zoning & alternative use
Zoning · permitted uses
Permitted & conditional uses
Allowed uses · Special-permit conditions · Prohibited uses
Permitted & conditional uses
Allowed · special-permit conditions · prohibited
Building & site characteristics
From public records
Year built
2000
Heating
YES
Cooling
Yes
Stories
1
Units
1
Bathrooms
2
Lot
0.94 ac
Current owner
From public records · entity-resolved
Cactus Development Partnership
Entity
Mailing address
206 MADISON PARK DR, SAINT PETERS, MO 63376-2289
Ownership since
2022
Owner contacts — direct phone, email, and related entities
Decision-maker phone · Verified email · Related entities & filings
Owner contacts
Email · phone · related entities
Sales History
7 recorded events · public records
Date
Price
Buyer
Seller
Deed Type
Mortgage
Feb 2, 2022
$2,711,115
Cactus Development Partnership
Wrg Realty LLC
Special Warranty Deed
$470,000 · The Bank Of Jackson
Oct 5, 2020
—
Wrg Realty LLC
—
Deed
related
$200,000 · Bank Ozk
Aug 28, 2018
$2,232,143
Wrg Realty LLC
Restaurant Holdings LLC
Special Warranty Deed
$1,116,071 · Bank Of The Ozarks
May 26, 2017
$1,661,764
Restaurant Holdings LLC
Valenti Mid-south Realty LLC
Grant Deed
$15,084,260 · Mercantile Bk/mi
May 17, 2000
$515,503
Mid-south Realty L Valenti
Englewood,baptis
Grant Deed
—
—
—
Valenti Mid-south Realty LLC
—
Deed Of Trust
related
$35,500,000 · General Elec Cap
—
—
Wrg Realty LLC
—
Loan Modification
related
$200,000 · Bank Ozk
Coming soon
Costs & Benchmarks
Operating expenses, capex projections, utility benchmarks, and submarket comparables — all in one view.
Coming soon
Risks
Flood, climate, environmental, title, and tenant-concentration risk — surfaced with mitigations and source citations.
Try Rey
Ask anything about this address in plain English.
“Is 15.6% cap rate sustainable?” · “Best tenant mix for BU1?” · “What’s the redev upside?”
You own 873 Vann Dr?
List it free. Reach 20,000 daily buyers.
We’ve already pulled the facts. Confirm photos + price and you’re live in 2 minutes.
List this address →
Full reports are paid
Unlock the full Property Analytics report
Start free for 7 days — no card required. Full owner contacts, all 4 valuations with methodology, refine flow, comparable adjustments, foot-traffic deep dive, export to PDF / CSV.


