
New search
Property profile & analytics
FOR LEASE
Industrial properties
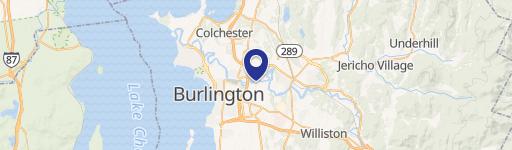
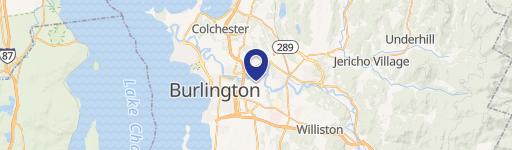
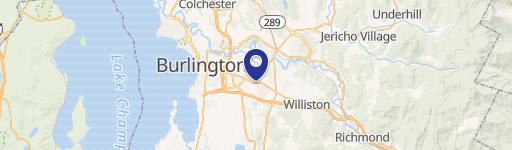
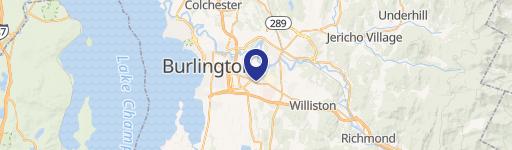
725 Community Dr, South Burlington, VT 05403
Individually Owned
6-yr Hold
Absentee Owner
Free & Clear
Property ID
US89-0115190
 For Lease
1 / 3
For Lease
1 / 3
$15 SF/Yr
725 Community Dr, South Burlington, VT 05403
View Listing →
Property profile
Verified
Property type
Industrial properties
Use group
INDUSTRIAL (GENERAL)
Year built
2006
Total area
69,120 SF
Lot
11.2 ac (487,872 SF)
APN
(188) 0436-00055
UPID
US89-0115190
Cap rate & NOI
Priority signal for investors
Implied cap rate, NOI & suggested price
Cap rate vs submarket · NOI estimate · 3 price anchors
Implied cap rate, NOI & suggested price
Cap vs submarket · NOI estimate · 3 price anchors
Value estimations
Realmo proprietary · 4 methods
AI Approach
AI
$7.23M
CAP Approach
CAP
$9.71M
Comparable Approach
Comparable
$7.24M
Blend (final)
Blend
$7.07M
Owner & transaction history
Technology Park Community Assn · 6 yrs held
Technology Park Community Assn
since 2020
Last sale
$5.5M
7 recorded transactions
Zoning & alternative use
Permitted uses
Permitted uses
Allowed · conditional · prohibited
Top alternative use upside
Medical building
$9.6M
+70.7%
Commercial (general)
$8.9M
+58.0%
Auto repair, garage
$8.3M
+47.9%
Cap rate
Implied · in-place · derived from last sale + estimated NOI
Implied Cap rate
#1
Implied · in-place · NOI ÷ last sale
In-place · derived from last sale + estimated NOI
Cap rate, NOI & submarket benchmark
Implied cap rate vs South Burlington submarket · NOI estimate · Typical band, median & reading
Implied cap rate, NOI & submarket benchmark
Cap vs South Burlington submarket · NOI estimate · typical band, median & reading
Refine your cap rate
8-question underwriting flow
1.
Property current status — Going-In vs Stabilized
2.
Price for denominator — asking / offer / market
3.
Leasing status & lease structure (NNN / Gross)
4.
Tenant risk profile & vacancy assumption
5.
Upload T12 / rent roll / OM (optional)
Refine in 60 seconds, get exact suggested price
T12 upload · Submarket benchmarks · Sensitivity grid
Suggested price · 3 cap rate anchors
Income approach @ 5% / 7% / 9% — aggressive / typical / conservative
Suggested price at 5% / 7% / 9% cap
Aggressive / typical / conservative · Implied $/SF per anchor · Sensitivity grid
Suggested price at 5% / 7% / 9% cap
Aggressive / typical / conservative · implied $/SF · sensitivity
Value
AI, CAP & Alternative Use estimations · Realmo proprietary blendValue Estimations
Based on Realmo’s proprietary methodology
AI Approach
Method
Estimation
Statistic approach
$7,240,000
ML approach
$7,230,000
CAP Approach
CAP Return
Estimation
6%
$10,515,000
6.5%
$9,710,000
7%
$9,015,000
Alternative Use
Use
Estimation
INDUSTRIAL (GENERAL)
$5,625,000
Current use
MEDICAL BUILDING
$9,600,000
Change: +71% · Conversion: Difficult
COMMERCIAL (GENERAL)
$8,885,000
Change: +58% · Conversion: Difficult
AUTO REPAIR, GARAGE
$8,320,000
Change: +48% · Conversion: Easy
RESTAURANT
$8,090,000
Change: +44% · Conversion: Difficult
APARTMENT HOUSE (5+ UNITS)
$7,120,000
Change: +27% · Conversion: Difficult
RETAIL STORES
$4,895,000
Change: -13% · Conversion: Moderate
Blend value · Realmo final
$7.07M
Range $6.36M – $7.78M · ±10% · vs last sale $5.50M (May 10 2022)
Last sale anchor
$5.50M
May 10 2022
Realmo estimate · informational only.
These numbers are calculated by our models from public records and may not reflect actual market value.
Not an appraisal.
Verify with a licensed appraiser before transacting. Realmo accepts no liability for divergence from real-world outcomes.
View the full estimation — every method, every assumption
Confidence drivers & risk notes · Custom comparable set · Free for first 3 / day
Full estimation methodology
Every method · every assumption · confidence drivers
Price per SF
Sale + rent benchmarks
Subject property
$102 / SF
Submarket sale & rent benchmarks
Median sale $/SF · Asking & closed rent · Submarket vacancy
Submarket sale & rent benchmarks
Median sale $/SF · asking & closed rent · submarket vacancy
Property tax & assessments
Tax year 2020Property tax & assessments
Tax year 2020
Tax billed
$146,801
Tax year 2020
Assessed value
$9,292,000
Assessed 2022
Previous assessed
$9,292,000
+0.0% YoY
Effective rate
1.58%
On assessed value
Assessed improvement
$9,292,000
Applied tax rate
188.0000
Comparables
6 recent transactions · within 1.5 miComparable in this city
6 recent transactions
Comparable in this City

Similar Nearby for Lease


Recent comparable sales
Sale price & price/SF · Sale date & distance · Adjustments & confidence
Recent comparable sales
Sale price & $/SF · sale date & distance · adjustments
Property description
Physical attributes from public recordsBuilding & lot
Public records
Property type
Industrial properties
Use group
INDUSTRIAL (GENERAL)
Status
For Lease
Year built
2006
Heating
FORCED AIR
Buildings
1
Stories
3
Total area
69,120 SF
Lot
11.2 ac (487,872 SF)
APN
(188) 0436-00055
UPID
US89-0115190
Jurisdiction
SOUTH BURLINGTON TWP
Zoning & alternative use
Zoning · permitted uses
Permitted & conditional uses
Allowed uses · Special-permit conditions · Prohibited uses
Permitted & conditional uses
Allowed · special-permit conditions · prohibited
Alternative use value scenarios
Repositioning upside vs current use
INDUSTRIAL (GENERAL) Current
Est. value
$5.6M
MEDICAL BUILDING
Est. value
$9.6M
COMMERCIAL (GENERAL)
Est. value
$8.9M
AUTO REPAIR, GARAGE
Est. value
$8.3M
RESTAURANT
Est. value
$8.1M
APARTMENT HOUSE (5+ UNITS)
Est. value
$7.1M
RETAIL STORES
Est. value
$4.9M
INDUSTRIAL (GENERAL) Current
MEDICAL BUILDING
COMMERCIAL (GENERAL)
AUTO REPAIR, GARAGE
RESTAURANT
APARTMENT HOUSE (5+ UNITS)
RETAIL STORES
Alternative use deep dive — conversion cost, permits, timeline
Conversion cost estimate · Permit path & risks · Stabilized NOI per option
Alternative use deep dive
Conversion cost · permit path · stabilized NOI per option
Building & site characteristics
From public records
Year built
2006
Heating
FORCED AIR
Stories
3
Buildings
1
Lot
11.2 ac
Current owner
From public records · entity-resolved
Technology Park Community Assn
Individual
Free & Clear · 6 yrs held
Mailing address
88 TECHNOLOGY PARK WAY #2, S BURLINGTON, VT 05403-6843
Mailing matches property
Different — outreach signal
Owner-occupied
No
Ownership since
2020
Owner contacts — direct phone, email, and related entities
Decision-maker phone · Verified email · Related entities & filings
Owner contacts
Email · phone · related entities
Sales History
8 recorded events · public records
Date
Price
Buyer
Seller
Deed Type
Mortgage
Mar 18, 2020
—
Technology Park Community Assn
Owner Name Unavailable
Warranty Deed
related
—
Mar 18, 2020
$11,147,618
Community Drive Burlington LLC
Owner Name Unavailable
Grant Deed
related
—
Mar 18, 2020
$6,918,700
55 Community Drive LLC
Owner Name Unavailable
Grant Deed
related
—
Feb 5, 2020
—
55 Community Drive LLC
Owner Name Unavailable
Grant Deed
related
—
Oct 2, 2017
—
Technology Park Partners LLC
Owner Name Unavailable
Warranty Deed
related
—
Dec 30, 2011
—
55 Community Drive LLC
—
Deed Of Trust
related
$7,750,000 · Nbt Bank NA
Apr 18, 2008
$1
55 Community Drive LLC
Technology Park Ptnrs LLC
Grant Deed
related
—
Dec 18, 2007
$1
Technology Park Ptnrs LLC
Technology Park Associate
Grant Deed
related
—
Coming soon
Costs & Benchmarks
Operating expenses, capex projections, utility benchmarks, and submarket comparables — all in one view.
Coming soon
Risks
Flood, climate, environmental, title, and tenant-concentration risk — surfaced with mitigations and source citations.
Try Rey
Ask anything about this address in plain English.
“Is 15.6% cap rate sustainable?” · “Best tenant mix for BU1?” · “What’s the redev upside?”
Full reports are paid
Unlock the full Property Analytics report
Start free for 7 days — no card required. Full owner contacts, all 4 valuations with methodology, refine flow, comparable adjustments, foot-traffic deep dive, export to PDF / CSV.


