
New search
Property profile & analytics
OFF-MARKET
Estimated value
$3,440,000
Parking lots & garages
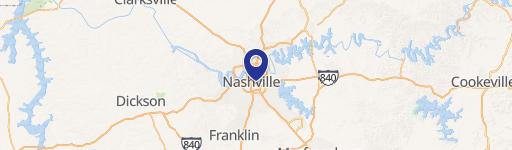
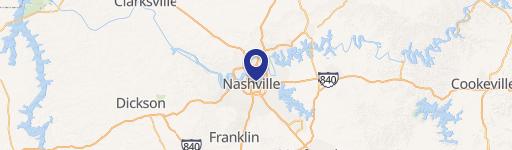
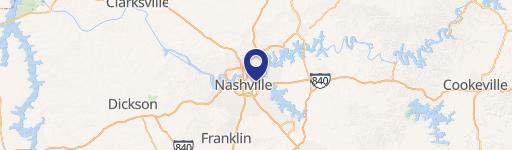
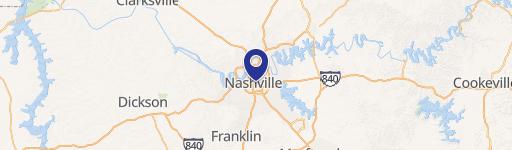
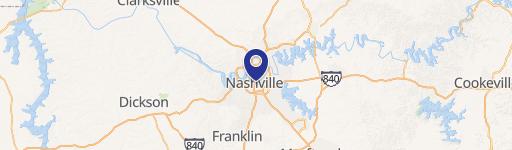
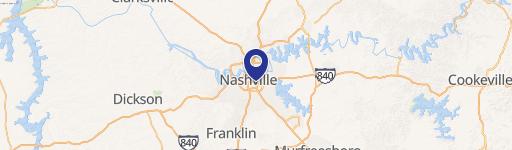
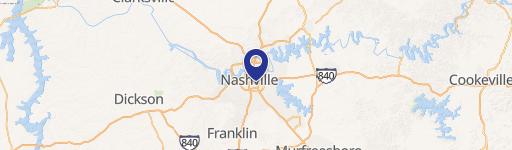
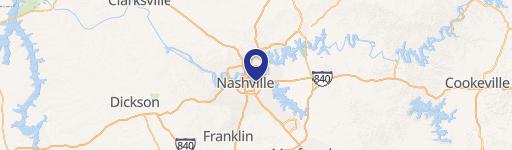
700 3rd S Ave, Nashville, TN 37210-2090
Entity Owned
5-yr Hold
Free & Clear
Property ID
US80-0911920
Property profile
Verified
Property type
Parking lots & garages
Use group
PARKING GARAGE, PARKING STRUCTURE
Year built
2019
Total area
65,628 SF
Lot
0.95 ac (41,382 SF)
Zoning code
DTC
APN
093-11-0-146-00
UPID
US80-0911920
Cap rate & NOI
Priority signal for investors
Implied cap rate, NOI & suggested price
Cap rate vs submarket · NOI estimate · 3 price anchors
Implied cap rate, NOI & suggested price
Cap vs submarket · NOI estimate · 3 price anchors
Value estimations
Realmo proprietary · 4 methods
AI Approach
AI
$3.87M
CAP Approach
CAP
by Request
Comparable Approach
Comparable
by Request
Blend (final)
Blend
$3.44M
Owner & transaction history
Lc Sobro I LLC · 5 yrs held
Lc Sobro I LLC
since 2020
Last sale
$3.0M
7 recorded transactions
Zoning & alternative use
DTC · Nashville, TN
Permitted uses
Permitted uses
Allowed · conditional · prohibited
Cap rate
Implied · in-place · derived from last sale + estimated NOI
Implied Cap rate
#1
Implied · in-place · NOI ÷ last sale
In-place · derived from last sale + estimated NOI
Cap rate, NOI & submarket benchmark
Implied cap rate vs Nashville submarket · NOI estimate · Typical band, median & reading
Implied cap rate, NOI & submarket benchmark
Cap vs Nashville submarket · NOI estimate · typical band, median & reading
Refine your cap rate
8-question underwriting flow
1.
Property current status — Going-In vs Stabilized
2.
Price for denominator — asking / offer / market
3.
Leasing status & lease structure (NNN / Gross)
4.
Tenant risk profile & vacancy assumption
5.
Upload T12 / rent roll / OM (optional)
Refine in 60 seconds, get exact suggested price
T12 upload · Submarket benchmarks · Sensitivity grid
Suggested price · 3 cap rate anchors
Income approach @ 5% / 7% / 9% — aggressive / typical / conservative
Suggested price at 5% / 7% / 9% cap
Aggressive / typical / conservative · Implied $/SF per anchor · Sensitivity grid
Suggested price at 5% / 7% / 9% cap
Aggressive / typical / conservative · implied $/SF · sensitivity
Value
AI, CAP & Alternative Use estimations · Realmo proprietary blendValue Estimations
Based on Realmo’s proprietary methodology
AI Approach
Method
Estimation
Statistic approach
$3,995,000
ML approach
$3,870,000
CAP Approach
CAP Return
Estimation
6%
by Request
6.5%
by Request
7%
by Request
Blend value · Realmo final
$3.44M
Range $3.10M – $3.78M · ±10% · vs last sale $2.95M (Sep 22 2020)
Last sale anchor
$2.95M
Sep 22 2020
Realmo estimate · informational only.
These numbers are calculated by our models from public records and may not reflect actual market value.
Not an appraisal.
Verify with a licensed appraiser before transacting. Realmo accepts no liability for divergence from real-world outcomes.
View the full estimation — every method, every assumption
Confidence drivers & risk notes · Custom comparable set · Free for first 3 / day
Full estimation methodology
Every method · every assumption · confidence drivers
Price per SF
Sale + rent benchmarks
Subject property
$52 / SF
Submarket sale & rent benchmarks
Median sale $/SF · Asking & closed rent · Submarket vacancy
Submarket sale & rent benchmarks
Median sale $/SF · asking & closed rent · submarket vacancy
Property tax & assessments
Tax year 2023Property tax & assessments
Tax year 2023
Tax billed
$441,330
Tax year 2023
Assessed value
$13,562,700
Assessed 2023
Previous assessed
$16,600,000
-18.3% YoY
Effective rate
3.25%
On assessed value
Assessed land
$2,648,440
Assessed improvement
$10,914,260
Land market value
$6,621,100
Improvement market value
$27,285,650
Total market value
$33,906,750
Comparables
6 recent transactions · within 1.5 miComparable in this city
6 recent transactions
Comparable in this City


Similar Nearby for Sale


Similar Nearby for Lease


Recent comparable sales
Sale price & price/SF · Sale date & distance · Adjustments & confidence
Recent comparable sales
Sale price & $/SF · sale date & distance · adjustments
Property description
Physical attributes from public recordsBuilding & lot
Public records
Property type
Parking lots & garages
Use group
PARKING GARAGE, PARKING STRUCTURE
Status
Off-Market
Year built
2019
Heating
NONE
Cooling
CENTRAL
Buildings
3
Stories
3
Total area
65,628 SF
Lot
0.95 ac (41,382 SF)
Zoning code
DTC
APN
093-11-0-146-00
UPID
US80-0911920
Jurisdiction
DAVIDSON
Zoning & alternative use
DTC · Nashville, TN
Zoning DTC · permitted uses
DTC · Nashville, TN
Permitted & conditional uses
Allowed uses · Special-permit conditions · Prohibited uses
Permitted & conditional uses
Allowed · special-permit conditions · prohibited
Nashville. Always verify with local authorities before improvements.
Building & site characteristics
From public records
Year built
2019
Heating
NONE
Cooling
Yes
Stories
3
Buildings
3
Lot
0.95 ac
Current owner
From public records · entity-resolved
Lc Sobro I LLC
Entity
Free & Clear · 5 yrs held
Mailing address
230 WW ST STE #200, COLUMBUS, OH 43215-2655
Ownership since
2020
Owner contacts — direct phone, email, and related entities
Decision-maker phone · Verified email · Related entities & filings
Owner contacts
Email · phone · related entities
Sales History
10 recorded events · public records
Date
Price
Buyer
Seller
Deed Type
Mortgage
Sep 23, 2020
—
Lc Sobro I LLC
—
Deed
related
$48,150,000 · Keybank USA
Sep 22, 2020
—
Lc Sobro I LLC
Lc Sobro LLC
Quit Claim Deed
related
—
Jan 17, 2018
—
Lc Sobro LLC
Lc Sobro LLC
Quit Claim Deed
related
—
Mar 31, 2017
—
Lc Sobro LLC
Richland South LLC
Quit Claim Deed
related
—
Mar 31, 2017
$2,950,000
Lc Sobro LLC
Richland South LLC
Grant Deed
—
Jun 8, 2016
$2,077,812
Richland South LLC
Edwards,james T JR & Alan A
Grant Deed
—
Mar 26, 2015
—
Edwards James T JR.
James Thomas Edwards Family Ll
Quit Claim Deed
related
—
Sep 18, 2012
—
James Thomas Edwards Family Ll
Edwards James T SR
Quit Claim Deed
related
—
Sep 17, 2012
—
James Thomas Edwards Family Ll
Edwards,evelyn
Quit Claim Deed
related
—
—
—
Lc Sobro I LLC
—
Loan Modification
related
$48,150,000 · Keybank USA
Coming soon
Costs & Benchmarks
Operating expenses, capex projections, utility benchmarks, and submarket comparables — all in one view.
Coming soon
Risks
Flood, climate, environmental, title, and tenant-concentration risk — surfaced with mitigations and source citations.
Try Rey
Ask anything about this address in plain English.
“Is 15.6% cap rate sustainable?” · “Best tenant mix for BU1?” · “What’s the redev upside?”
You own 700 3rd S Ave?
List it free. Reach 20,000 daily buyers.
We’ve already pulled the facts. Confirm photos + price and you’re live in 2 minutes.
List this address →
Full reports are paid
Unlock the full Property Analytics report
Start free for 7 days — no card required. Full owner contacts, all 4 valuations with methodology, refine flow, comparable adjustments, foot-traffic deep dive, export to PDF / CSV.


