
New search
Property profile & analytics
FOR LEASE
Retail properties & Spaces
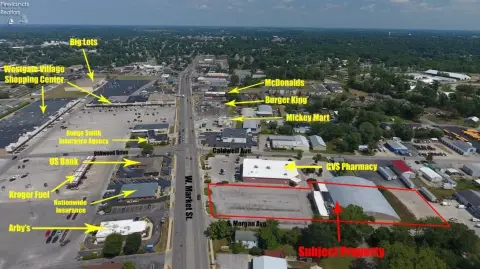
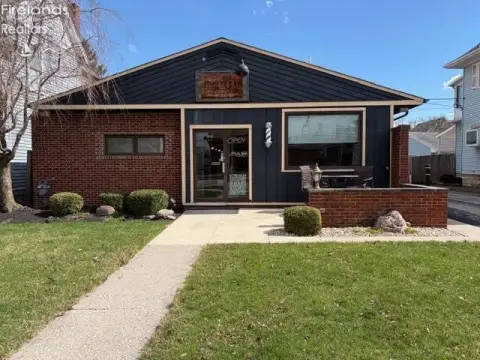
644 W Market St, Tiffin, OH 44883
Entity Owned
2-yr Hold
~
Est. High Equity
Property ID
US66-2909273
 For Lease
1 / 3
For Lease
1 / 3
$1,950,000
644 W Market St, Tiffin, OH 44883
View Listing →
Property profile
Verified
Property type
Retail properties & Spaces
Use group
DEPARTMENT STORE
Year built
1972
Construction
TYPE NOT SPECIFIED
Total area
49,100 SF
Lot
8.06 ac (351,006 SF)
APN
Q53031265000000
UPID
US66-2909273
Cap rate & NOI
Priority signal for investors
Implied cap rate, NOI & suggested price
Cap rate vs submarket · NOI estimate · 3 price anchors
Implied cap rate, NOI & suggested price
Cap vs submarket · NOI estimate · 3 price anchors
Value estimations
Realmo proprietary · 4 methods
AI Approach
AI
$1.95M
CAP Approach
CAP
by Request
Comparable Approach
Comparable
by Request
Blend (final)
Blend
$1.95M
Owner & transaction history
644 Market Street Tiffin Oh LLC · 2 yrs held
644 Market Street Tiffin Oh LLC
since 2024
Last sale
$2.0M
3 recorded transactions
Zoning & alternative use
Permitted uses
Permitted uses
Allowed · conditional · prohibited
Cap rate
Implied · in-place · derived from last sale + estimated NOI
Implied Cap rate
#1
Implied · in-place · NOI ÷ last sale
In-place · derived from last sale + estimated NOI
Cap rate, NOI & submarket benchmark
Implied cap rate vs Tiffin submarket · NOI estimate · Typical band, median & reading
Implied cap rate, NOI & submarket benchmark
Cap vs Tiffin submarket · NOI estimate · typical band, median & reading
Refine your cap rate
8-question underwriting flow
1.
Property current status — Going-In vs Stabilized
2.
Price for denominator — asking / offer / market
3.
Leasing status & lease structure (NNN / Gross)
4.
Tenant risk profile & vacancy assumption
5.
Upload T12 / rent roll / OM (optional)
Refine in 60 seconds, get exact suggested price
T12 upload · Submarket benchmarks · Sensitivity grid
Suggested price · 3 cap rate anchors
Income approach @ 5% / 7% / 9% — aggressive / typical / conservative
Suggested price at 5% / 7% / 9% cap
Aggressive / typical / conservative · Implied $/SF per anchor · Sensitivity grid
Suggested price at 5% / 7% / 9% cap
Aggressive / typical / conservative · implied $/SF · sensitivity
Value
AI, CAP & Alternative Use estimations · Realmo proprietary blendValue Estimations
Based on Realmo’s proprietary methodology
AI Approach
Method
Estimation
Statistic approach
$1,950,000
ML approach
$1,950,000
CAP Approach
CAP Return
Estimation
6%
by Request
6.5%
by Request
7%
by Request
Alternative Use
Use
Estimation
RETAIL STORES
$1,960,000
Current use
OFFICE BUILDING
$1,940,000
Change: -1% · Conversion: Easy
Blend value · Realmo final
$1.95M
Range $1.76M – $2.15M · ±10% · vs last sale $1.95M (Apr 25 2024)
Last sale anchor
$1.95M
Apr 25 2024
Realmo estimate · informational only.
These numbers are calculated by our models from public records and may not reflect actual market value.
Not an appraisal.
Verify with a licensed appraiser before transacting. Realmo accepts no liability for divergence from real-world outcomes.
View the full estimation — every method, every assumption
Confidence drivers & risk notes · Custom comparable set · Free for first 3 / day
Full estimation methodology
Every method · every assumption · confidence drivers
Price per SF
Sale + rent benchmarks
Subject property
$40 / SF
Submarket sale & rent benchmarks
Median sale $/SF · Asking & closed rent · Submarket vacancy
Submarket sale & rent benchmarks
Median sale $/SF · asking & closed rent · submarket vacancy
Property tax & assessments
Tax year 2023Property tax & assessments
Tax year 2023
Tax billed
$47,965
Tax year 2023
Assessed value
$656,160
Assessed 2023
Previous assessed
$396,070
+65.7% YoY
Effective rate
7.31%
On assessed value
Assessed land
$281,920
Assessed improvement
$374,240
Land market value
$805,480
Improvement market value
$1,069,270
Total market value
$1,874,750
Comparables
6 recent transactions · within 1.5 miComparable in this city
6 recent transactions
Comparable in this City


Similar Nearby for Sale


Similar Nearby for Lease


Recent comparable sales
Sale price & price/SF · Sale date & distance · Adjustments & confidence
Recent comparable sales
Sale price & $/SF · sale date & distance · adjustments
Property description
Physical attributes from public recordsBuilding & lot
Public records
Property type
Retail properties & Spaces
Use group
DEPARTMENT STORE
Status
For Lease
Year built
1972
Construction
TYPE NOT SPECIFIED
Heating
OTHER
Cooling
CENTRAL
Stories
1
Units
80
Total area
49,100 SF
Lot
8.06 ac (351,006 SF)
APN
Q53031265000000
UPID
US66-2909273
Jurisdiction
SENECA
Zoning & alternative use
Zoning · permitted uses
Permitted & conditional uses
Allowed uses · Special-permit conditions · Prohibited uses
Permitted & conditional uses
Allowed · special-permit conditions · prohibited
Alternative use value scenarios
Repositioning upside vs current use
RETAIL STORES Current
Est. value
$2.0M
OFFICE BUILDING
Est. value
$1.9M
RETAIL STORES Current
OFFICE BUILDING
Alternative use deep dive — conversion cost, permits, timeline
Conversion cost estimate · Permit path & risks · Stabilized NOI per option
Alternative use deep dive
Conversion cost · permit path · stabilized NOI per option
Building & site characteristics
From public records
Year built
1972
Construction
TYPE NOT SPECIFIED
Heating
OTHER
Cooling
Yes
Stories
1
Units
80
Lot
8.06 ac
Current owner
From public records · entity-resolved
644 Market Street Tiffin Oh LLC
Entity
Mailing address
7917 CSWY BLVD N, ST PETERSBURG, FL 33707-1007
Ownership since
2024
Owner contacts — direct phone, email, and related entities
Decision-maker phone · Verified email · Related entities & filings
Owner contacts
Email · phone · related entities
Sales History
3 recorded events · public records
Date
Price
Buyer
Seller
Deed Type
Mortgage
Apr 25, 2024
$1,950,000
644 Market Street Tiffin Oh LLC
Nwo Partnership LLC
Warranty Deed
—
Dec 17, 2007
$1,272,000
Nwo Ptshp LLC
Sandusco INC
Grant Deed
$1,017,600 · Signature Bank
—
—
Sandusco INC
—
Deed Of Trust
related
$1,000,000 · Key Bank NA
Coming soon
Costs & Benchmarks
Operating expenses, capex projections, utility benchmarks, and submarket comparables — all in one view.
Coming soon
Risks
Flood, climate, environmental, title, and tenant-concentration risk — surfaced with mitigations and source citations.
Try Rey
Ask anything about this address in plain English.
“Is 15.6% cap rate sustainable?” · “Best tenant mix for BU1?” · “What’s the redev upside?”
Full reports are paid
Unlock the full Property Analytics report
Start free for 7 days — no card required. Full owner contacts, all 4 valuations with methodology, refine flow, comparable adjustments, foot-traffic deep dive, export to PDF / CSV.


