
New search
Property profile & analytics
OFF-MARKET
Estimated value
$13,485,000
Showrooms
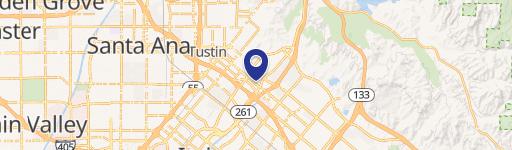
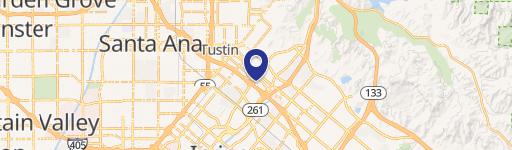
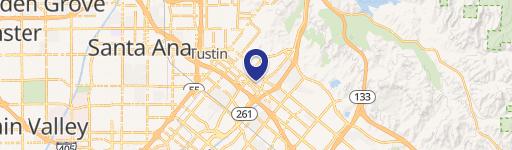
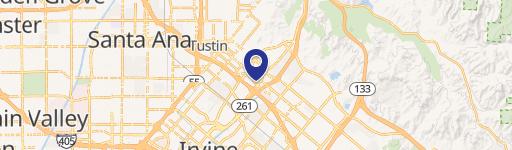
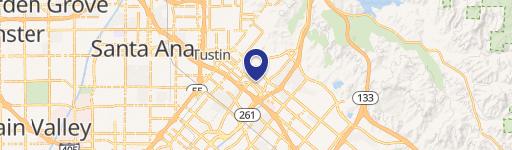
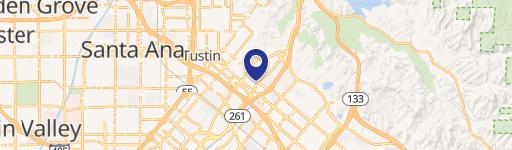
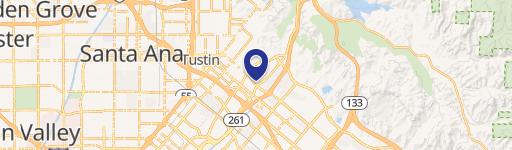
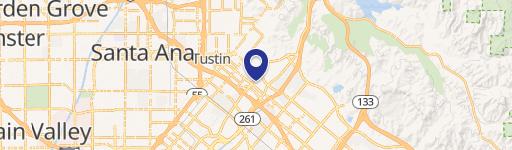
2530 Bryan Ave, Tustin, CA 92782-8916
Entity Owned
4-yr Hold
Absentee Owner
~
Est. High Equity
Property ID
US09-2709847
Property profile
Verified
Property type
Showrooms
Use group
SHOW ROOM, WAREHOUSE
Lot
0.76 ac (33,206 SF)
APN
500-185-02
UPID
US09-2709847
Cap rate & NOI
Priority signal for investors
Implied cap rate, NOI & suggested price
Cap rate vs submarket · NOI estimate · 3 price anchors
Implied cap rate, NOI & suggested price
Cap vs submarket · NOI estimate · 3 price anchors
Current use
Occupant on record · Public records
-
Susan Chen, OD Physician
-
Dream Med Spa Spa & Massage Center Alternative Medicine Practice
-
Chase Cleaners - Tustin (Bike/Boat/Book/etc) Store
-
Lulu Y. Kim, OD Pharmacy
-
Dentistry Now Dental Office
Value estimations
Realmo proprietary · 4 methods
AI Approach
AI
$8.77M
CAP Approach
CAP
by Request
Comparable Approach
Comparable
by Request
Blend (final)
Blend
$13.49M
Owner & transaction history
Costco Wholesale Corporation · 4 yrs held
Costco Wholesale Corporation
since 2022
Last sale
$13.9M
7 recorded transactions
Zoning & alternative use
Permitted uses
Permitted uses
Allowed · conditional · prohibited
Cap rate
Implied · in-place · derived from last sale + estimated NOI
Implied Cap rate
#1
Implied · in-place · NOI ÷ last sale
In-place · derived from last sale + estimated NOI
Cap rate, NOI & submarket benchmark
Implied cap rate vs Tustin submarket · NOI estimate · Typical band, median & reading
Implied cap rate, NOI & submarket benchmark
Cap vs Tustin submarket · NOI estimate · typical band, median & reading
Refine your cap rate
8-question underwriting flow
1.
Property current status — Going-In vs Stabilized
2.
Price for denominator — asking / offer / market
3.
Leasing status & lease structure (NNN / Gross)
4.
Tenant risk profile & vacancy assumption
5.
Upload T12 / rent roll / OM (optional)
Refine in 60 seconds, get exact suggested price
T12 upload · Submarket benchmarks · Sensitivity grid
Suggested price · 3 cap rate anchors
Income approach @ 5% / 7% / 9% — aggressive / typical / conservative
Suggested price at 5% / 7% / 9% cap
Aggressive / typical / conservative · Implied $/SF per anchor · Sensitivity grid
Suggested price at 5% / 7% / 9% cap
Aggressive / typical / conservative · implied $/SF · sensitivity
Value
AI, CAP & Alternative Use estimations · Realmo proprietary blendValue Estimations
Based on Realmo’s proprietary methodology
AI Approach
Method
Estimation
Statistic approach
$12,655,000
ML approach
$8,765,000
CAP Approach
CAP Return
Estimation
6%
by Request
6.5%
by Request
7%
by Request
Blend value · Realmo final
$13.49M
Range $12.14M – $14.83M · ±10% · vs last sale $13.90M (Apr 11 2022)
Last sale anchor
$13.90M
Apr 11 2022
Realmo estimate · informational only.
These numbers are calculated by our models from public records and may not reflect actual market value.
Not an appraisal.
Verify with a licensed appraiser before transacting. Realmo accepts no liability for divergence from real-world outcomes.
View the full estimation — every method, every assumption
Confidence drivers & risk notes · Custom comparable set · Free for first 3 / day
Full estimation methodology
Every method · every assumption · confidence drivers
Price per SF
Sale + rent benchmarks
Subject property
—
Submarket sale & rent benchmarks
Median sale $/SF · Asking & closed rent · Submarket vacancy
Submarket sale & rent benchmarks
Median sale $/SF · asking & closed rent · submarket vacancy
Property tax & assessments
Tax year 2024Property tax & assessments
Tax year 2024
Tax billed
$77,416
Tax year 2024
Assessed value
$7,101,770
Assessed 2024
Previous assessed
$7,101,770
+0.0% YoY
Effective rate
1.09%
On assessed value
Assessed land
$6,227,806
Assessed improvement
$873,964
Applied tax rate
13.0000
Comparables
6 recent transactions · within 1.5 miComparable in this city
6 recent transactions
Comparable in this City
Similar Nearby for Sale


Similar Nearby for Lease


Recent comparable sales
Sale price & price/SF · Sale date & distance · Adjustments & confidence
Recent comparable sales
Sale price & $/SF · sale date & distance · adjustments
Property description
Physical attributes from public recordsBuilding & lot
Public records
Property type
Showrooms
Use group
SHOW ROOM, WAREHOUSE
Status
Off-Market
Heating
NONE
Lot
0.76 ac (33,206 SF)
APN
500-185-02
UPID
US09-2709847
Jurisdiction
ORANGE
Metro division
SANTA ANA-ANAHEIM-IRVINE, CA METROPOLITAN DIVISION
Zoning & alternative use
Zoning · permitted uses
Permitted & conditional uses
Allowed uses · Special-permit conditions · Prohibited uses
Permitted & conditional uses
Allowed · special-permit conditions · prohibited
Building & site characteristics
From public records
Heating
NONE
Lot
0.76 ac
Current owner
From public records · entity-resolved
Costco Wholesale Corporation
Entity
Mailing address
999 LK DR, ISSAQUAH, WA 98027-8990
Mailing matches property
Different — outreach signal
Owner-occupied
No
Ownership since
2022
Owner contacts — direct phone, email, and related entities
Decision-maker phone · Verified email · Related entities & filings
Owner contacts
Email · phone · related entities
Sales History
10 recorded events · public records
Date
Price
Buyer
Seller
Deed Type
Mortgage
Apr 11, 2022
$13,900,000
Costco Wholesale Corporation
Nextgen Property Investment LLC
Grant Deed
—
Apr 11, 2022
—
Costco Wholesale Corporation
Irvine Community Development Compan
Intrafamily Transfer
related
—
Jun 20, 2002
—
Nextgen Prop Inv
Ching
Grant Deed
related
—
Aug 30, 2001
—
Tony L Ching
—
Deed Of Trust
related
$2,590,000 · International Bank California
Apr 4, 2001
—
Sbw Dev
—
Grant Deed
related
—
Jan 5, 2000
—
Scec
Sbw,
Grant Deed
related
—
May 6, 1999
$1,335,000
Sb Development-tustin
Irvine Community Dev Co
Grant Deed
$2,162,000 · Southern California Bank
Jan 2, 1997
—
Comm Dev Irvine
Irvine,
Quit Claim Deed
related
—
—
—
Sb & W Development-tustin LLC
—
Deed Of Trust
related
$2,250,000 · Gateway Mortgage Corp
—
—
Nextgen Property Invs LLC
—
Deed Of Trust
related
$2,180,000 · Kinecta FCU
Coming soon
Costs & Benchmarks
Operating expenses, capex projections, utility benchmarks, and submarket comparables — all in one view.
Coming soon
Risks
Flood, climate, environmental, title, and tenant-concentration risk — surfaced with mitigations and source citations.
Try Rey
Ask anything about this address in plain English.
“Is 15.6% cap rate sustainable?” · “Best tenant mix for BU1?” · “What’s the redev upside?”
You own 2530 Bryan Ave?
List it free. Reach 20,000 daily buyers.
We’ve already pulled the facts. Confirm photos + price and you’re live in 2 minutes.
List this address →
Full reports are paid
Unlock the full Property Analytics report
Start free for 7 days — no card required. Full owner contacts, all 4 valuations with methodology, refine flow, comparable adjustments, foot-traffic deep dive, export to PDF / CSV.


