
New search
Property profile & analytics
FOR LEASE
Manufacturing properties
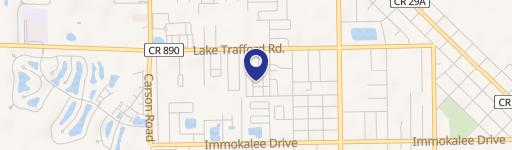
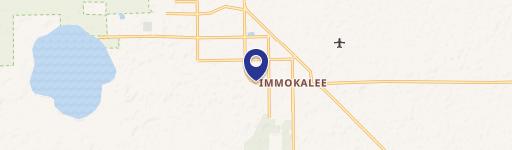
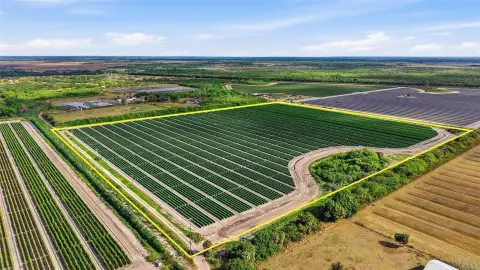
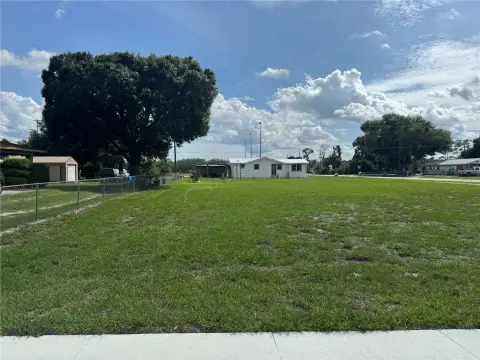
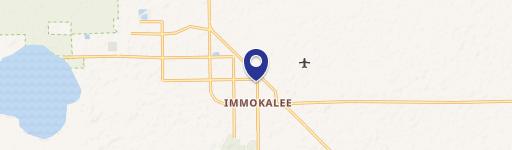
2050 Commerce Ave, Immokalee, FL 34142
Entity Owned
4-yr Hold
Absentee Owner
~
Est. High Equity
Property ID
US18-4577655
 For Lease
1 / 2
For Lease
1 / 2
$11 SF/Yr
2050 Commerce Ave, Immokalee, FL 34142
View Listing →
Property profile
Verified
Property type
Manufacturing properties
Use group
FACTORY (MANUFACTURING)
Year built
2007
Total area
30,000 SF
Lot
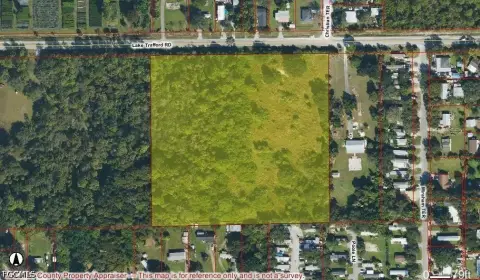
2.52 ac (109,771 SF)
Zoning code
I
APN
51202520858
UPID
US18-4577655
Cap rate & NOI
Priority signal for investors
Implied cap rate, NOI & suggested price
Cap rate vs submarket · NOI estimate · 3 price anchors
Implied cap rate, NOI & suggested price
Cap vs submarket · NOI estimate · 3 price anchors
Value estimations
Realmo proprietary · 4 methods
AI Approach
AI
$3.91M
CAP Approach
CAP
$3.11M
Comparable Approach
Comparable
by Request
Blend (final)
Blend
$3.61M
Owner & transaction history
Cjk 2050 Commerce LLC · 4 yrs held
Cjk 2050 Commerce LLC
since 2022
Last sale
$3.6M
7 recorded transactions
Zoning & alternative use
I · Immokalee, FL
Permitted uses
Permitted uses
Allowed · conditional · prohibited
Cap rate
Implied · in-place · derived from last sale + estimated NOI
Implied Cap rate
#1
Implied · in-place · NOI ÷ last sale
In-place · derived from last sale + estimated NOI
Cap rate, NOI & submarket benchmark
Implied cap rate vs Immokalee submarket · NOI estimate · Typical band, median & reading
Implied cap rate, NOI & submarket benchmark
Cap vs Immokalee submarket · NOI estimate · typical band, median & reading
Refine your cap rate
8-question underwriting flow
1.
Property current status — Going-In vs Stabilized
2.
Price for denominator — asking / offer / market
3.
Leasing status & lease structure (NNN / Gross)
4.
Tenant risk profile & vacancy assumption
5.
Upload T12 / rent roll / OM (optional)
Refine in 60 seconds, get exact suggested price
T12 upload · Submarket benchmarks · Sensitivity grid
Suggested price · 3 cap rate anchors
Income approach @ 5% / 7% / 9% — aggressive / typical / conservative
Suggested price at 5% / 7% / 9% cap
Aggressive / typical / conservative · Implied $/SF per anchor · Sensitivity grid
Suggested price at 5% / 7% / 9% cap
Aggressive / typical / conservative · implied $/SF · sensitivity
Value
AI, CAP & Alternative Use estimations · Realmo proprietary blendValue Estimations
Based on Realmo’s proprietary methodology
AI Approach
Method
Estimation
Statistic approach
$3,885,000
ML approach
$3,910,000
CAP Approach
CAP Return
Estimation
6%
$3,365,000
6.5%
$3,105,000
7%
$2,885,000
Blend value · Realmo final
$3.61M
Range $3.25M – $3.97M · ±10% · vs last sale $3.57M (Apr 28 2022)
Last sale anchor
$3.57M
Apr 28 2022
Realmo estimate · informational only.
These numbers are calculated by our models from public records and may not reflect actual market value.
Not an appraisal.
Verify with a licensed appraiser before transacting. Realmo accepts no liability for divergence from real-world outcomes.
View the full estimation — every method, every assumption
Confidence drivers & risk notes · Custom comparable set · Free for first 3 / day
Full estimation methodology
Every method · every assumption · confidence drivers
Price per SF
Sale + rent benchmarks
Subject property
$120 / SF
Submarket sale & rent benchmarks
Median sale $/SF · Asking & closed rent · Submarket vacancy
Submarket sale & rent benchmarks
Median sale $/SF · asking & closed rent · submarket vacancy
Property tax & assessments
Tax year 2023Property tax & assessments
Tax year 2023
Tax billed
$34,525
Tax year 2023
Assessed value
$2,545,752
Assessed 2023
Previous assessed
$1,795,014
+41.8% YoY
Effective rate
1.36%
On assessed value
Assessed land
$137,214
Assessed improvement
$2,408,538
Land market value
$137,214
Improvement market value
$2,408,538
Total market value
$2,545,752
Applied tax rate
67.0000
Comparables
6 recent transactions · within 1.5 miComparable in this city
6 recent transactions
Comparable in this City
Similar Nearby for Sale
Similar Nearby for Lease


Recent comparable sales
Sale price & price/SF · Sale date & distance · Adjustments & confidence
Recent comparable sales
Sale price & $/SF · sale date & distance · adjustments
Property description
Physical attributes from public recordsBuilding & lot
Public records
Property type
Manufacturing properties
Use group
FACTORY (MANUFACTURING)
Status
For Lease
Year built
2007
Heating
NONE
Stories
1
Total area
30,000 SF
Lot
2.52 ac (109,771 SF)
Zoning code
I
APN
51202520858
UPID
US18-4577655
Jurisdiction
COLLIER
Zoning & alternative use
I · Immokalee, FL
Zoning I · permitted uses
I · Immokalee, FL
Permitted & conditional uses
Allowed uses · Special-permit conditions · Prohibited uses
Permitted & conditional uses
Allowed · special-permit conditions · prohibited
Immokalee. Always verify with local authorities before improvements.
Building & site characteristics
From public records
Year built
2007
Heating
NONE
Stories
1
Lot
2.52 ac
Current owner
From public records · entity-resolved
Cjk 2050 Commerce LLC
Entity
Mailing address
1180 SAINT GEORGES AVE, AVENEL, NJ 07001-1278
Mailing matches property
Different — outreach signal
Owner-occupied
No
Ownership since
2022
Owner contacts — direct phone, email, and related entities
Decision-maker phone · Verified email · Related entities & filings
Owner contacts
Email · phone · related entities
Sales History
7 recorded events · public records
Date
Price
Buyer
Seller
Deed Type
Mortgage
Apr 28, 2022
$3,570,000
Cjk 2050 Commerce LLC
Staffordshire Properties USA INC
Warranty Deed
$2,580,000 · Us Century Bank
May 5, 2021
—
Staffordshire Properties INC
Training And Manufacturing Institut
Correction Deed
related
—
Mar 4, 2020
—
Staffordshire Prop USA INC
—
Deed
related
$990,000 · Lake Mi Cu
Aug 1, 2017
$1,775,000
Staffordshire Properties INC
Training & Mfg Inst INC
Warranty Deed
—
May 2, 2005
$300,000
Training & Mfg Inst INC
Dlc Properties LLC
Warranty Deed
—
Jun 14, 2004
$170,300
Dlc Properties LLC
Collier Ents Ltd
Warranty Deed
—
—
—
Staffordshire Prop USA INC
—
Deed Of Trust
related
$990,000 · Lake Mi Cu
Coming soon
Costs & Benchmarks
Operating expenses, capex projections, utility benchmarks, and submarket comparables — all in one view.
Coming soon
Risks
Flood, climate, environmental, title, and tenant-concentration risk — surfaced with mitigations and source citations.
Try Rey
Ask anything about this address in plain English.
“Is 15.6% cap rate sustainable?” · “Best tenant mix for BU1?” · “What’s the redev upside?”
Full reports are paid
Unlock the full Property Analytics report
Start free for 7 days — no card required. Full owner contacts, all 4 valuations with methodology, refine flow, comparable adjustments, foot-traffic deep dive, export to PDF / CSV.


