
New search
Property profile & analytics
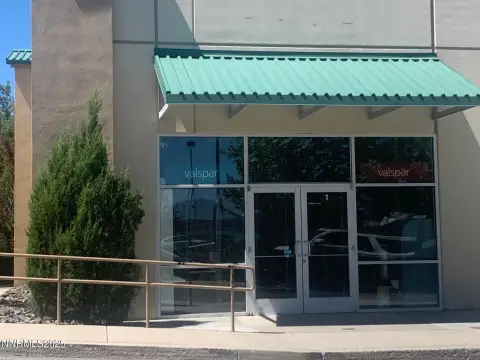
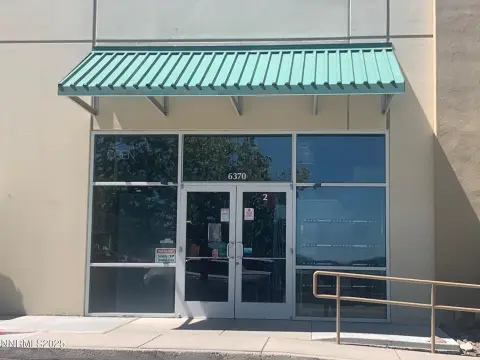
FOR LEASE
Strip malls
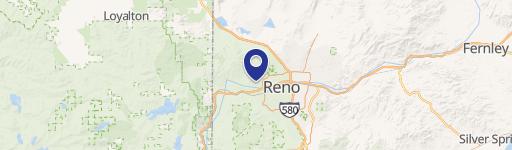
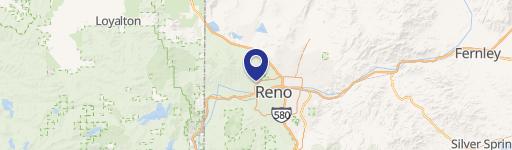
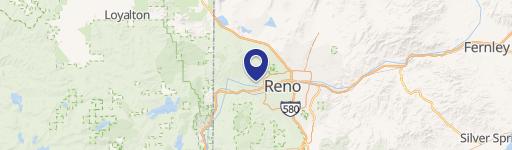
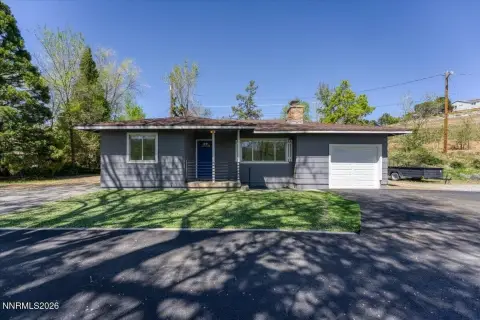
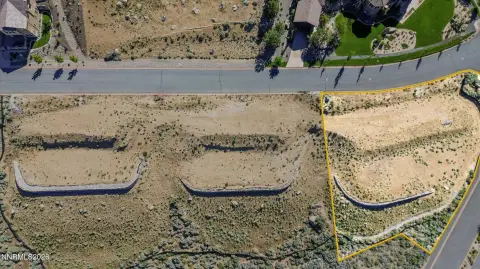
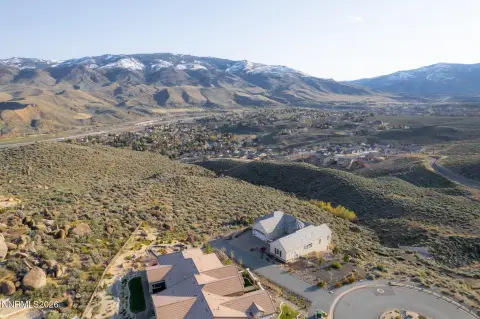
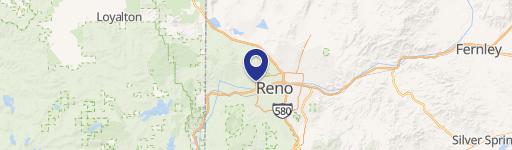
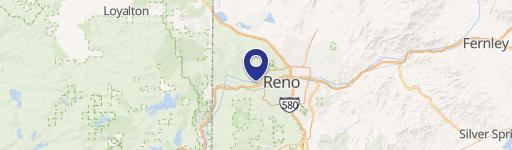
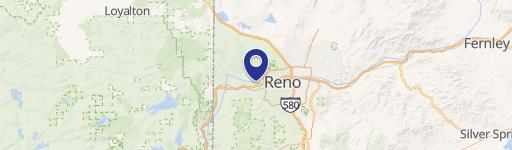
1675 Robb Dr, Reno, NV 89523
Entity Owned
13-yr Hold
Free & Clear
Property ID
US62-0378379
 For Lease
1 / 2
For Lease
1 / 2
$3,456/Mo
1675 Robb Dr, Reno, NV 89523
View Listing →
Property profile
Verified
Property type
Strip malls
Use group
SHOPPING CENTER, STRIP CENTER
Year built
2005
Construction
MASONRY/CONCRETE MASONRY UNITS (CMUS)
Total area
9,600 SF
Lot
0.22 ac (9,600 SF)
Zoning code
NC
APN
200-590-11
UPID
US62-0378379
Cap rate & NOI
Priority signal for investors
Implied cap rate, NOI & suggested price
Cap rate vs submarket · NOI estimate · 3 price anchors
Implied cap rate, NOI & suggested price
Cap vs submarket · NOI estimate · 3 price anchors
Current use
Occupant on record · Public records
-
Domino's Pizza Take-out & Catering
-
Grow Today Therapy Counselor
-
Ciara Hayes Medical Clinic
-
Better Homes and Gardens Real Estate Mason-McDuffie Real Estate Agency
-
Schuler Real Estate Of Krch Realty Real Estate Agency
Value estimations
Realmo proprietary · 4 methods
AI Approach
AI
by Request
CAP Approach
CAP
$2.15M
Comparable Approach
Comparable
by Request
Blend (final)
Blend
$1.61M
Owner & transaction history
Vicks Investment LLC · 13 yrs held
Vicks Investment LLC
since 2013
4 recorded transactions
Zoning & alternative use
NC · Reno, NV
Permitted uses
Permitted uses
Allowed · conditional · prohibited
Cap rate
Implied · in-place · derived from last sale + estimated NOI
Implied Cap rate
#1
Implied · in-place · NOI ÷ last sale
In-place · derived from last sale + estimated NOI
Cap rate, NOI & submarket benchmark
Implied cap rate vs Reno submarket · NOI estimate · Typical band, median & reading
Implied cap rate, NOI & submarket benchmark
Cap vs Reno submarket · NOI estimate · typical band, median & reading
Refine your cap rate
8-question underwriting flow
1.
Property current status — Going-In vs Stabilized
2.
Price for denominator — asking / offer / market
3.
Leasing status & lease structure (NNN / Gross)
4.
Tenant risk profile & vacancy assumption
5.
Upload T12 / rent roll / OM (optional)
Refine in 60 seconds, get exact suggested price
T12 upload · Submarket benchmarks · Sensitivity grid
Suggested price · 3 cap rate anchors
Income approach @ 5% / 7% / 9% — aggressive / typical / conservative
Suggested price at 5% / 7% / 9% cap
Aggressive / typical / conservative · Implied $/SF per anchor · Sensitivity grid
Suggested price at 5% / 7% / 9% cap
Aggressive / typical / conservative · implied $/SF · sensitivity
Value
AI, CAP & Alternative Use estimations · Realmo proprietary blendValue Estimations
Based on Realmo’s proprietary methodology
AI Approach
Method
Estimation
Statistic approach
by Request
ML approach
by Request
CAP Approach
CAP Return
Estimation
6%
$2,325,000
6.5%
$2,145,000
7%
$1,990,000
Blend value · Realmo final
$1.61M
Range $1.45M – $1.77M · ±10%
Realmo estimate · informational only.
These numbers are calculated by our models from public records and may not reflect actual market value.
Not an appraisal.
Verify with a licensed appraiser before transacting. Realmo accepts no liability for divergence from real-world outcomes.
View the full estimation — every method, every assumption
Confidence drivers & risk notes · Custom comparable set · Free for first 3 / day
Full estimation methodology
Every method · every assumption · confidence drivers
Price per SF
Sale + rent benchmarks
Subject property
$168 / SF
Submarket sale & rent benchmarks
Median sale $/SF · Asking & closed rent · Submarket vacancy
Submarket sale & rent benchmarks
Median sale $/SF · asking & closed rent · submarket vacancy
Property tax & assessments
Tax year 2023Property tax & assessments
Tax year 2023
Tax billed
$16,253
Tax year 2023
Assessed value
$497,919
Assessed 2023
Previous assessed
$410,822
+21.2% YoY
Effective rate
3.26%
On assessed value
Assessed land
$168,000
Assessed improvement
$329,919
Land market value
$480,000
Improvement market value
$942,627
Total market value
$1,422,627
Applied tax rate
1,000.0000
Comparables
6 recent transactions · within 1.5 miComparable in this city
6 recent transactions
Comparable in this City


Similar Nearby for Sale


Similar Nearby for Lease

Recent comparable sales
Sale price & price/SF · Sale date & distance · Adjustments & confidence
Recent comparable sales
Sale price & $/SF · sale date & distance · adjustments
Property description
Physical attributes from public recordsBuilding & lot
Public records
Property type
Strip malls
Use group
SHOPPING CENTER, STRIP CENTER
Status
For Lease
Year built
2005
Construction
MASONRY/CONCRETE MASONRY UNITS (CMUS)
Heating
YES
Cooling
YES
Stories
1
Units
1
Total area
9,600 SF
Lot
0.22 ac (9,600 SF)
Zoning code
NC
APN
200-590-11
UPID
US62-0378379
Jurisdiction
WASHOE
Zoning & alternative use
NC · Reno, NV
Zoning NC · permitted uses
NC · Reno, NV
Permitted & conditional uses
Allowed uses · Special-permit conditions · Prohibited uses
Permitted & conditional uses
Allowed · special-permit conditions · prohibited
Reno. Always verify with local authorities before improvements.
Building & site characteristics
From public records
Year built
2005
Construction
MASONRY/CONCRETE MASONRY UNITS (CMUS)
Heating
YES
Cooling
Yes
Stories
1
Units
1
Lot
0.22 ac
Current owner
From public records · entity-resolved
Vicks Investment LLC
Entity
Free & Clear · 13 yrs held
Mailing address
2445 FARETTO LN, RENO, NV 89511-7601
Ownership since
2013
Owner contacts — direct phone, email, and related entities
Decision-maker phone · Verified email · Related entities & filings
Owner contacts
Email · phone · related entities
Sales History
4 recorded events · public records
Date
Price
Buyer
Seller
Deed Type
Mortgage
Jan 28, 2013
$1,500,000
Vicks Investment LLC
Alpha Opportunity Fund I LLC
Grant Deed
—
Jan 4, 2013
$1,000,000
Alpha Opportunity Fund I LLC
Fidelity Natl Title Ins
Trustees Deed
related
—
Aug 19, 2005
—
Quail North West Phase I LLC
Quail North West LLC
Quit Claim Deed
$3,400,000 · Skymar Capital Corp
Nov 5, 2004
—
Owner Name Unavailable
Owner Name Unavailable
Quit Claim Deed
related
—
Coming soon
Costs & Benchmarks
Operating expenses, capex projections, utility benchmarks, and submarket comparables — all in one view.
Coming soon
Risks
Flood, climate, environmental, title, and tenant-concentration risk — surfaced with mitigations and source citations.
Try Rey
Ask anything about this address in plain English.
“Is 15.6% cap rate sustainable?” · “Best tenant mix for BU1?” · “What’s the redev upside?”
Full reports are paid
Unlock the full Property Analytics report
Start free for 7 days — no card required. Full owner contacts, all 4 valuations with methodology, refine flow, comparable adjustments, foot-traffic deep dive, export to PDF / CSV.


